JUMP TO TOPIC
Graphs of Logarithmic Function – Explanation & Examples
 Having defined that, the logarithmic function y = log b x is the inverse function of the exponential function y = b x. We can now proceed to graphing logarithmic functions by looking at the relationship between exponential and logarithmic functions.
But before jumping into the topic of graphing logarithmic functions, it important we familiarize ourselves with the following terms:
- The domain of a function
The domain of a function is a set of values you can substitute in the function to get an acceptable answer.
- The range of a function
This is the set of values you obtain after substituting the values in the domain for the variable.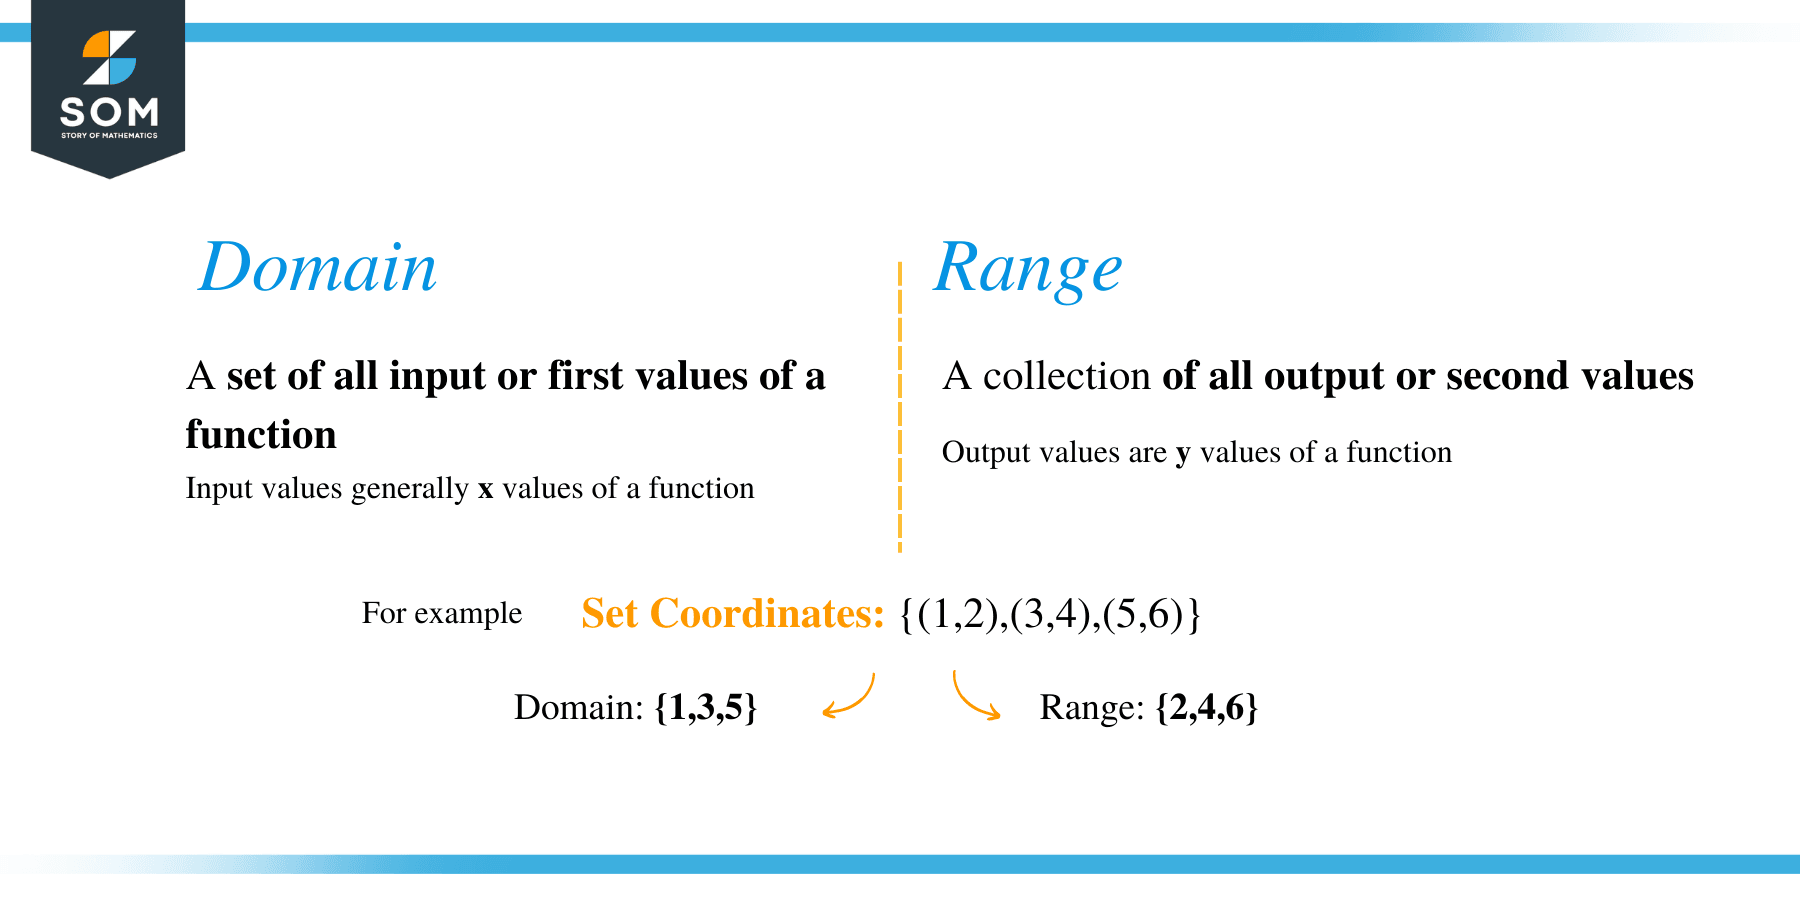
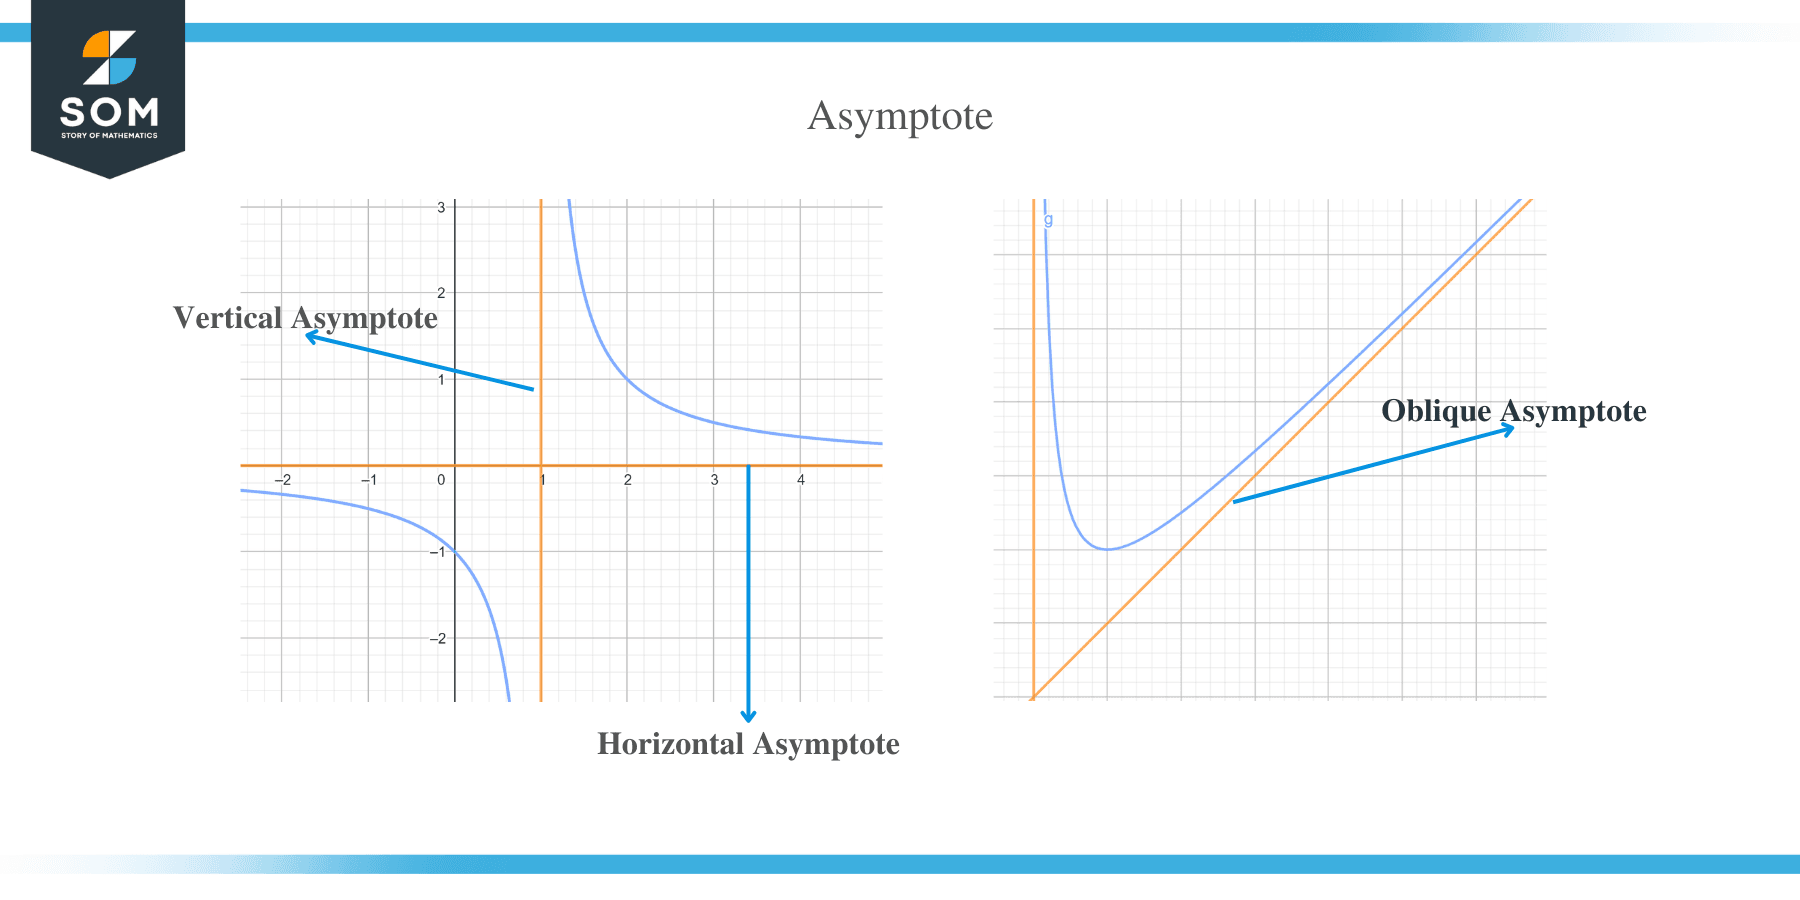
- Asymptotes
There are three types of asymptotes, namely; vertical, horizontal, and oblique. The vertical asymptote is the value of x where function grows without bound nearby.
Horizontal asymptotes are constant values that f(x) approaches as x grows without bound. Oblique asymptotes are first degree polynomials which f(x) gets close as x grows without bound.
How to Graph Logarithmic Functions?
Graphing a logarithmic function can be done by examining the exponential function graph and then swapping x and y.
The graph of an exponential function f (x) = b x or y = b x contains the following features:
- The domain of an exponential function is real numbers (-infinity, infinity).
- The range is also positive real numbers (0, infinity)
- The graph of an exponential function normally passes through the point (0, 1). This means that the y – intercept is at the point (0, 1).
- The graph of an exponential function f(x) = b x has a horizontal asymptote at y = 0.
- An exponential graph decreases from left to right if 0 < b < 1, and this case is known as exponential decay.
- If the base of the function f(x) = b x is greater than 1, then its graph will increase from left to right and is called exponential growth.
By looking at the above features one at a time, we can similarly deduce features of logarithmic functions as follows:
- A logarithmic function will have the domain as (0, infinity).
- The range of a logarithmic function is (−infinity, infinity).
- The logarithmic function graph passes through the point (1, 0), which is the inverse of (0, 1) for an exponential function.
- The graph of a logarithmic function has a vertical asymptote at x = 0.
- The graph of a logarithmic function will decrease from left to right if 0 < b < 1.
- And if the base of the function is greater than 1, b > 1, then the graph will increase from left to right.
How to graph a basic logarithmic function?
A basic logarithmic function is generally a function with no horizontal or vertical shift.
Here are the steps for creating a graph of a basic logarithmic function.
- Since all logarithmic functions pass through the point (1, 0), we locate and place a dot at the point.
- To prevent the curve from touching the y-axis, we draw an asymptote at x = 0.
- If the base of the function is greater than 1, increase your curve from left to right. Similarly, if the base is less than 1, decrease the curve from left to right.
Now let’s look at the following examples:
Example 1
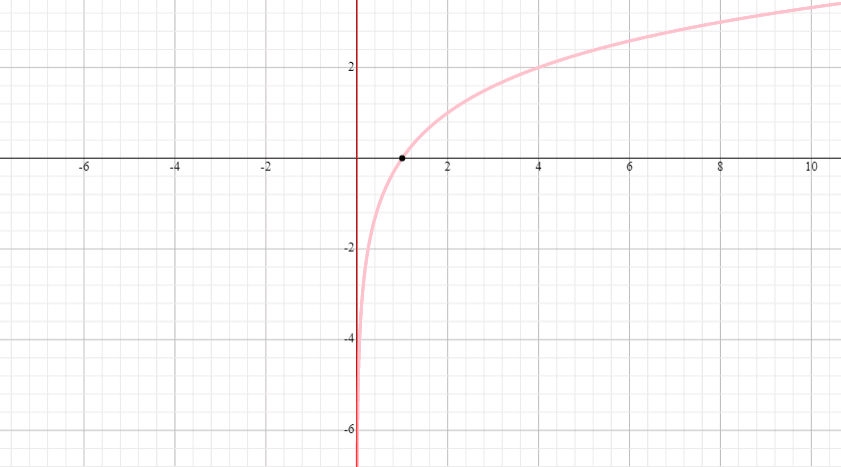
Graph the logarithmic function f(x) = log 2 x and state range and domain of the function.
Solution
- Obviously, a logarithmic function must have the domain and range of (0, infinity) and (−infinity, infinity)
- Since the function f(x) = log 2 x is greater than 1, we will increase our curve from left to right, a shown below.
- We can’t view the vertical asymptote at x = 0 because it’s hidden by the y- axis.
Example 2
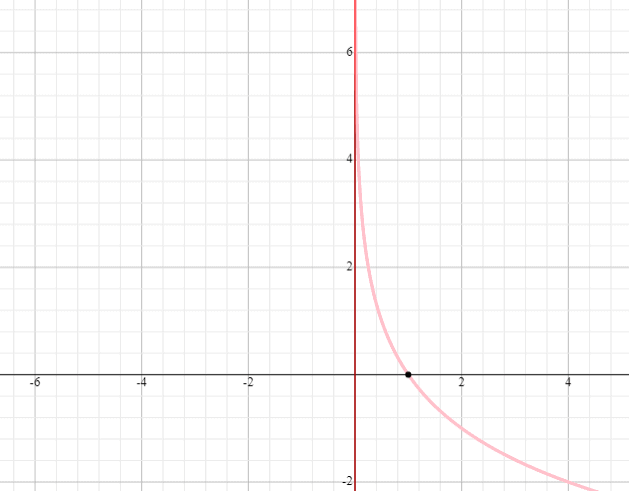
Draw a graph of y = log 0.5 x
Solution
- Place a dot at the point (1, 0). All logarithmic curves pass through this point.
- Draw an asymptote at x = 0.
- Since the base of the function y = log 5 x is less than 1, we will decrease our curve from left to right.
- The function y = log 5 x will also have (0, infinity) and (−infinity, infinity) as the domain and range.
Graphing a logarithmic function with a horizontal shift
Logarithmic functions with a horizontal shift are of the form f(x) = log b (x + h) or f (x) = log b (x – h), where h = the horizontal shift. The sign of the horizontal shift determines the direction of the shift. If the sign is positive, the shift will be negative, and if the sign is negative, the shift becomes positive.
By applying the horizontal shift, the features of a logarithmic function are affected in the following ways:
- The x – intercept moves to the left or right a fixed distance equal to h.
- The vertical asymptote moves an equal distance of h.
- The domain of the function also changes.
Example 3
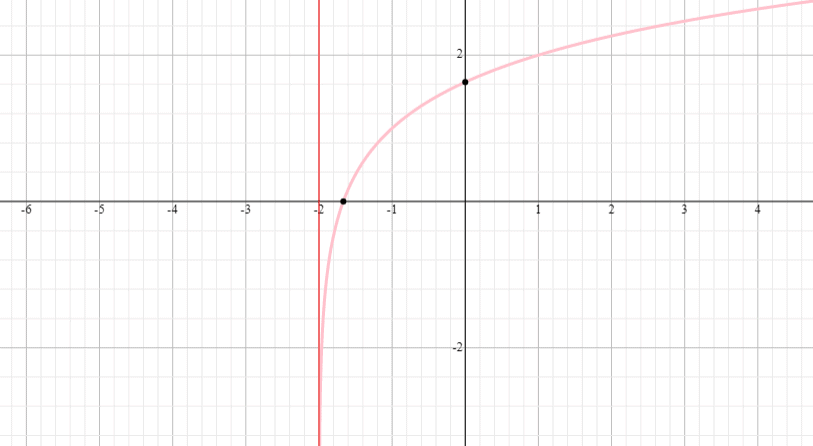
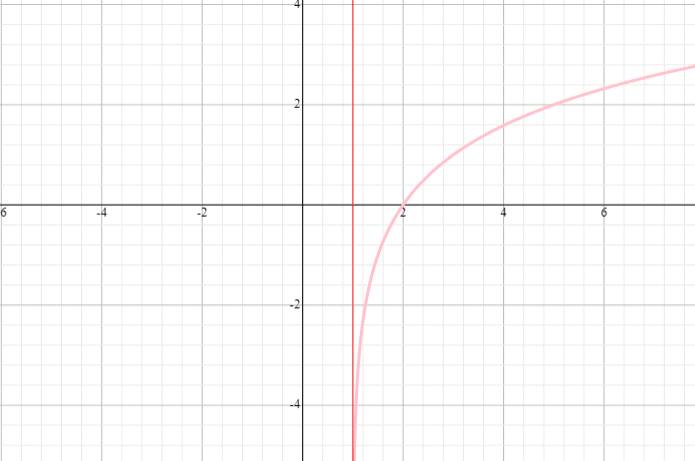
Draw a graph of the function f(x) = log 2 (x + 1) and state the domain and range of the function.
Solution
⟹ Domain: (− 1, infinity)
⟹ Range: (−infinity, infinity)
Example 4
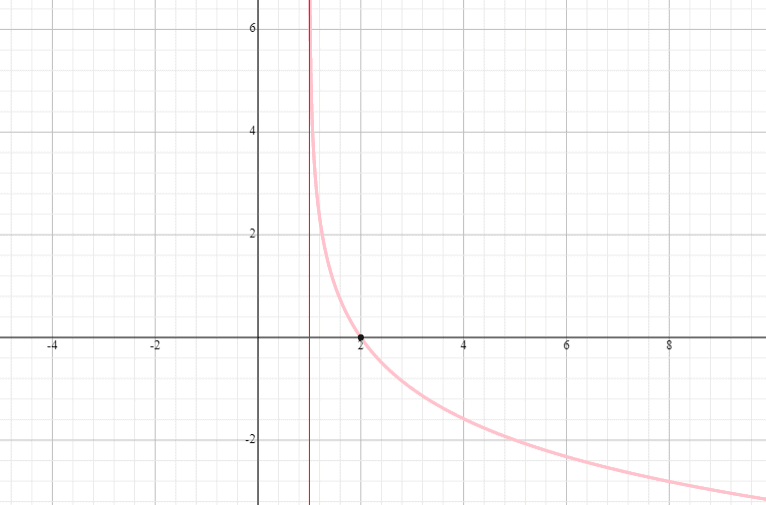
Graph y = log 0.5 (x – 1) and the state the domain and range.
Solution
⟹ Domain: (1, infinity)
⟹ Range: (−infinity, infinity)
How to graph a function with a vertical?
A logarithmic function with both horizontal and vertical shift is of the form f(x) = log b (x) + k, where k = the vertical shift.
The vertical shift affects the features of a function as follows:
- The x-intercept will move either up or down with a fixed distance of k
Example 5
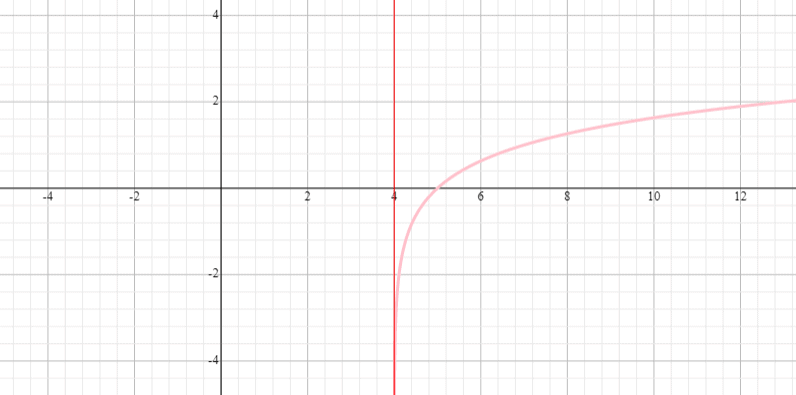
Graph the function y = log 3 (x – 4) and state the function’s range and domain.
Solution
⟹ Domain: (0, infinity)
⟹ Range: (−infinity, infinity)
Functions with both horizontal and vertical shift
A logarithmic function with both horizontal and vertical shift is of the form (x) = log b (x + h) + k, where k and h are the vertical and horizontal shifts, respectively.
Example 6
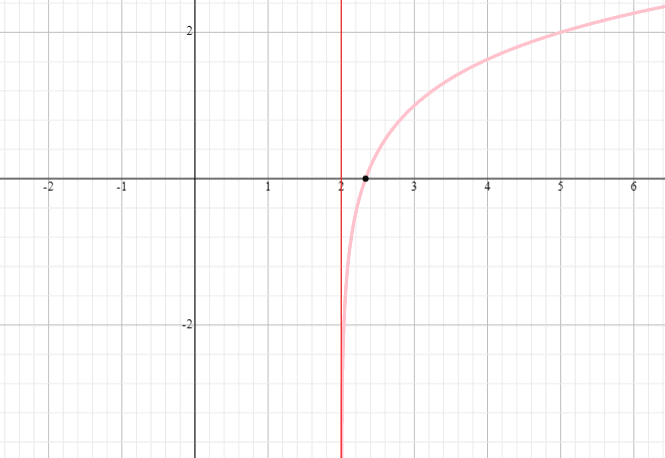
Graph the logarithmic function y = log 3 (x – 2) + 1 and find the function’s domain and range.
Solution
⟹ Domain: (2,infinity)
⟹ Range: (−infinity, infinity)
Example 7
Graph the logarithmic function y = log 3 (x + 2) + 1 and find the domain and range of the function.
Solution
⟹ Domain: (- 2,infinity)
⟹ Range: (−infinity, infinity)