 This question explains the concept of antiderivative and how to draw its graph from the function graph.
The antiderivative of a function is the indefinite integral of the function. If we take its derivative, it will give out the original function. The derivative and antiderivative or indefinite integral are inverse of each other. The derivative of any function is a unique value while the antiderivative or integral is not unique.
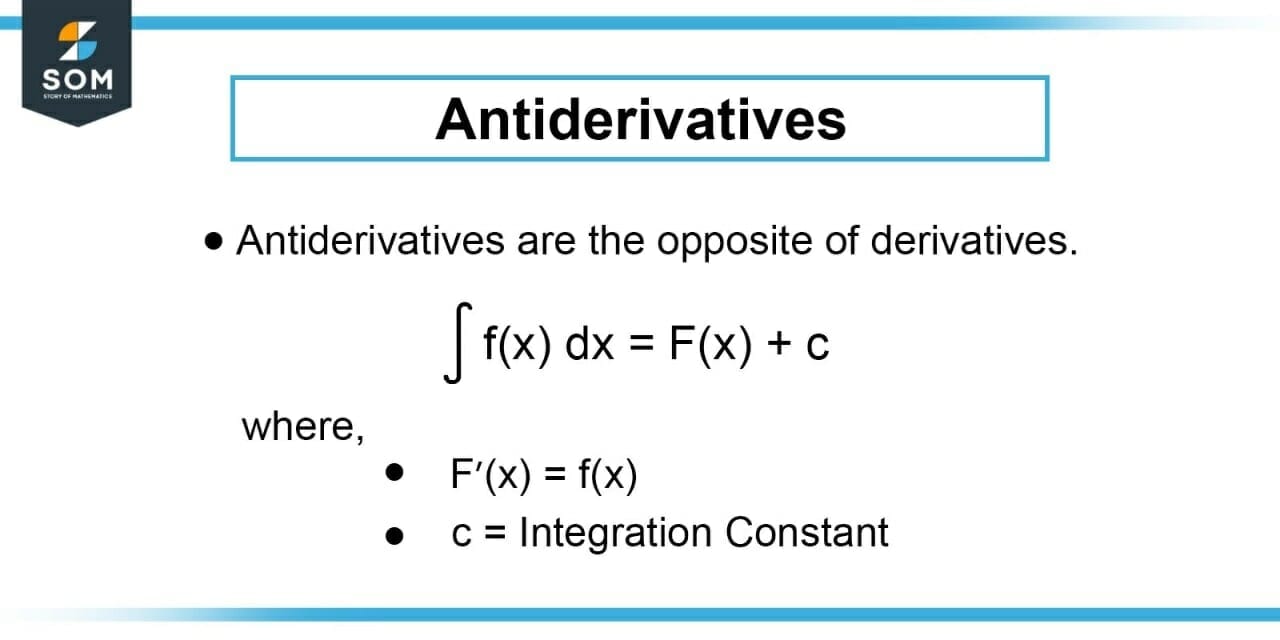
Figure-1 : Antiderivatives
Antiderivative $F$ of a function $f$ is the inverse derivative of the given function $f$. It is also called a primitive function whose derivative is equal to the original function $f$. The antiderivative can be calculated using the fundamental theorem of calculus with an initial given value of $F$.
The graph of function $f$ is shown and we need to determine its antiderivative function graph shown in Figure 2.
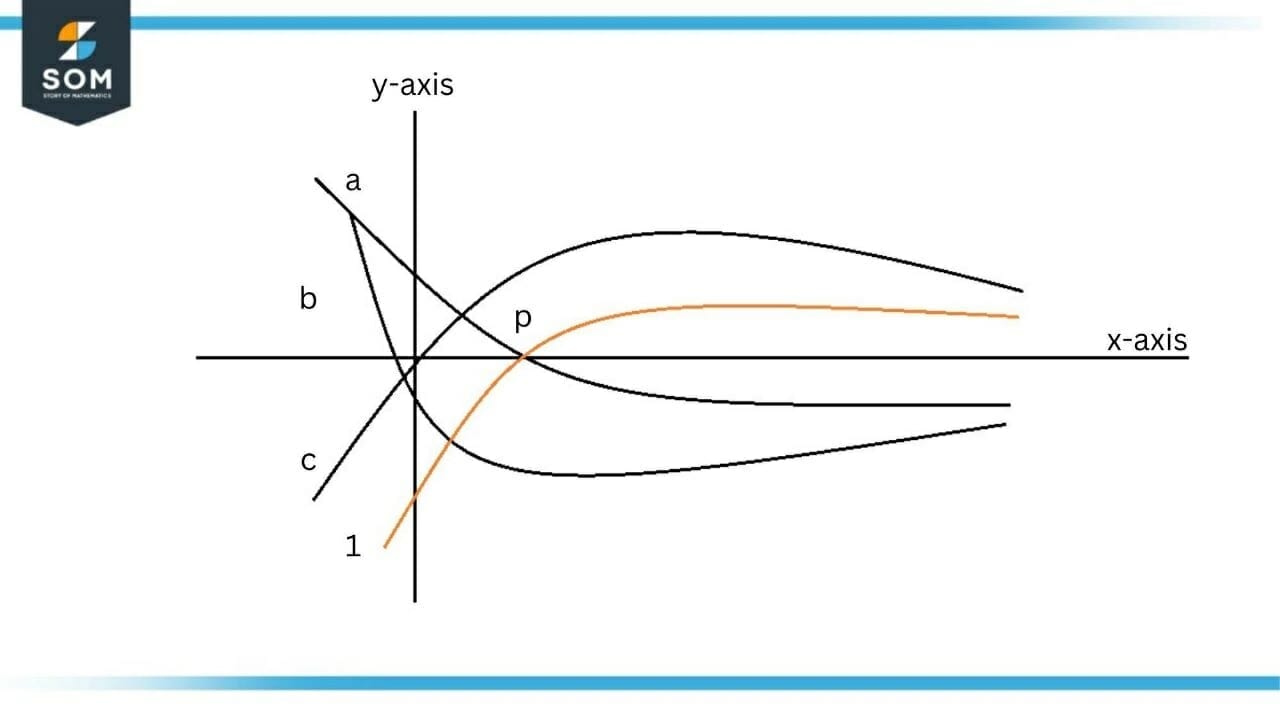
Figure-2 : Graph of Function f
Some determined rules of calculus need to be understood for this concept:
Step 1: When the graph of a function is below $x-axis$, the antiderivative graph will decrease.
Step 2: When the graph of a function is above $x-axis$, the graph of antiderivative will be increasing.
Step 3: When the graph intercepts $x$, the antiderivative has a flat graph.
Step 4: When the graph of function changes direction while remaining on the same upper or lower axis, the graph of antiderivative changes concavity.
Following the steps above, our function starts below $x-axis$ so its antiderivative will be decreasing. Looking at the graphs in Figure 1, only $(a)$ and $(b)$ are decreasing while $(c)$ is increasing. This will eliminate the option $(c)$ from the potential solution.
At point $p$, the function $f$ is crossing $x-axis$, so the antiderivative will have a flat region at this point. It is evident from the Figure 1 that is $(a)$ is decreasing at point $p$, so we can eliminate $(a)$ also. We can observe that $(b)$ has a flat region at point $p$. This proves that $(b)$ is our solution and that it is the graph of the antiderivative of function $f$.
We are given a function’s graph shown in $Figure 1$ and we need to determine the graph of its antiderivative function.
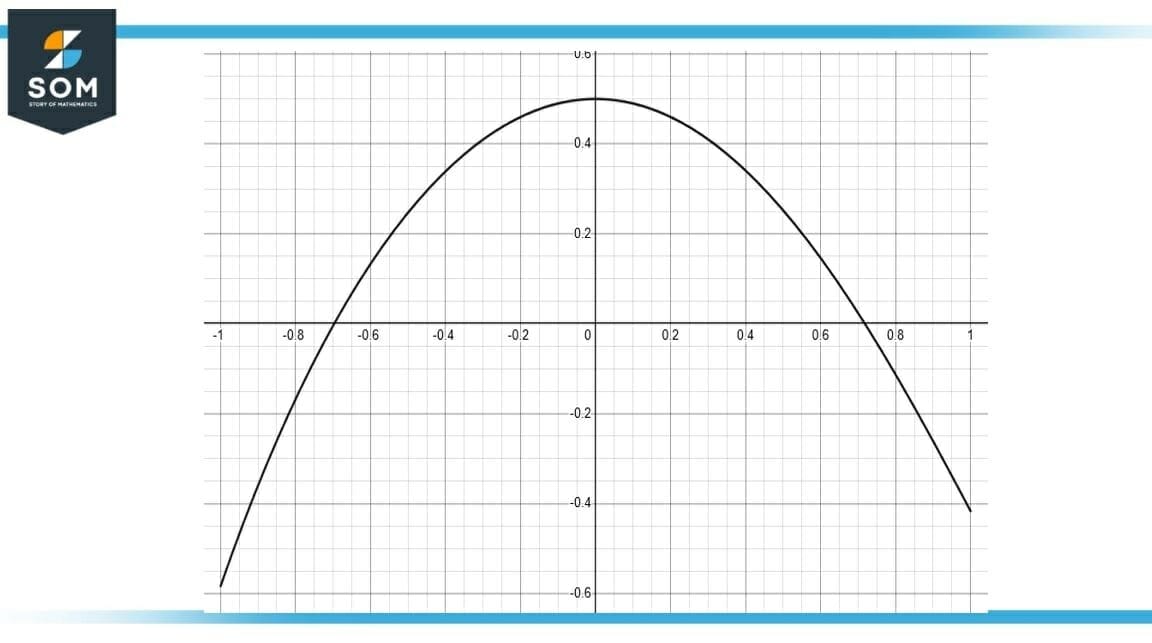
Figure-3 : Slope of f
As $f$ in Figure 1 represents the slope of $F$, then values below $x-axis$ in Figure 1 represent negative slope, values above $x-axis$ represent positive slope, and $x$ intercepts indicate flat regions.
Starting from $(-\infty, -0.7)$, function $f$ is increasing but below $x-axis$, which results in function $F$ to decrease. At $x$ intercept, there is a flat region for zero slope. After that, $F$ must have increasing slope as $f$ is now above $x-axis$.
The function $F$ will be increasing for all the values of $f$ that are above $x-axis$. The concavity will change after $f$ function starts decreasing above $x-axis$. Second flat region should be present at $[0.7, 0]$ and after that, $F$ should start decreasing as $f$ is now below $x-axis$.
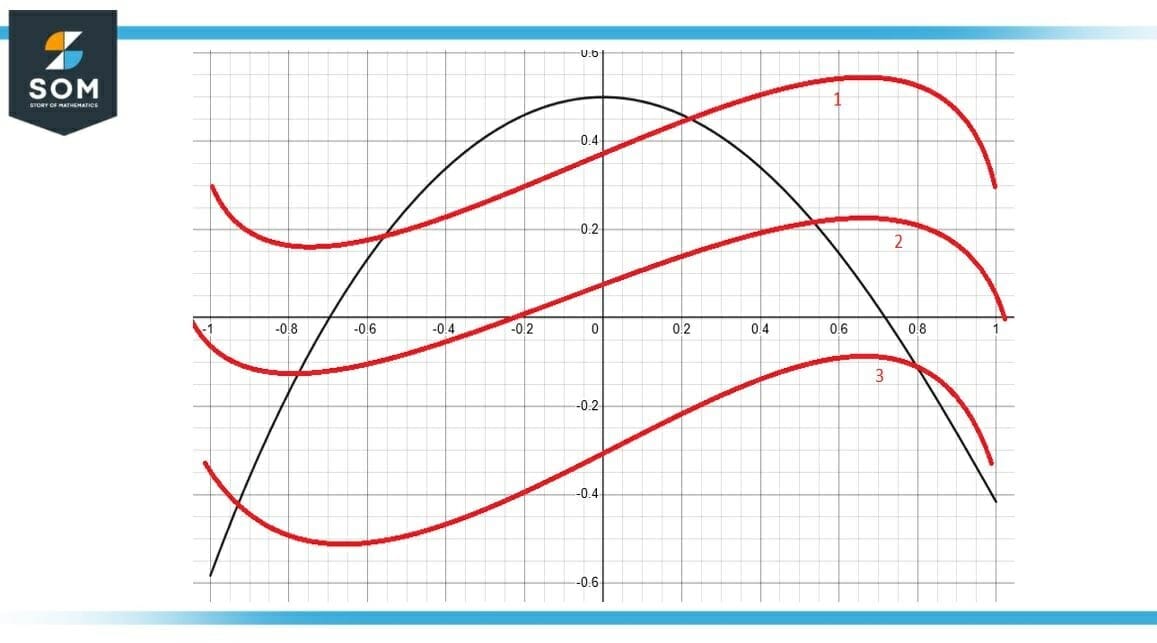
Figure-4 : Antiderivative of Function f