
This question aims to find the frequency distribution of the qualitative data by using knowledge of the frequency distribution.
Frequency distribution is a representation of several observations in a tabular form. It displays information within the given intervals. A frequency distribution shows the number of repeated items in a tabular or descriptive form. It can be represented as tally marks or simple digits.
Qualitative analysis is the numerical analysis and interpretation of observations for analyzing the underlying meanings of relationship patterns.
Expert Answer
When an event occurs more than one time, the number at which it occurs, again and again, is called frequency. The list of frequencies for all events in data is known as frequency distribution.
Qualitative data:
Qualitative data describes the quality and category in which the data falls. It classifies data based on its use.
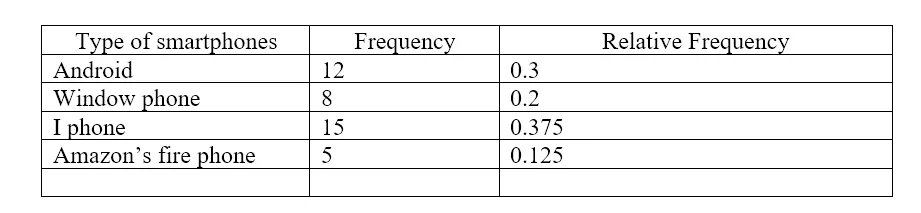
Table 1
This table shows the types of different smartphones and how these smartphones are being used frequently nowadays. The use of smartphones is described by the frequency distribution in the given table.
We can infer from the given data that iPhones are the most used smartphones. Android is a competitor of iPhones as its frequency is $ 12 $. Next, we have the Windows phone whose frequency is $ 8 $. Amazon’s Fire Phone has a frequency of $ 5 $. The relative frequencies of this are calculated by:
\[ R.f = \frac { f } { n } \]
Here, $ f $ is the frequency of usage of each smartphone and $ n $ is the total frequency.
Here, $ n $ is $ 40 $ and relative frequencies can be calculated accordingly.
Numerical Solution
The relative frequency for an android is:
\[ R.f = \frac { 12 } { 40 } \]
\[ R.f = 0 . 3 \]
The relative frequency for the Window phone:
\[ R.f = \frac { 8 } { 40 } \]
\[ R.f = 0 . 2 \]
The relative frequency for an iPhone is:
\[ R.f = \frac { 15 } { 40 } \]
\[ R.f = 0 . 375 \]
The relative frequency of an Amazon’s fire phone is:
\[ R.f = \frac { 5 } { 40 } \]
\[ R.f = 0 . 125 \]
These relative frequencies are tabulated in the table above.
Example
Alia has a packet of $ 20 $ bubblegums. Her favorite bubblegums have $ 6 $ red and $ 6 $ yellow color. How frequently does she eat all the candies? Find the relative frequency of her favorite candies.
\[ R.f = \frac {6 + 6 } { 20 } \]
\[ R.f = \frac { 12 } { 20 } \]
\[ R.f = 0 . 6 \]
\[ R.f = 60 \% \]
Image/Mathematical drawings are created in Geogebra.