JUMP TO TOPIC

To find a function from its graph, I always start by examining the visual representation carefully. A graph depicts the relationship between variables, often showing how one variable responds to changes in another.
I look for patterns such as lines, curves, and distinct points that indicate where the function takes certain values. Understanding the function underlying a graph requires a methodical approach by inspecting the shape, the slope, and any recurring motifs.
I ensure that the graph passes the vertical line test, which means that each input has only one output, confirming it represents a function.
This involves imagining drawing vertical lines through the graph to check if they intersect the curve at more than one point. If they do, it’s not a function.
From there, I can analyze different attributes such as intercepts, intervals of increase or decrease, and asymptotic behavior which are all clues to the underlying function. To keep this engagement and exploration alive, I never shy away from using digital tools.
For instance, with graphing calculators and interactive platforms like Desmos, I can play with graphs dynamically, altering parameters to see how the function changes. This hands-on manipulation not only aids in understanding but also makes the learning process quite enjoyable.
Extrapolating Information from the Graph
When I look at a graph, I can determine the function f by observing how the output value changes as the input value varies.
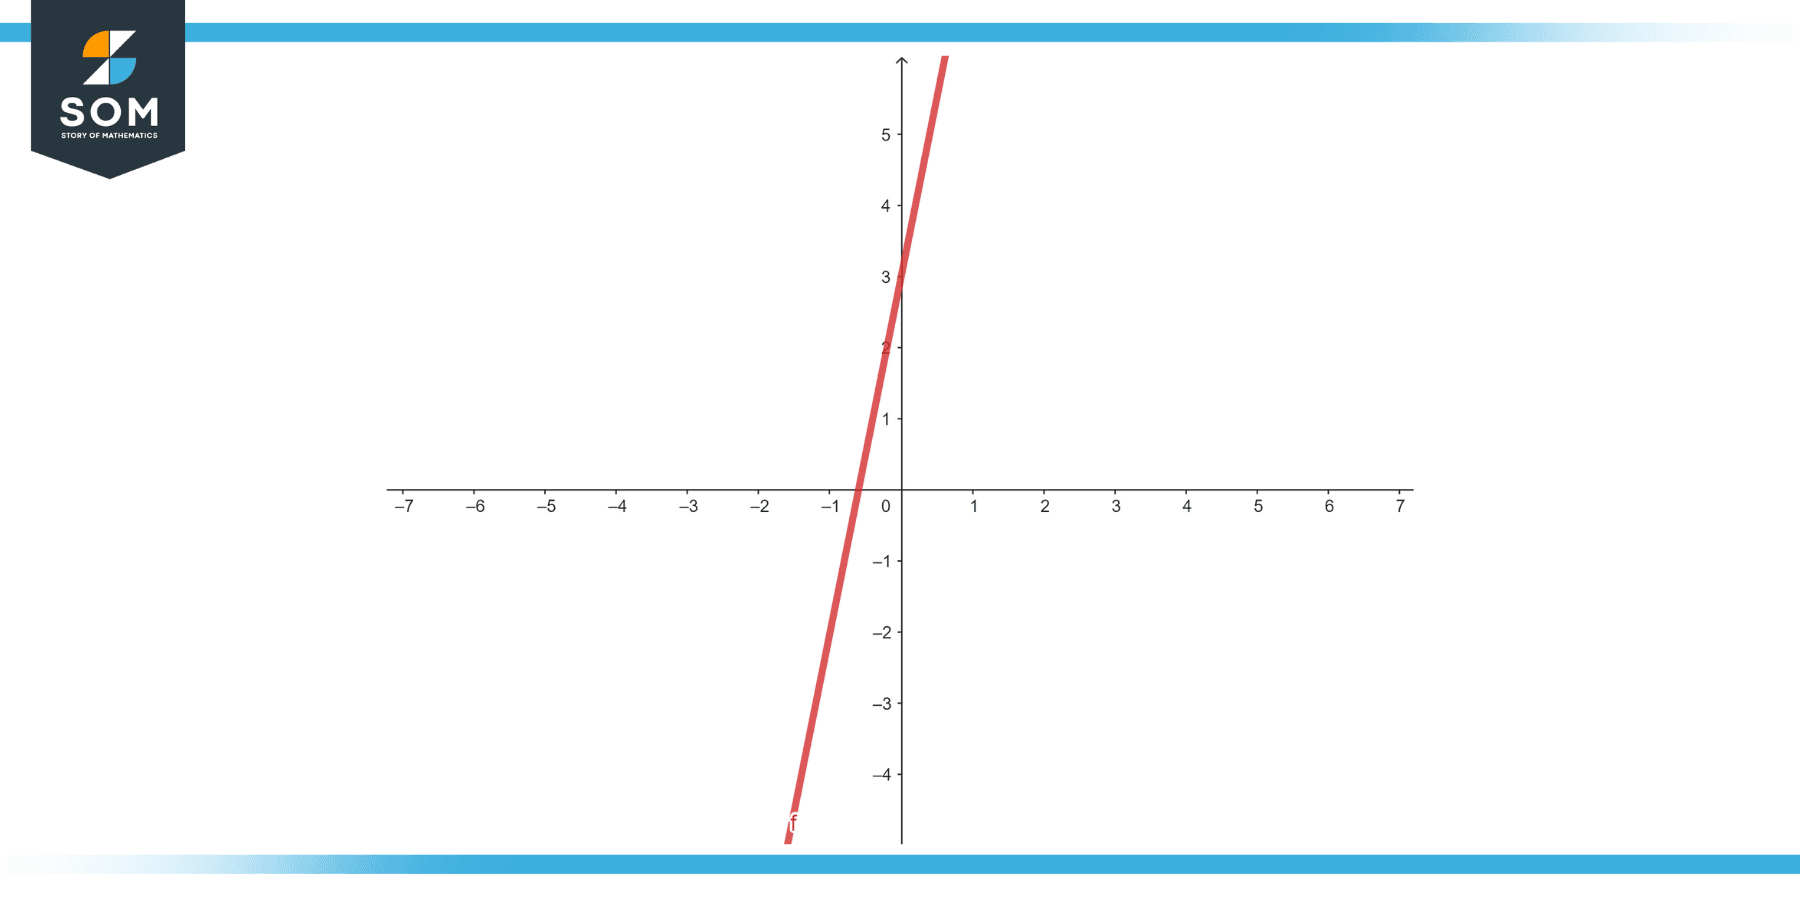
Graphical representation of the function y equals 5x plus 3
Identify several clear points of intersection where the function crosses grid lines, ensuring accuracy in their coordinates.
Plot these points in a table with the x-axis values as inputs and the corresponding y-axis values as the outputs.
x (Input) f(x) (Output) Two Value at two Three Value at three Four Value at four Analyze the pattern these points follow. If the function is linear, the output changes consistently as the input increases.
To ensure the graph represents a valid function for each value along the x-axis, I perform the vertical line test. If any vertical line intersects the graph at more than one point, it’s not a function. Successful functions will intersect only once.
To predict values not shown on the graph (extrapolation), I use the relationship between the inputs and outputs to create a mathematical model. For example, the formula for a linear model is:
$$ f(x) = mx + b $$
Here, “m” is the slope of the line, and “b” is the y-intercept. By finding these two parameters from my table, I can predict output values for new input values. Extrapolation is most reliable when the new inputs aren’t too far from the data I originally used to construct the function.
Deriving the Function Equation from a Graph
When I look at a graph of a function, my goal is to determine the equation that represents the relationship between the x-axis (the input) and the y-axis (the output).
First, I check if the graph represents a linear function. If it’s a straight line, then I know the function has the general equation of $y = mx + b$, where $m$ is the slope and $b$ is the y-intercept.
To find the slope, $m$, I pick two points on the line, $(x_1, y_1)$ and $(x_2, y_2)$. The slope is calculated by the change in y over the change in x, which is $(y_2 – y_1) / (x_2 – x_1)$. The y-intercept, $b$, is where the line crosses the y-axis ($x=0$).
For curves, it’s a bit more complex. If I spot familiar shapes—parabolas, hyperbolas, exponential decay—I’ll match them with their standard equations, such as $y=ax^2+bx+c$ for parabolas. I adjust the coefficients $a$, $b$, and $c$ until the equation fits the curve.
If the function’s form isn’t immediately recognizable, I utilize the concept of the derivative to understand the rate of change at various points. For instance, I look at the slope of the tangent line at various points to estimate the derivative’s behavior, which helps me get closer to the underlying function’s formula.
Here’s a simple table to summarize common function types and their general equations:
| Function Type | General Equation |
|---|---|
| Linear | $y = mx + b$ |
| Quadratic | $y = ax^2 + bx + c$ |
| Cubic | $y = ax^3 + bx^2 + cx + d$ |
Remember, precise techniques like curve fitting may require more advanced tools and calculations.
Considerations for Advanced Functions
When examining advanced functions on a graph, I always start by looking for key features such as the domain, range, and zeroes.
The domain represents all possible input values (usually, ( x ) values), while the range is the set of possible outputs (the ( y ) values). To find the zeroes of the function, which are the points where the function’s graph intersects the ( x )-axis, I look for where the graph hits zero on the ( y )-axis.
I create a list of considerations to check off:
Domain and Range:
- Domain: Identify the leftmost and rightmost points on the graph. If the graph continues without bound, it may have an infinite domain, such as $ (-\infty, \infty) $.
- Range: Determine the lowest and highest points on the graph for the output values. Similar to the domain, the range can be infinite or finite.
Zeroes of the Function:
- Locate the points where the function crosses the ( x )-axis. These are the solutions to ( f(x) = 0 ).
Continuity:
- Note any discontinuities or breaks in the graph, which indicate where the function is not defined.
Here’s a quick reference table that I use to make sure I’ve covered the essentials:
| Feature | Description | Graphical Representation |
|---|---|---|
| Domain | Set of all possible ( x ) values | Horizontal extent of the graph |
| Range | Set of all possible ( y ) values | Vertical extent of the graph |
| Zeroes | Inputs where ( f(x) = 0 ) | Points where the graph intersects the ( x )-axis |
By understanding these critical components, I’m better equipped to describe and analyze advanced functions graphically. It’s a systematic approach that ensures I cover all the necessary bases in my analysis.
Conclusion
Identifying functions from graphs is a key skill in mathematics. Through this process, I have outlined the importance of the vertical line test.
If a vertical line intersects a graph at more than one point, the graph does not represent a function. The functionality of a graph is determined by ensuring that each input, or domain value, corresponds to only one output, or range value.
In our journey, the usage of the vertical line test was emphasized. Implementing this test by visually inspecting a graph ensures that no vertical line intersects the graph at more than one point.
If this condition is satisfied, the graph represents a function, expressed mathematically as ( y = f(x) ).
It’s also worth remembering that the determination of the domain and range from a graph gives us insight into the behavior of the function across different values of ( x ) and ( y ).
Lastly, finding the zeros of a function, the points where the graph crosses the ( x )-axis, helps us understand the function’s roots and is fundamental to my analysis of its characteristics.
Recognizing and interpreting graphs of functions is not just academic; it’s a practical skill with countless applications in science, engineering, economics, and beyond.
I hope that this information proves to be a reliable guide as you continue exploring the realm of functions with confidence and curiosity.