JUMP TO TOPIC
To graph a piecewise function, I always start by understanding that it’s essentially a combination of different functions, each applying to specific intervals on the x-axis.
A piecewise function can be written in the form $f(x) = \begin{cases} f_1(x) & \text{for } x \text{ in domain } D_1, \ f_2(x) & \text{for } x \text{ in domain } D_2, \ \vdots & \ f_n(x) & \text{for } x \text{ in domain } D_n, \end{cases}$ where $f_1(x), f_2(x), \ldots, f_n(x)$ are the different functions defined on domains $D_1, D_2, \ldots, D_n$.
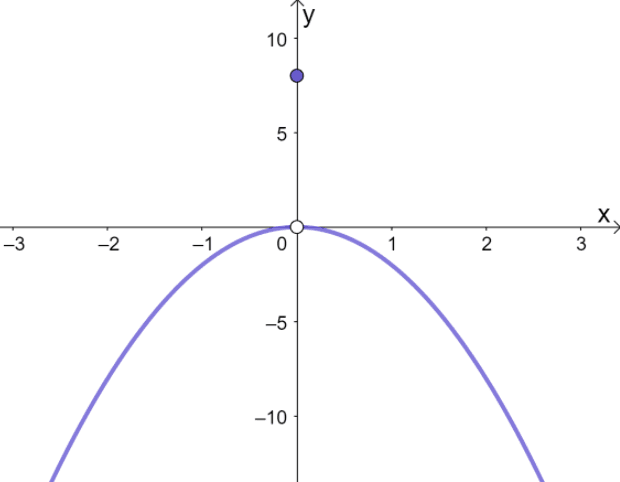
As I plot, I pay close attention to whether the function includes the endpoint of each interval, which is indicated by an open or closed circle on my graph.
This lets me accurately represent the function in its domain. For each sub-function, I follow its rule over its particular interval, connecting the pieces to form the full piecewise function.
Stay tuned as we dive into the specific steps to create these insightful visuals, and I’ll show you why mastering piecewise functions is a key skill in understanding the beauty of mathematics!
Graphing Piecewise Functions Step by Step
Graphing piecewise functions can seem challenging, but breaking it into steps can simplify the process. I’ll show you how to create a graph that combines different functions on specified intervals.
Sketching the Intervals
For each interval in the function definition, I outline the range of x-values where that particular rule applies. This leads to a clear sketch showing where each rule of the function is active.
For example, a function might be defined differently from $-\infty$ to 1 and from 1 to $\infty$. I denote these intervals on the coordinate plane by drawing a light line or curve within their boundaries.
Keep in mind the endpoints; if they are included in the interval, I use a closed circle, and if not, an open circle is used.
Plotting Points and Lines
Next, I plot key points on the graph where the function changes or has notable values. For linear pieces, I need at least two points to define a line, and I ensure the slope and y-intercept match the criteria given in the function notation.
After plotting the points, I draw the lines or curves, ensuring that for each interval, the line or curve starts and ends at the correct coordinates. I use open circles for excluded endpoints and closed circles for included endpoints.
For functions like the absolute value function, which changes at specific points, it’s essential to represent these changes accurately on the graph. Similarly, with step functions, notable jumps occur at certain x-values, and I mark these on the graph as well.
Verifying with the Vertical Line Test
After plotting the piecewise function, I conduct the vertical line test by imagining a vertical line moving across the graph.
This test confirms that my graph represents a function by checking if any vertical line intersects the graph at more than one point. If a line does intersect the graph multiple times, then I need to revisit my plotting points and lines to correct the errors.
This test ensures that at every x-value, there is only one corresponding output, which is essential for the correct representation of a function.
To maintain the accuracy of a piecewise function, it’s important that the union of all the intervals matches the complete domain of the function, and that each section is connected or separated, based on whether the function is continuous or not at those boundaries.
Conclusion
In mastering the art of graphing piecewise functions, I’ve shared strategies to depict their diverse behaviors accurately.
Remember the essence of a piecewise function: defined by different equations over different intervals. For clarity and correctness, I always ensure my graphs have clear boundaries and distinct equations for each segment.
When plotting the function $g(x) = \begin{cases} 3x – 2 & \text{if } x < 2 \ 5x + 1 & \text{if } x \geq 2 \end{cases} $, I start by graphing each piece separately and noting the relevant domain constraints.
My goal is to visually communicate where each part of the function applies. This requires attention to detail, especially around the points where the function pieces meet.
By adjusting the viewing window and using effective labeling, I provide a graph that not only is an accurate reflection of the function’s behavior but also offers insights into its qualitative features such as continuity and piece transitions.
In sharing my process, I hope to demystify graphing piecewise functions and empower others to tackle these intriguing mathematical constructs with confidence and ease.
Whether you’re working with linear or nonlinear segments, the key is in understanding and applying each piece of the function properly—a rewarding experience for anyone delving into the world of mathematics.