JUMP TO TOPIC
Embarking on the journey of graphing in 3 dimensions (3D) is like discovering a new visual language that elevates mathematical understanding to a whole new level. This profound tool not only reveals the fascinating relationship among three variables but also provides a gateway to explore the depth and complexities of the physical world around us.
Whether it’s mapping the nuances of a topographical terrain, simulating the complex interactions of variables in scientific experiments, or creating stunning computer graphics and animations, 3D graphing forms the cornerstone of these endeavors.
In this article, we’ll demystify the concept of graphing in 3 dimensions, providing you with essential insights, practical applications, to understand 3D graphs.
Defining Graphing in 3 Dimensions
Graphing in three dimensions, often referred to as 3D graphing, is a way of representing mathematical functions or sets of data that depend on three variables. Instead of plotting points on a two-dimensional plane (like the x and y-axes of a graph), 3D graphing involves plotting points in three-dimensional space along three axes: traditionally labeled as the x-axis, y-axis, and z-axis.
In a 3D graph, each point is determined by three coordinates: (x, y, z), where ‘x‘ represents the position along the x-axis, ‘y‘ represents the position along the y-axis, and ‘z‘ represents the position along the z-axis. These points collectively form a three-dimensional representation of the function or data set.
3D graphing is commonly used in disciplines such as physics, engineering, computer science, and economics, among others, where it allows for a more complete visualization of functions or data that depend on multiple variables.
Below is a generic representation of 3D shape.
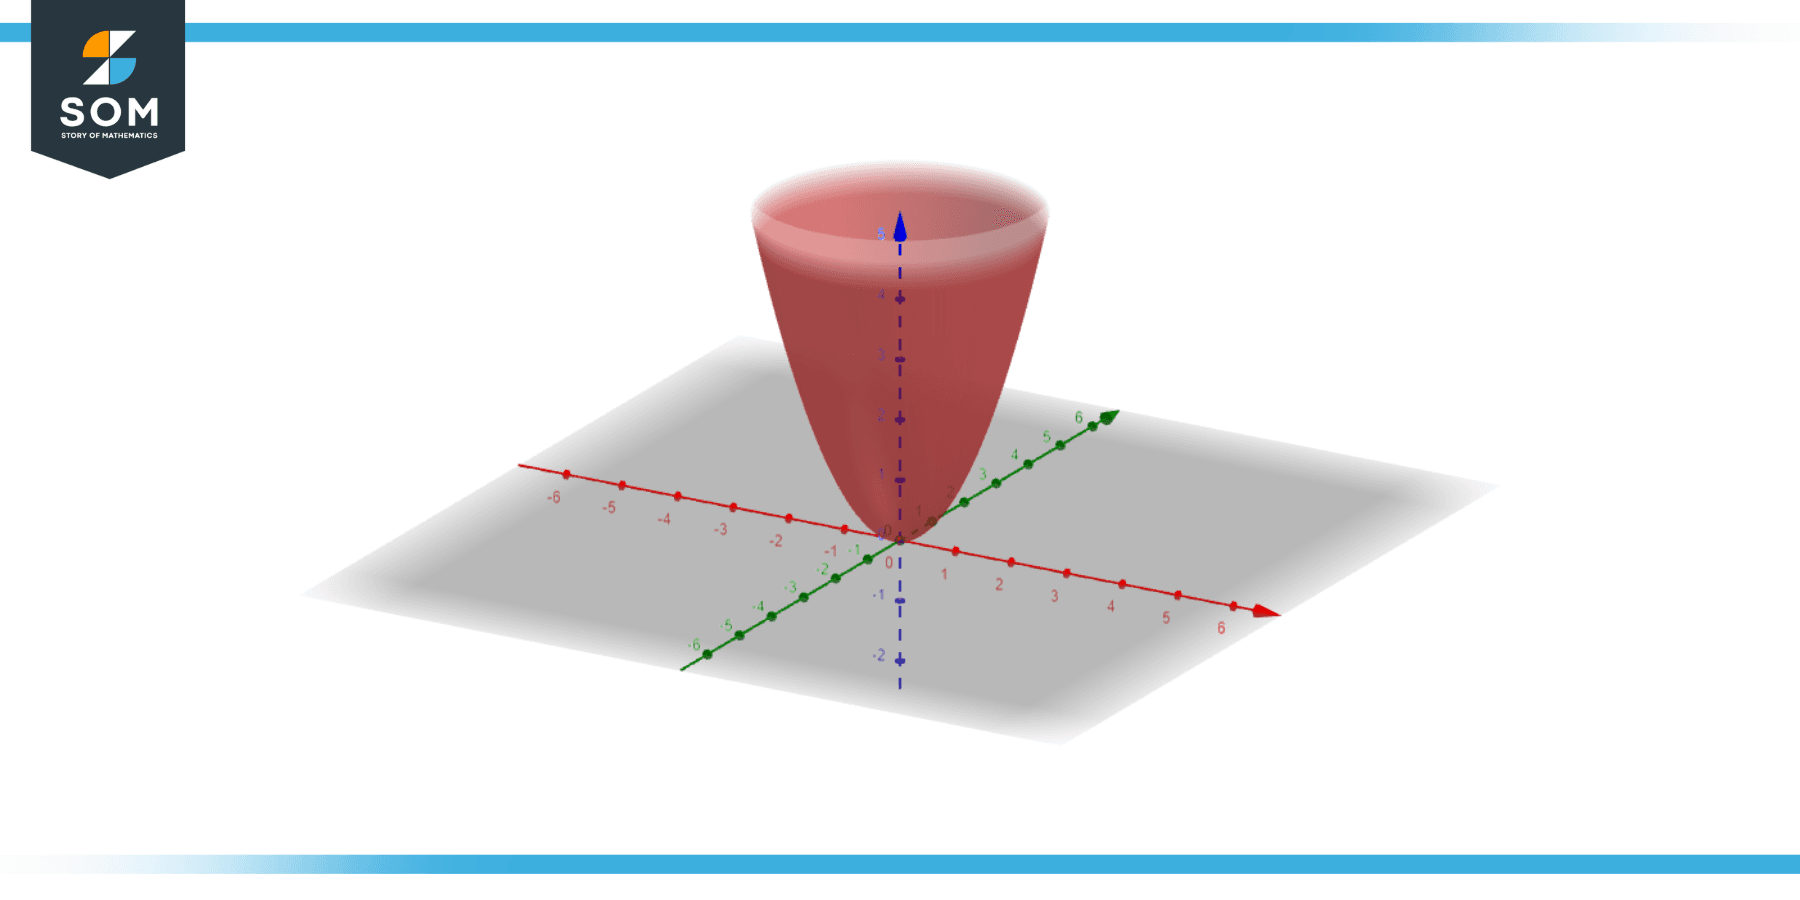
Figure-1.
Historical Significance of Graphing in 3 Dimensions
The history of graphing in 3 dimensions, or 3D graphing, is intertwined with the history of geometry, algebra, and mathematical analysis.
While the ancient Greeks made extensive use of geometry in two dimensions, the concept of a third dimension was not foreign to them. Euclid’s “Elements“, dating back to around 300 BCE, includes definitions and proofs about three-dimensional figures such as cones, pyramids, and spheres.
The development of Cartesian coordinates by René Descartes in the 17th century was a crucial advancement that allowed mathematicians to represent geometric problems algebraically and vice versa. Descartes introduced the concept of a coordinate system, and while his initial work was in two dimensions, the idea naturally extended to three dimensions.
In the 19th century, significant progress was made in the understanding and visualization of three-dimensional spaces. August Ferdinand Möbius, a German mathematician and astronomer, made significant contributions in this period, including the discovery of the Möbius strip, a two-dimensional surface with only one side when embedded in three-dimensional space.
During the same period, mathematicians such as Carl Friedrich Gauss and Bernhard Riemann developed differential geometry, which considers curves and surfaces in three dimensions and beyond. This work laid the groundwork for Albert Einstein’s general theory of relativity in the early 20th century.
The 20th century also saw the development of computer graphics, which greatly expanded the possibilities for visualizing functions and data in three dimensions. Today, 3D graphing is widely used in fields ranging from mathematics and physics to computer science, engineering, and economics, thanks to software that can easily plot complex surfaces and data in three dimensions.
It should be noted that the history of 3D graphing is a rich and complex field that touches many areas of mathematics and science, and this summary only touches upon some key developments.
Properties
Graphing in 3 dimensions (3D graphing) brings several key properties and considerations that distinguish it from graphing in two dimensions (2D). Here are some key properties and aspects to consider:
Three Axes
Unlike 2D graphing, which involves the x and y axes, 3D graphing introduces a third axis, typically denoted as z. This third axis adds a new dimension of depth, allowing you to graph variables that depend on three inputs or to represent three dimensions of data.
Coordinate System
Points in a 3D graph are identified by three coordinates (x, y, z), compared to two in 2D graphing. These coordinates describe the position of the point in relation to the three axes.
Orientation and Perspective
Orientation matters a lot in 3D graphing. Different perspectives can make the same 3D graph look different, which can sometimes make 3D graphs more challenging to interpret than 2D graphs. Modern graphing software often allows users to rotate and zoom 3D graphs to view them from different angles.
Types of Graphs
In addition to 3D scatter plots that represent individual data points in space, 3D graphing can also involve surface plots, which represent a function of two variables, or contour plots, which represent three-variable data similar to a topographical map.
Visual Complexity
3D graphs can visually represent more complex relationships than 2D graphs, including interactions among three variables and complex surfaces in three dimensions. However, the added complexity also makes 3D graphs more challenging to create and interpret.
Data Visualization
In the field of data visualization, 3D graphing can be used to represent three-dimensional data, or two-dimensional data over time. However, because 3D graphs can be harder to interpret, data visualization experts often recommend using multiple 2D graphs or other techniques to represent complex data when possible.
Mathematical Complexity
The mathematics of 3D graphing is more complex than that of 2D graphing, involving multivariable calculus and linear algebra. These mathematical tools allow for the calculation and representation of lines, planes, curves, and surfaces in three dimensions.
Remember that while 3D graphing can provide powerful insights and visualizations, it also comes with challenges in terms of complexity and interpretation. Always consider carefully whether 3D graphing is the best tool for your specific task or whether other representations might be more effective.
Common 3D Shapes
Three-dimensional (3D) shapes, also known as solids, are figures or spaces that take up three dimensions: length, width, and height. Here are some mathematical examples of 3D shapes, along with their properties:
Sphere
A sphere is a perfectly symmetrical solid around its center. Each point on the surface of a sphere is an equal distance from its center. A sphere has no edges or vertices.
Cube
A cube is a three-dimensional solid that has six equal square faces. All the sides and angles are equal. A cube has 12 edges and 8 vertices.
Cylinder
A cylinder has two parallel, congruent bases that are circular in shape. The sides of a cylinder are curved, not flat. It has no vertices.
Cone
A cone has a circular base and a vertex. The sides of a cone are not flat, and they are curved.
Prism
A prism is a solid object with two identical ends and all flat faces. The two ends, also known as bases, could be in different shapes, including rectangular (rectangular prism), triangular (triangular prism), etc.
Pyramid
A pyramid is a 3D shape with a polygon as its base and triangular faces that meet at a common vertex. The base could be any polygon, such as a square (square pyramid) or a triangle (tetrahedron).
Tetrahedron
A tetrahedron is a pyramid with a triangular base, i.e., four equilateral triangles form it. It has 4 faces, 6 edges, and 4 vertices.
Torus
A torus is shaped like a doughnut. It is a circular ring, where the ring itself also has a circular cross-section.
Dodecahedron
A dodecahedron is a polyhedron with 12 flat faces. In a regular dodecahedron, these faces are all identical pentagons. It has 20 vertices and 30 edges.
Icosahedron
An icosahedron is a polyhedron with 20 faces. In a regular icosahedron, these faces are all identical equilateral triangles. It has 12 vertices and 30 edges.
Applications
Graphing in 3 dimensions (3D graphing) is widely utilized across many fields and disciplines, providing a crucial tool to visualize and understand complex multi-dimensional relationships. Here are some examples:
Physics and Engineering
In physics, 3D graphing is used to represent physical phenomena that depend on three variables. For example, electric or gravitational fields in space can be represented as vector fields in three dimensions. In engineering, it can represent the stresses within a structure or the distribution of temperature in a system.
Computer Graphics and Design
In computer graphics, 3D graphing forms the basis of modeling objects and environments. It helps create detailed models of structures, landscapes, or even entire virtual worlds. In graphic design, 3D graphing is used in the creation of logos, animations, and other graphic elements.
Geography and Geology
In geography and geology, 3D graphing is used to create topographical maps and models, allowing for a detailed representation of the Earth’s surface, including elevations.
Economics and Finance
In economics and finance, 3D graphing can represent data involving three variables. For example, it can be used to visualize how supply and demand change with price and quantity or to represent a portfolio’s return, risk, and liquidity.
Biology and Medicine
In biology and medicine, 3D graphing is used to model and visualize complex structures like proteins or DNA. In medical imaging, technologies like MRI and CT scans use 3D graphing to create detailed images of the human body.
Chemistry
In chemistry, 3D graphing is used to visualize molecular structures, which provides insights into chemical properties and reactions. For example, chemists use it to represent electron density clouds around atoms or to show the shapes of molecular orbitals.
Data Science and Machine Learning
In data science, 3D graphing can help visualize multi-dimensional datasets, aiding in tasks like clustering or outlier detection. In machine learning, 3D graphs can be used to visualize complex decision boundaries or loss landscapes.
Meteorology
In meteorology, 3D graphing is used to create models and visualizations of weather patterns, which depend on variables like temperature, pressure, and humidity across three dimensions of space.
Remember that while 3D graphing is a powerful tool, it’s also important to consider its limitations and challenges. For complex datasets or functions with more than three variables, other visualization techniques might be more appropriate.
Exercise
Example 1
The function z = √(x² + y²). This represents a cone, extending both upwards and downwards from the origin along the z-axis.
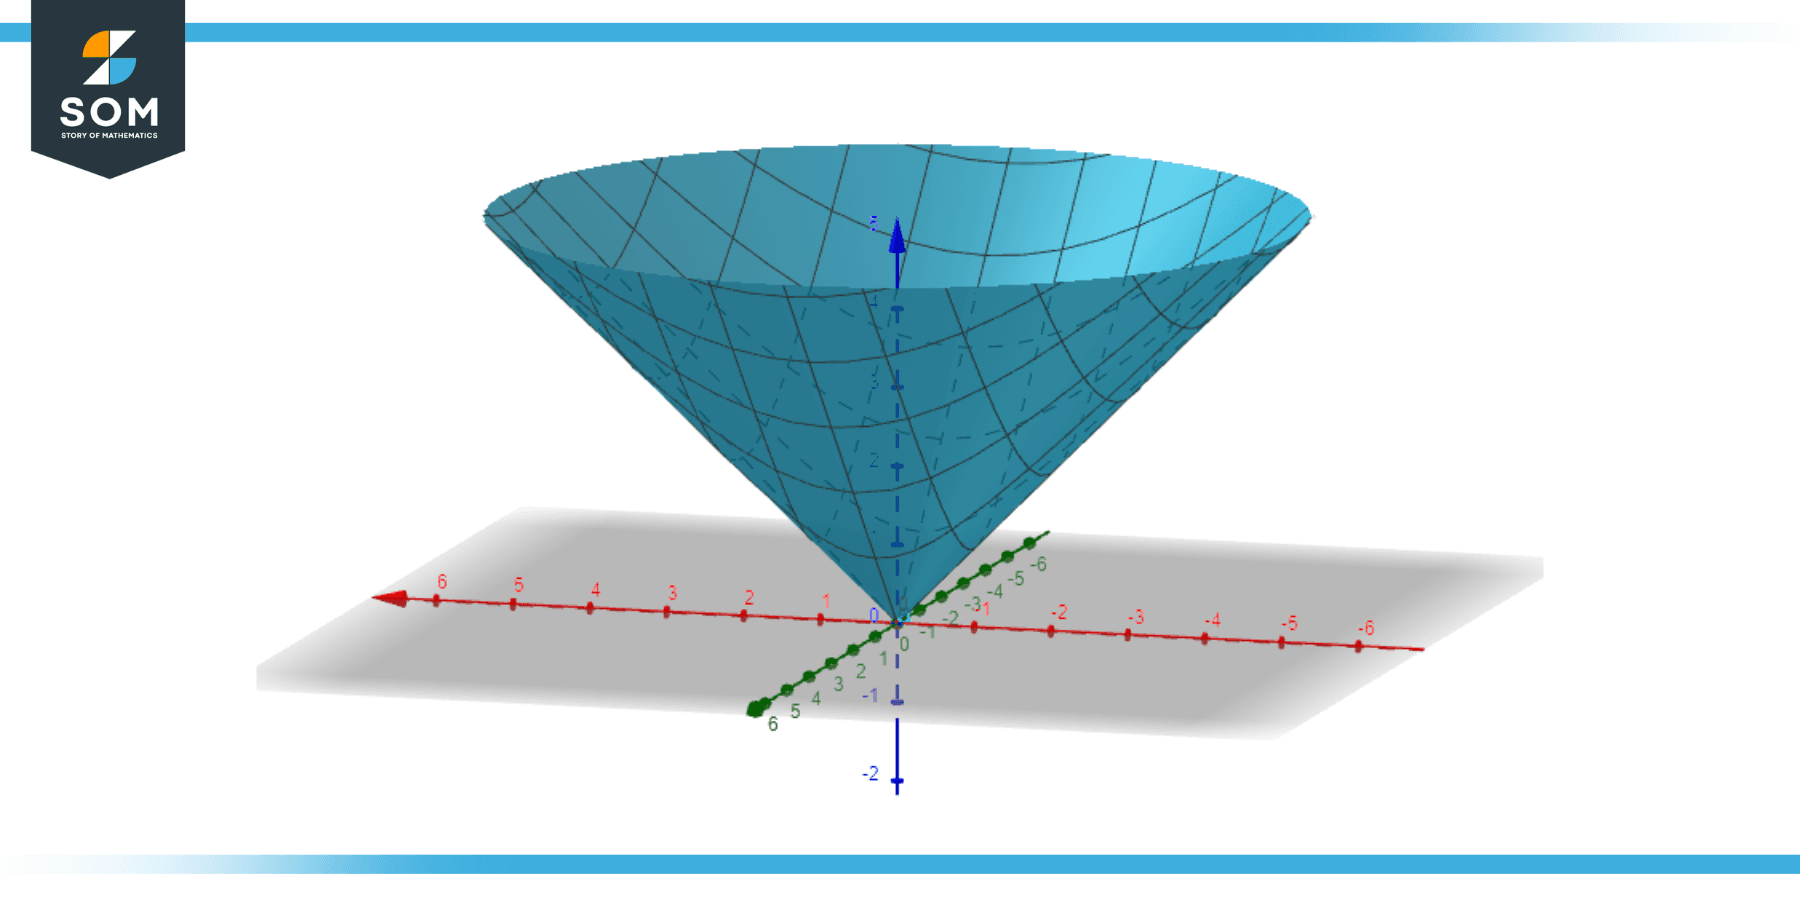
Figuer-2.
Example 2
The function z = sin(x) + cos(y). This is a wave-like surface where the height of the waves varies with both x and y.
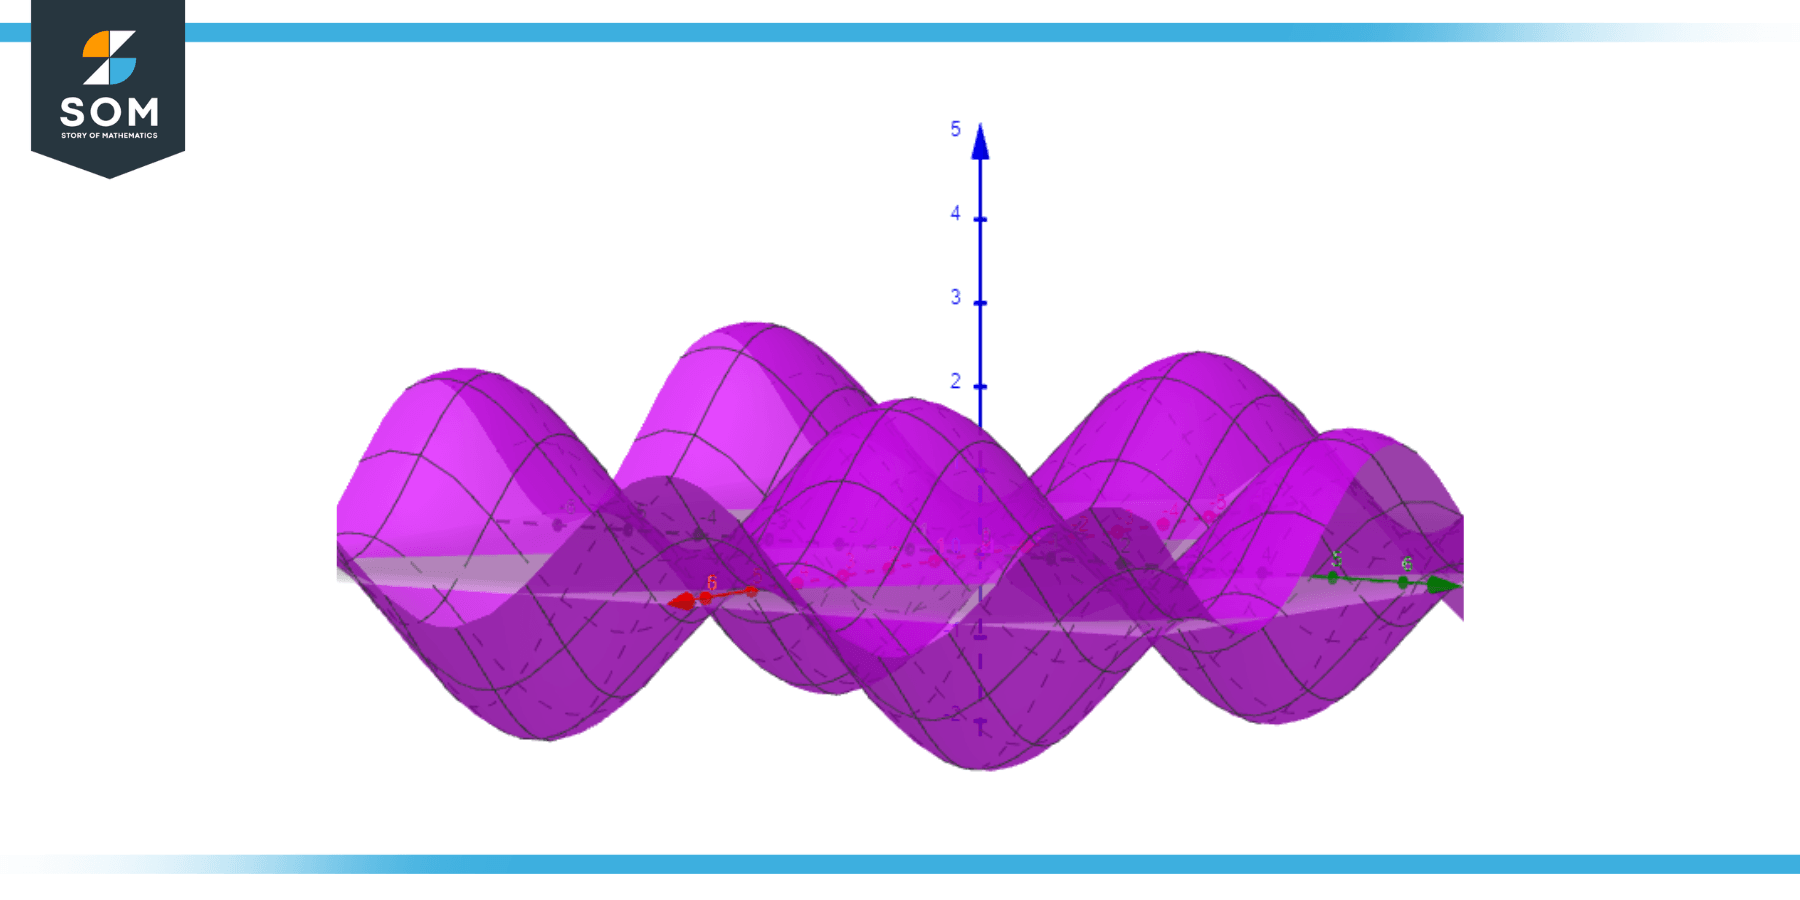
Figuer-3.
Example 3
The function z = $e^(-x² – y²)$. This represents a Gaussian or “bell curve” surface, centered at the origin and symmetric in all directions.
Figuer-4.
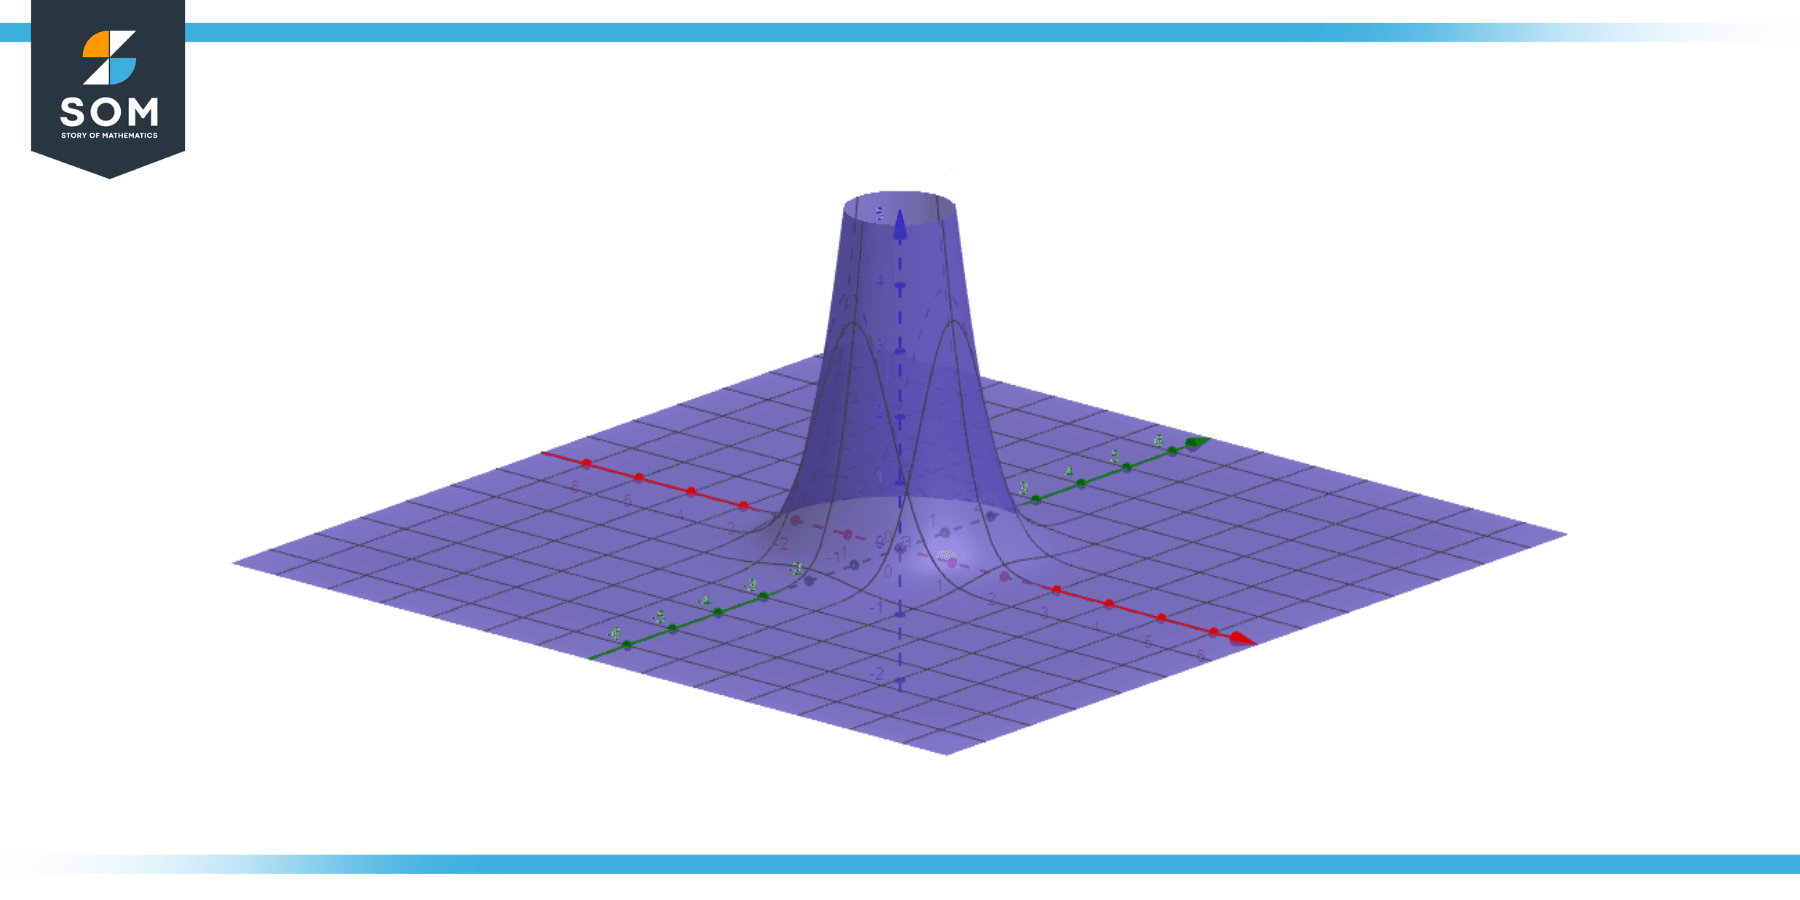
Example 4
The function z = |x| + |y|. This forms a pyramid-like shape centered at the origin.
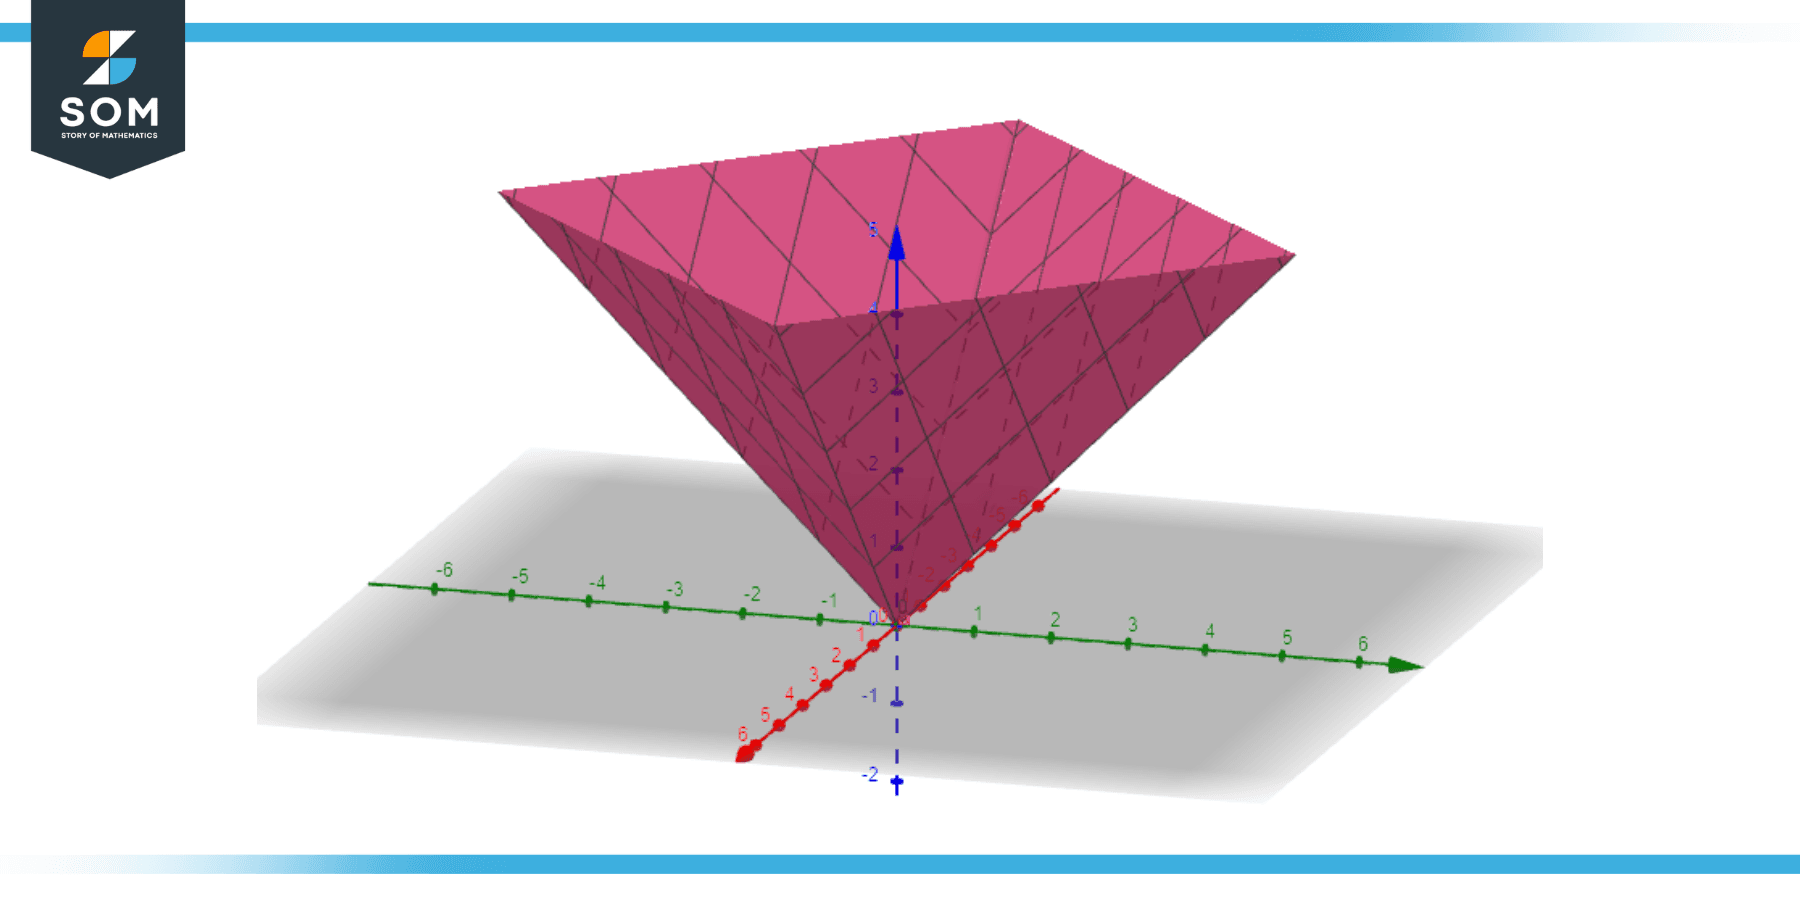
Figuer-5.
All images were created with GeoGebra.