To determine if a graph is a function, I first check whether every vertical line I can draw on the graph intersects it at no more than one point. This is known as the vertical line test.
It’s a simple method that visually confirms whether a set of points on a graph represents a function, which by definition pairs each input with exactly one output.
The process of identifying functions is foundational in math since functions are essential for understanding various relations and visual information conveyed through graphs.

For a graph to represent a function, each input value (represented on the x-axis) should correspond to no more than one output value (on the y-axis).
If I can draw any vertical line that touches the graph in more than one place, then the graph does not represent a function. The clarity of this graphical approach helps me understand and illustrate math concepts effectively, especially when I’m exploring complex relations.
Stick around, and I’ll show you just how this technique brings the abstract idea of functions into a clear and understandable light.
Determining Functions from Graphs
When I look at a graph, the main thing I’m checking for is whether or not it represents a function. A function is a special relationship where every input in the domain has exactly one output in the range.
To check if a graph is a function, I use the vertical line test. This method involves imagining drawing vertical lines through every part of the graph. If any vertical line intersects the graph at more than one point, then it’s not a function.
This is because multiple points on the same vertical line mean an input value is mapped to more than one output value.
In function notation, for a given function ( f ), the function value ( f(x) ) is the output for an input ( x ). If ( x ) is in the function’s domain, there will be a corresponding point on the graph with coordinates ( (x, f(x)) ), which are the ordered pairs made of the x-coordinate and y-coordinate.
Graphs of basic toolkit functions like linear functions $( y=mx+b )$, quadratic (( y=ax^2+bx+c )), cubic $( y=ax^3+bx^2+cx+d )$, reciprocal $( y=\frac{1}{x} )$, cube root $( y=\sqrt[3]{x} )$, circle $( x^2+y^2=r^2 )$, parabola $( y=ax^2 )$, and absolute value (( y=|x| )) will pass the vertical line test.
Here’s a simple table highlighting several function types and their general equations:
| Function Type | General Equation |
|---|---|
| Linear Function | $ y=mx+b $ |
| Quadratic Function | $y=ax^2+bx+c$ |
| Cubic Function | $y=ax^3+bx^2+cx+d $ |
| Absolute Function | $y=|x|$ |
| Square Root Function | $y=\sqrt{x}$ |
Memorizing the shapes and equations of these toolkit functions is extremely helpful. When I see a straight line on a coordinate plane, I immediately think of the slope-intercept form.
If it’s a curve that opens upwards or downwards like a U, that’s a sign of a quadratic. Identifying these patterns allows me to quickly assess whether a graph meets the criteria of a function.
Functional Characteristics and Testing
In my experience with functions, certain characteristics are essential in determining whether a graph represents a function.
When I look at a graph, I remember that for it to depict a function, each input value must have exactly one output value. This relation means if I select any value for x (the input), there can be only one corresponding y (the output).
I use the Vertical Line Test to quickly ascertain a function’s legitimacy on a graph. This test involves imagining or drawing vertical lines across the graph. If any vertical line intersects the graph in more than one point, then the graph does not represent a function.
| Test Name | Description |
|---|---|
| Vertical Line Test | If a vertical line intersects the graph at more than one point, the graph is not a function. |
| Horizontal Line Test | Used to check if a function is one-to-one by seeing if any horizontal line crosses the graph more than once. |
Additionally, I consider specific types of functions:
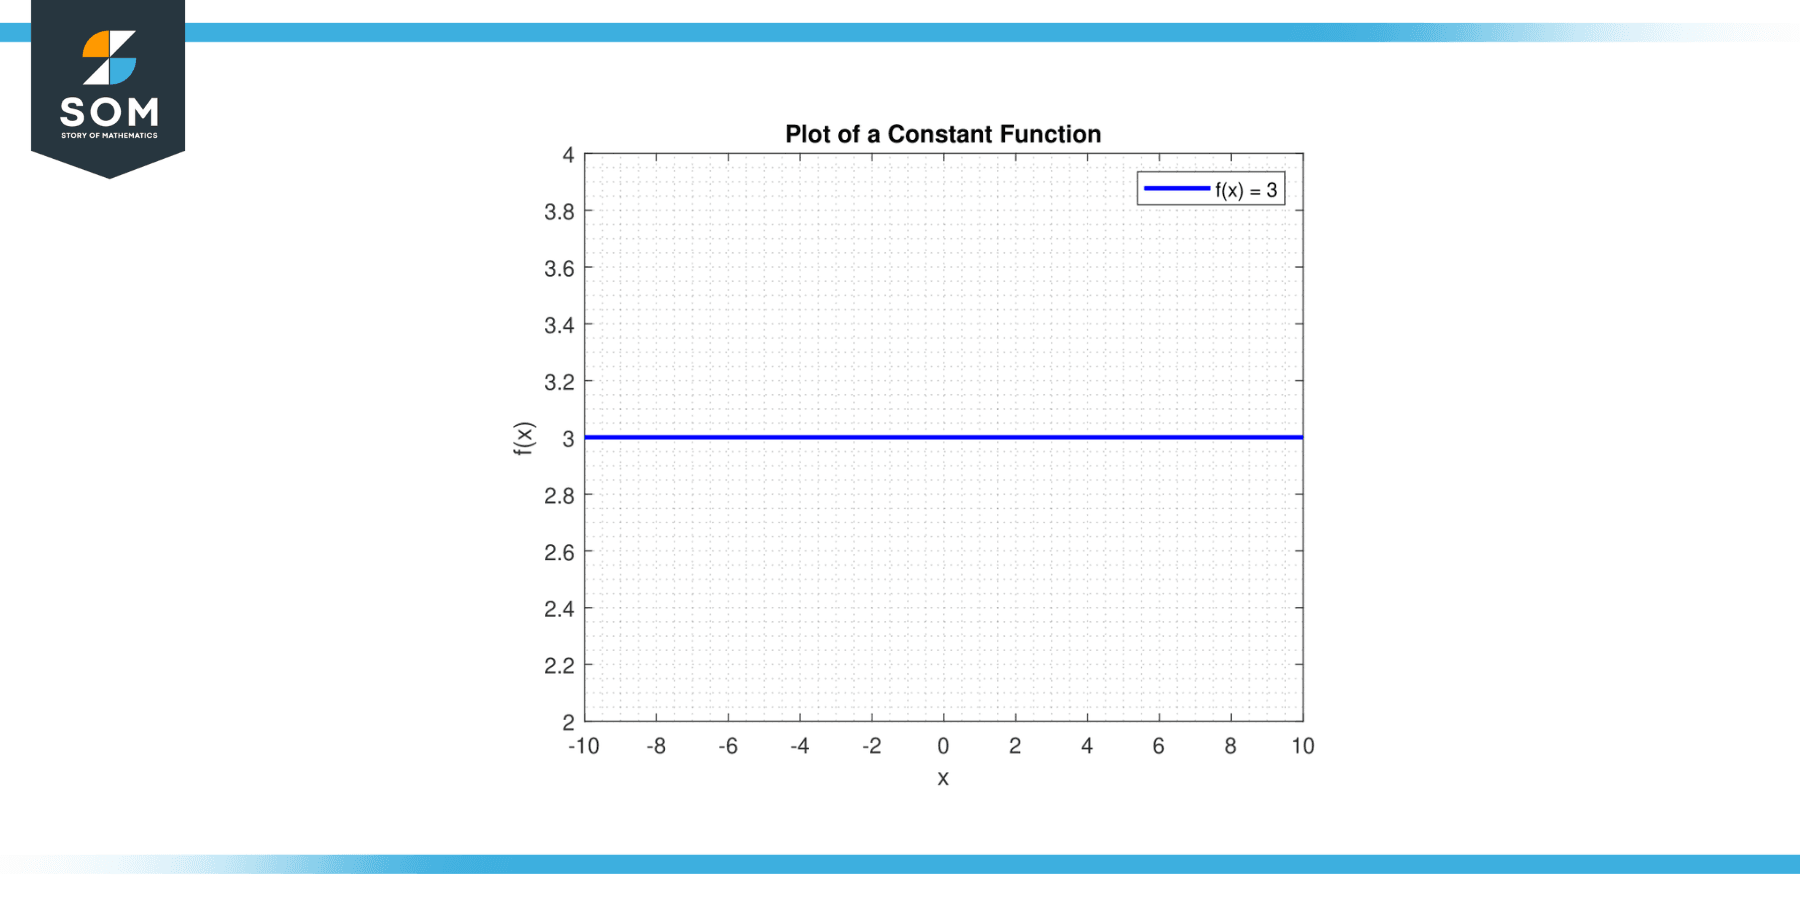
- Constant Function: As the name suggests, for every x value, the output is the same. These graphs are horizontal lines, such as ( y = c ), where c is the constant.
- Identity Function: The output is equal to the input, which means ( f(x) = x ). These are straight lines through the origin at a 45-degree angle.
- Absolute Value Function: These graphs have a ‘V’ shape and follow ( f(x) = |x| ).
- Square Root Function: Starting at zero and increasing, their graphs follow $f(x) = \sqrt{x}$.
For functions needing more clarity, I often use function notation, for instance ( f(x) ), to explicitly indicate the output values corresponding to each x.
When distinguishing between general functions and one-to-one functions, which have unique outputs for each input, the Horizontal Line Test provides clarity. If any horizontal line crosses the graph more than once, the function isn’t one-to-one.
Lastly, understanding the foundational aspects of algebra always enhances my ability to analyze functions, as it encompasses the rules and methods that govern the operations and relations of the symbols and numbers.
Conclusion
In assessing whether a graph represents a function, I always remember the basic principle that for each input value, there must be only one output value.
This means when I use the Vertical Line Test, I’m looking to ensure that a vertical line intersects the graph at most once. If it crosses more than once, then the graph does not depict a function.
For linear, quadratic, or any other type of function, confirming function status is as simple as checking this one-to-one relationship between x-coordinates and y-coordinates.
For a linear function with the form $y = mx + b$, the linearity itself guarantees adherence to the function criteria. However, for a quadratic function given by $y = ax^2 + bx + c$, the parabolic shape should be scrutinized for any potential vertical line intersections that occur more than once.
In my experience, it’s crucial to combine these methods with an understanding of different types of functions and their representations.
With this knowledge, I can effectively determine the functionality of a graph, paving the way for further analysis and interpretation of the mathematical function it represents.