JUMP TO TOPIC

To graph a sine function, I start by setting up a coordinate plane with the x-axis representing the angle in radians and the y-axis representing the sine values.
As a fundamental trigonometry part, the sine function maps the angle to its sine value, which is the y-coordinate of a corresponding point on the unit circle.
The sine curve oscillates between -1 and 1, with a period of $2\pi$ radians, meaning it repeats its pattern every $2\pi$ radians along the x-axis.
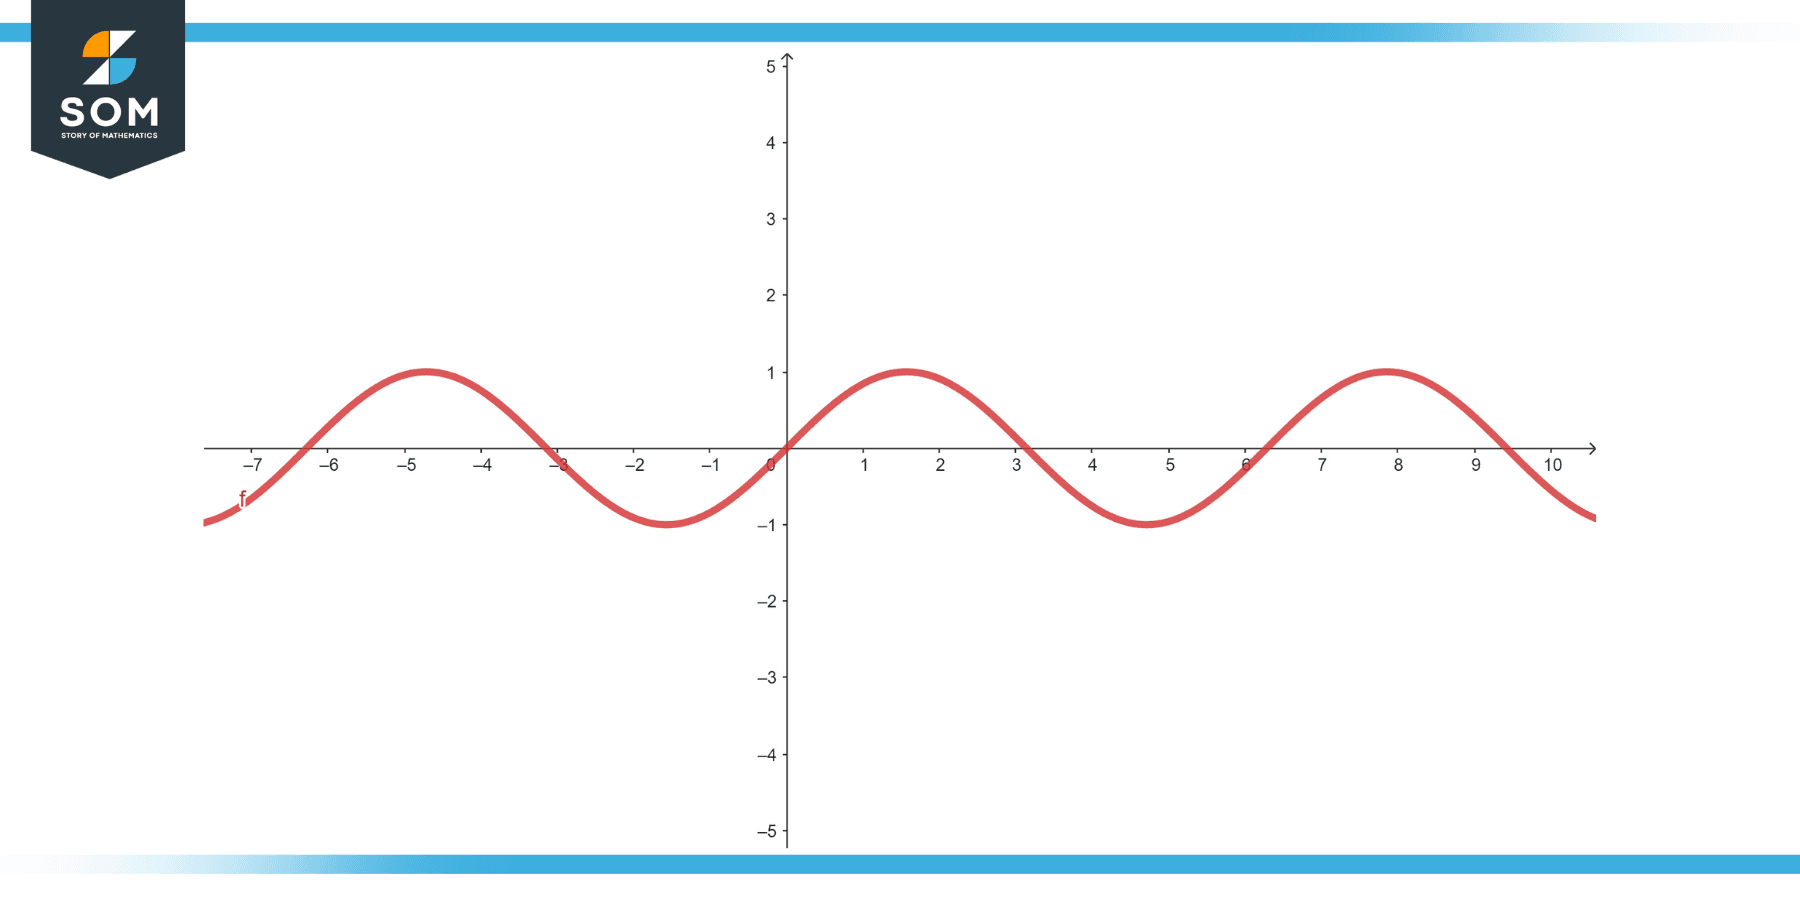 When I plot the function $y = \sin(x)$, it’s essential to mark key points at the quadrantal angles—(0), $\frac{\pi}{2}$, $\pi$, $\frac{3\pi}{2}$, and $2\pi$. These points help guide the shape of the sine wave.
The curve rises to 1 at $\frac{\pi}{2}$, falls to -1 at $\frac{3\pi}{2}$, and intersects the x-axis at (0), $\pi$, and $2\pi$, where the angle’s sine value is zero.
Now, let’s discover the beauty of the sine function‘s repetitive nature and explore how it reflects the symmetrical properties of the unit circle, one of the most elegant aspects of trigonometry. Through this, we’ll gain a deeper understanding of the interconnectedness between the sine function and the unit circle.
Steps for Graphing the Sine Function
I’m going to take you through the key steps in graphing a sine function using both technology and manual methods and then we’ll look at how to interpret these graphs.

Using Technology
When graphing the sine function with technology, such as a graphing calculator or an app, I follow these guidelines:
- Enter the sine function equation in the software. For the basic sine wave, I input $y = \sin(x)$.
- Set the domain of the angle measure which typically involves a range of radians that spans at least one full period of $2\pi$ radians.
- Ensure the vertical axis ranges from -1 to 1, which are the minimum and maximum values of the sine function.
- Adjust settings for transformation features like amplitude, phase shift, or vertical shift if needed.
- Generate the graph and analyze the sinusoidal shape.
Manual Graphing
For manual graphing, remember that the sine curve is periodic and follows a pattern based on the unit circle. Here’s how I draw it:
- Sketch a coordinate plane with the horizontal axis as the ( x )-axis representing the angle in radians, and the vertical as the ( y )-axis representing the sine value.
- Angle ( x ) usually ranges from ( 0 ) to $2\pi$ but can extend to show multiple periods.
- Value ranges from ( -1 ) to ( 1 ) on the vertical axis.
- At points $0, \frac{\pi}{2}, \pi, \frac{3\pi}{2}, $ and $2\pi $, the sine values are ( 0, 1, 0, -1, ) and ( 0 ) respectively.
- Plot these key points and form a smooth sine wave that oscillates from ( 0 ) to ( 1 ) to ( 0 ) to ( -1 ) and back to ( 0 ).
- For different equations of the sine function (like $y = a\sin(bx+c$ ) for example), calculate the amplitude, period, and any phase or vertical shifts.
| x | y |
|---|---|
| ( 0 ) | $ \sin(0) = 0 $ |
| $\frac{\pi}{2}$ | $ \sin(\frac{\pi}{2}) = 1$ |
| $\pi $ | $\sin(\pi) = 0$ |
| $\frac{3\pi}{2}$ | $\sin(\frac{3\pi}{2}) = -1$ |
| $2\pi $ | $\sin(2\pi) = 0 $ |
Interpreting Graphs
Interpreting graphs of the sine function is about noticing its properties:
- The domain is all real numbers, reflecting the function’s infinite continuity along the horizontal axis.
- The range is ([-1, 1]), the maximum heights above and below the horizontal axis.
- Look for symmetry: Sine functions are odd, meaning they have rotational symmetry about the origin.
- The periodic nature shows that the sine wave repeats every $2\pi$ unit along the horizontal axis.
- Identify amplitude (half the distance between the maximum and minimum values) and period (the width of one complete cycle).
Conclusion
In graphing the sine function, I’ve walked you through a step-by-step process. Starting with identifying key properties such as periodicity and amplitude, I showed you how to use these to shape the graph correctly.
Remember that the sine function, represented by $y = \sin(x)$, has a period of $2\pi$. It’s also an odd function, exhibiting symmetry about the origin of a graph.
By plotting points using known values of $x$ and corresponding $\sin(x)$ values, you can sketch the curve. Understanding the unit circle plays a crucial role since $\sin(\theta)$ represents the y-coordinate of a point on the unit circle at an angle $\theta$ from the positive x-axis.
For transformations, such as vertical shifts or stretches, remember to adjust the amplitude or graph accordingly. For instance, a function like $y = 2\sin(x)$ indicates a vertical stretch, doubling the amplitude.
The process discussed here ensures that you create an accurate representation every time you plot a sine function.
I hope my guidance helps you feel more confident in your ability to graph the sine function and apply transformations to it. Keep practicing and always refer back to the unit circle as it underpins the behavior of trigonometric functions!