JUMP TO TOPIC
Sine Graph – Explanation and Examples
The sine graph is a periodic representation of the sine function in the Cartesian plane.
This graph has angles along the x-axis and sine ratios along the y-axis. It repeats itself every $2\pi$ radians. Sine graphs are important for an understanding of trigonometric functions in calculus. It also has many applications in physics, especially in the study of waves and electromagnetic radiation.
Before studying the sine graph, it is important to understand the sine function.
What Does a Sine Graph Look Like?
A sine graph looks like a wave with peaks and valleys. This is not a coincidence. Instead, the graphical representation of physical waves such as light waves or radio waves are transformations of the sine function.
In the sine graph – or sine wave – angles are the independent variable. That is, the x-axis of the graph is the angle measure. These are almost always measured in radians, so the increments are typically $\frac{\pi}{2}$. Since the y-axis represents ratios, there is no unit label for this axis.
The sine graph is periodic, repeating itself every $2\pi$ radians. This makes sense since angles larger than $2\pi$ radians (or less than $0$ radians) will be coterminal with a standard angle greater than or equal to $0$ radians and less than $2\pi$ radians. All real numbers are in the domain of this function.
Additionally, the sine ratio cannot be greater than $1$ or less than $-1$. Therefore, these are the highest and lowest y-values of the function. This means that the range is $1-(-1) = 2$.
How To Graph a Sine Function
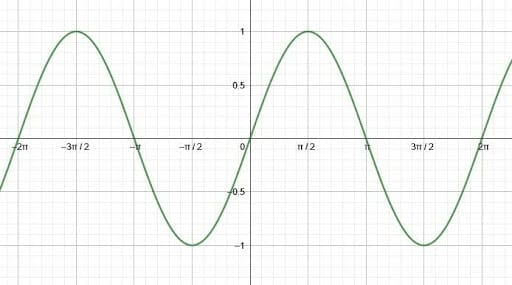
To graph a sine function, begin by plotting the sine values of the quadrantal angles $0, \frac{\pi}{2}, \pi,$ and $\frac{3\pi}{2}$. The sine values at these angles are $0, 1, 0,$ and $-1$, respectively. The sine graph will be a smooth curve connecting these points.
It will also go through the points $(\frac{\pi}{6}, \frac{1}{2}), (\frac{\pi}{4}, \frac{\sqrt{2}}{2}),$ and $(\frac{\pi}{3}, \frac{\sqrt{3}}{2})$. These points represent the sine values at the major angles in the first quadrant.
Sine Function Graph
The sine function graph has a wave shape. There are a few qualities of a wave that help to distinguish it from other waves. These are the midline, the amplitude, and the period.
The midline is a horizontal line exactly between the peaks and valleys. Waves also have an amplitude, which is the distance from the midline to a peak or valley. This amplitude will always be positive. Then the period of a wave is the distance from one peak to another peak or one valley to another valley.
As a wave, the sine function has an amplitude of $1$. The x-axis is its midline, and its period is $2\pi$ radians. As a function, its domain is all real numbers, but its range is $[-1, 1]$. Its y-intercept is $0$, and its x-intercepts are $n\pi$ for all integers $n$.
Additionally, the function is continuous and differentiable. It is also odd, meaning that for any angle, $\theta$, $sin(-\theta) = -sin(\theta)$.
Transformations of the Sine Graph
Transformations of the sine graph include horizontal and vertical shifts as well as horizontal and vertical transformations, which change the wavelength and amplitude. A vertical stretch of the function will be a coefficient in front of $sinx$. For example, the function $2sinx$ is a vertical stretch by a factor of two.
The amplitude of the function will always equal the absolute value of the vertical stretch factor. This is because the crests and troughs of the function have the same distance from the midline, and a rotation over the x-axis does not change this.
A horizontal stretch of the function will be a coefficient in front of the variable. This will widen or compress the function. Accordingly, the period of any transformed function will be $2\pi$ divided by this variable. For example, a function $sin(2\theta)$ has a period of $\frac{2\pi}{2} = \pi$ radians.
Finally, a vertical shift changes the midline by the same number of units up or down.
In algebraic terms, for a transformed function $y=asin(bx+c)+d$:
- The midline is $y=d$
- Amplitude is the absolute value of $a$
- The period is $\frac{2\pi}{b}$
Examples
This section goes over common examples of problems involving sine graphs and their step-by-step solutions.
Example 1
Graph the sine function over the interval $(4\pi, 6\pi)$.
Solution
Take note that this interval does not coincide with the interval of standard angles from $0$ to $2\pi$ radians. This means that all of the angles in this interval must be coterminal with angles in the standard interval.
In particular, this is an interval of length $2\pi$, and it corresponds to the interval $0$ to $2\pi$. This is because $0+4\pi = 4\pi$ and $2\pi+4\pi = 6\pi$.
Therefore, $sin(4\pi) = sin(0) = 0$.
Similarly, $sin(5\pi) = sin(\pi) = 0$ and $sin(6\pi) = sin(2\pi) = 0$.
Then, $sin(\frac{9\pi}{2}) = sin(\frac{\pi}{2}) = 1$ and $sin(\frac{11\pi}{2}) = sin(\frac{3\pi}{2}) = -1$.
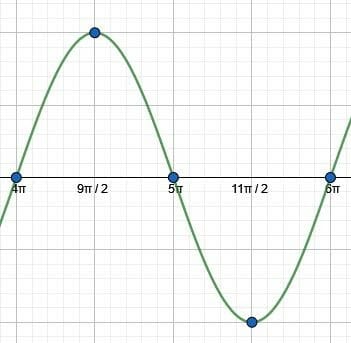
To graph the function, first plot these points: $(4\pi, 0), (\frac{9\pi}{2}, 1), (5\pi, 0), (\frac{11\pi}{2}, -1),$ and $(6\pi, 0)$.
Then draw a wave connecting the shapes. This is the graph of sine over the interval $(4\pi, 6\pi)$.
Example 2
Graph the sine of the function $-sin(-x)$.
Solution
First, remember that the function sine is odd. This means that it is possible to simplify the given function.
In an odd function, an odd input and an even input have the same absolute value but different signs. That is, $f(-x) = -f(x)$.
Since sine is odd, $sin(-x) = -sin(x)$. Therefore, the given function is $-sin(-x) = -(-sin(x)) = sin(x)$.
Thus, this function is the same as a regular sine function.

Example 3
What is the amplitude and period of the transformation of the sine function $4\sin(8\theta)$?
Solution
Recall that the amplitude is the distance from the midline of a wave to its crest or trough (local maximum or local minimum). In the basic sine function, the midline is the x-axis, so the amplitude is $1$.
In a transformed sine function, the amplitude is equal to the absolute value of the vertical stretch factor. Therefore, in this case, the vertical stretch factor is $4$, so the amplitude of the function is $4$.
The period of a function is the distance over which the function repeats itself. In a basic sine function, this is $2\pi$. In a transformed sine function, it is equal to $2\pi$ divided by the coefficient of the angle.
Here, the angle is multiplied by $8$, so the period of the function is $\frac{2\pi}{8} = \frac{\pi}{4}$.
Example 4
Graph the function $\frac{1}{2}sin(\theta+\pi)-\frac{1}{2}$.
Solution
This function is the sine function with a vertical dilation, a horizontal shift, and a vertical shift. To graph this, begin by identifying the shifts along with the amplitude and period.
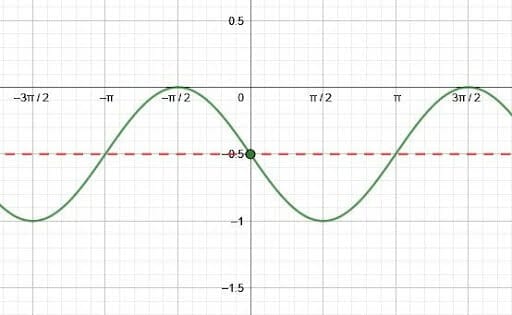
First, the vertical shift is $-\frac{1}{2}$. This means that the whole function moves down $\frac{1}{2}$. Therefore, the midline of the sine wave moves from $y=0$ to $y=-\frac{1}{2}$.
Then, there is a horizontal shift of $\pi$ units to the left. Since, however, the sine value of $0$ and of $pi$ is $0$, the intercepts do not change. Effectively, however, the sine function reflects over the x-axis. This is because the interval $(sin(n\pi), sin((n+1)\pi))$ equals the interval $-(sin((n+1)\pi), sin((n+2)\pi))$.
Finally, the function compresses vertically by a factor of $\frac{1}{2}$. This means that every expected output is halved. Therefore, the maximum of the function is $\frac{1}{2}$ above the midline, and the minimum is $\frac{1}{2}$ below the midline.
Recall that the amplitude of this function is the absolute value of the coefficient of the sine function. Therefore, the amplitude is $|\frac{1}{2}| = \frac{1}{2}$. Since the coefficient in front of the variable $x$ is just $1$, the period of this transformed is the same as that of the basic function, $2\pi$.
Thus, this is the function’s graph.
Example 5
Make a table of values for the cosecant function over the interval $(0, \pi)$, then graph the function. What is the domain and range of this function?
Solution
Recall that the cosecant is the reciprocal of sine. That is, $cscx = \frac{1}{sinx}$. Therefore, the points from the sine function can be used to find the points of the cosecant function.
Therefore, make a table of values for the sine function and include a third column for cosecant.
Angle | Sine | Cosecant |
$0$ | $0$ | Undefined |
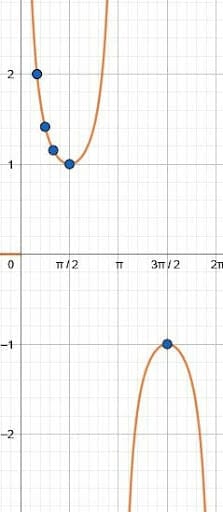
$\frac{\pi}{6}$ | $\frac{1}{2}$ | $2$ |
$\frac{\pi}{4}$ | $\frac{\sqrt{2}}{2}$ | $\sqrt{2}$ |
$\frac{\pi}{3}$ | $\frac{\sqrt{3}{2}$ | $\frac{2\sqrt{3}}{3}$ |
$\frac{\pi}{2}$ | $1$ | $1$ |
$\pi$ | $0$ | Undefined |
$\frac{3\pi}{2}$ | $-1$ | $-1$ |
Take note that $\sqrt{2}$ is greater than $\frac{2\sqrt{3}}{3}$. Additionally, note that the limit of cosecant as the angle goes to $0$ is negative infinity or positive infinity, depending on the sign. This is because when the sine function approaches zero from positive points, the limit is positive infinity. Similarly, when the sine function approaches zero from negative points, the limit is negative infinity.
Since the cosecant is undefined for some angles, so its domain is not all real numbers. It excludes all angles for which the sine is $0$. Therefore, the domain is $(n\pi, (n+1)\pi)$ for all integers $n$.
Additionally, there is no angle for which the cosecant is in the interval $[-1, 1]$, though it achieves all other values. Thus, its range is $(-\inf, -1)$ and $(1, \inf)$.
Therefore, the cosecant function looks like this.
Practice Questions
Images/mathematical drawings are created using Geogebra.