JUMP TO TOPIC
 To graph the complex numbers, I first consider each number as a point on a two-dimensional plane known as the complex plane.
A complex number is written in the form $a + bi$, where $a$ represents the real part and is plotted along the horizontal axis, while $bi$ represents the imaginary part and is plotted along the vertical axis.
To accurately represent the complex number, I simply locate the real number $a$ on the x-axis and the imaginary number $b$ on the y-axis and then place a point where these two values intersect in the complex plane.
Graphing complex numbers provides insights into their properties and aids in visualizing operations such as addition and multiplication. The process resonates with the way I plot coordinates in basic geometry, but here, every point reflects a unique combination of real and imaginary parts.
graphing complex numbers
Join me, and discover not just the simplicity in graphing these numbers, but also the patterns and beauty that emerge when we explore the world of complex numbers on a graph.
Understanding The Complex Plane and Coordinates
When I work with complex numbers, I visualize them on what’s called the complex plane. Think of it just like the regular coordinate plane, but with a twist.

The x-axis represents the real numbers, which I refer to as the real axis, while the y-axis is for the imaginary numbers, aptly named the imaginary axis.
Each complex number corresponds to an ordered pair ((a, b)), where (a) and (b) are real numbers. The complex number is written as (a + bi), where (i) is the imaginary unit satisfying ($i^2 = -1$).
Plotting on the complex plane is straightforward:
- I find the real part (a) on the real axis.
- Then, I locate the imaginary part (b) on the imaginary axis.
It’s the combination of these two movements that lands me at the precise point representing the complex number. Here’s a simple guide:
| Step | Action | Example for (3+4i) |
|---|---|---|
| 1. | Move right/left on the real axis to (a) | Move to 3 on the real axis |
| 2. | Move up/down on the imaginary axis to (b) | Move to 4 on the imaginary axis |
| 3. | Plot the point where the paths intersect | Plot the point (3,4) |
Each plotted point on the complex plane thus represents the complex number as an ordered pair. It’s an incredibly intuitive way to visualize and work with complex numbers, combining both their real and imaginary components.
Graphing Techniques and Tools
When I approach the task of graphing complex numbers, I always start with the basics: the Argand diagram, which is essentially a two-dimensional graph.
It helps to visualize complex numbers much like Cartesian coordinates lets us visualize real numbers.
To plot a complex number, I follow these simple steps:
- Identify the real part, which corresponds to the x-axis.
- Find the imaginary part, which I plot along the y-axis.
- Combine these two to pinpoint the location of the complex number on the plane.
Here’s a table I often use for reference when plotting:
| Step | Action |
|---|---|
| 1. Real Part | Horizontal axis (x-axis) placement |
| 2. Imaginary Part | Vertical axis (y-axis) placement |
| 3. Combine | Mark the point where the two axes intersect |
For the graphing itself, I might use an online tool like Desmos to bring functions to life and animate graphs. These online calculators can be incredibly intuitive, allowing me to add sliders and dynamically interact with complex numbers or functions.
Let’s say I have a function $f(z) = z^2$. To graph this, I’d use a graphing tool and:
- Input the function $f(z)$.
- Plot various complex numbers $z$ and observe their transformation.
Finally, plotting complex numbers and functions allows me to determine attributes like the magnitude or argument (arg) of complex numbers. I always keep in mind that the magnitude corresponds to the distance from the origin, and the arg shows the angle made with the positive x-axis.
Remember, each plotting point encapsulates two pieces of information – the real and imaginary part of the complex number, providing a comprehensive view of its position in the complex plane.
Properties of Complex Numbers in Graphs
When I graph a complex number, it’s plotted similarly to a point on the Cartesian plane, where the horizontal axis (real axis) represents the real part, and the vertical axis (imaginary axis) denotes the imaginary part. A complex number $z = x + iy$ is therefore depicted by a unique point $(x, y)$. Let me share some properties:
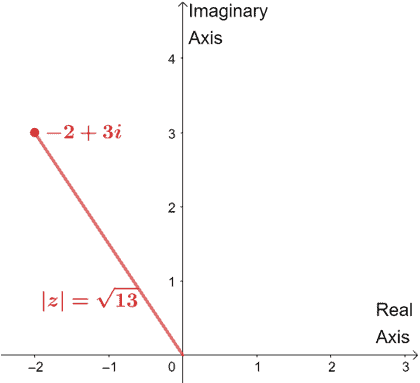
Magnitude and Absolute Value:
The magnitude, or absolute value, of a complex number corresponds to the distance from the origin to the point $(x, y)$ on the graph. Mathematically, it’s represented as $|z| = \sqrt{x^2 + y^2}$, which applies the Pythagorean theorem.
| Term | Representation | Description |
|---|---|---|
| Magnitude | $z$ | The magnitude of the complex number |
| Absolute Value | $\sqrt{x^2 + y^2}$ | The Euclidean norm in the complex plane. |
Angles and the Trigonometric Connection:
The angle $\theta$, formed by the line segment connecting the origin to the point and the positive real axis, relates to the complex number’s direction. In trigonometric terms, $\cos(\theta)$ gives the x-coordinate (real part) and $\sin(\theta)$ gives the y-coordinate (imaginary part) when the magnitude of $z$ is 1.
Pythagoras in the Complex Plane:
Any triangle formed by the points (0, 0), (x, 0), and $(x, y)$ on the complex plane will satisfy the relation $x^2 + y^2 = |z|^2$, a reflection of the Pythagorean theorem.
In my experience, these fundamental properties help us understand and perform complex operations, and their consistency is key to advanced applications in geometry and trigonometry.
Applying Graphs to Complex Problems
When I face complex problems, especially those involving complex numbers, I find that using graphs helps to simplify the situation. Complex numbers consist of a real part and an imaginary part, so graphing these numbers requires a two-dimensional plane.
This is typically called the complex plane, where the x-axis represents the real part, and the y-axis represents the imaginary part.
Let’s say I have a complex number ( z = x + iy ), where ( x ) is the real part, and ( iy ) is the imaginary part. To graph it, I’d plot a point where the x-coordinate is ( x ) and the y-coordinate is ( y ).
| Part | Coordinate |
|---|---|
| Real | ( x ) |
| Imaginary | ( y ) |
When graphing functions involving complex numbers, I always consider the input (which is a complex number) and the output (which can also be a complex number). For example, the function ($ f(z) = z^2 $ ) will map every complex number ( z ) onto another point in the complex plane, which represents ($ z^2 $ ).
These visual representations provide immense clarity and facilitate a deeper understanding of the properties and behaviors of complex functions. Visualizing the transformation of complex numbers through graphing allows me to effectively tackle and comprehend otherwise intricate problems in complex analysis and related fields.
Basics of Complex Numbers
Complex numbers are a fundamental concept in mathematics, combining both real and imaginary elements. A complex number is expressed in the form
$ z = a + bi, $
where ( a ) and ( b ) are real numbers, and ( i ) is the imaginary unit with the property that ( $ i^2 = -1$ ). The value ( a ) is known as the real part of the complex number, while ( b ) is referred to as the imaginary part.
Here’s a quick breakdown to understand complex numbers better:
- The Real Number System: These include both rational numbers (like $ \frac{1}{2}$ , 2 ) and irrational numbers (like $ \sqrt{2}$ , $ \pi$ ). They are found on the horizontal axis of the complex plane.
- Imaginary Numbers: These are multiples of ( i ). For example, ( 2i ) or ( -3i ) are imaginary numbers. They are located on the vertical axis of the complex plane.
When we represent complex numbers on a plane, we use the complex plane or Argand diagram, which has two axes:
| Axis | Represents |
|---|---|
| Real Axis (Horizontal) | The real part of complex numbers |
| Imaginary Axis (Vertical) | The imaginary part of complex numbers |
By understanding these basics, I can graph any complex number on this plane by plotting a point where the horizontal coordinate corresponds to the real part and the vertical coordinate to the imaginary part. This graphical representation gives a visual perspective of how complex numbers behave and interact.
Conclusion
Graphing complex numbers, such as $z = a + bi$, enables me to visualize them uniquely and insightfully. By representing $a$ on the real axis and $b$ on the imaginary axis, I create a clear picture of the number’s position in the complex plane. It’s like pinpointing a location on a map, where each complex number has its distinct coordinates, or point $(a, b)$.
I find it useful to think of the complex plane as similar to the Cartesian coordinate system I’m familiar with. However, instead of $(x, y)$, I work with $(\text{Re}(z), \text{Im}(z))$, where $\text{Re}(z)$ and $\text{Im}(z)$ denote the real and imaginary parts of $z$, respectively.
With this method, I can draw upon my knowledge of coordinates to understand complex numbers more deeply. When I plot multiple complex numbers, I gain insights into their relationships, such as proximity and patterns, which are not as obvious without a visual representation.
Importantly, this graphing technique is fundamental when I’m dealing with complex functions and transformations, as it provides a clear, visual interpretation of otherwise abstract concepts.
Remembering that each point on the complex plane corresponds to a single complex number encourages me to explore further into the world of complex analysis with confidence. Whether for academic purposes or just out of curiosity, the graphing of complex numbers is a skill that serves me well.