 Intervening variable
- Dependent variable
- None
- Independent variable
This question aims to find a variable that is being predicted in regression analysis. For this purpose, we need to find the linear regression equation.
Regression analysis is a method for analyzing and comprehending the relationship between two or more variables. An advantage of this process is that it helps in understanding the significant factors, the factors that can be neglected, and their interaction with one another.
Simple linear regression and multiple linear regression are the two most common types of regression, though non-linear regression techniques are available for more complex data. Multiple linear regression utilizes two or more independent variables to predict the result of the dependent variable, whereas simple linear regression utilizes one independent variable to predict the result of the dependent variable.
Expert Answer
Step $1$
We use regression analysis to estimate or predict the dependent variable based on the independent variable by using the following Simple Linear Regression equation:
SSR $y=a+b\times x$
Where the sum of squares due to regression (SSR) describes how well a regression model depicts the data that have been modeled, and where $a$ is the intercept, and $b$ is the slope coefficient of the regression equation.
$y$ is the variable (dependent or response), and $x$ is the independent or explanatory variable.
Step $2$
As we know, Regression analysis is useful for prediction or forecasting.
In the Regression line, one variable is the dependent variable and the other variable is the independent variable. The dependent variable is predicted on the basis of the independent variable (Explanatory variable).
Thus, the dependent variable is being predicted, so “Dependent variable” is the correct choice.
Example
For the given data points, find the least square regression line.
$\{(-1,0),(1,2),(2,3)\}$
Numerical Solution
First, tabulate the given data:
$x$ | $y$ | $xy$ | $x^2$ |
$-1$ | $0$ | $0$ | $1$ |
$1$ | $2$ | $2$ | $1$ |
$2$ | $3$ | $6$ | $4$ |
$\sum x=2$ | $\sum y=5$ | $\sum xy=8$ | $\sum x^2=6$ |
$a=\dfrac{n\sum(xy)-\sum x\sum y}{n\sum x^2-(\sum x)^2}$
$=\dfrac{(3)(8)-(2)(5)}{(3)(6)-(2)^2}=1$
$b=\dfrac{\sum y-a\sum x}{n}$
$=\dfrac{5-(1)(2)}{3}=1$
Since $y=a+bx$
So, $y=1+x$.
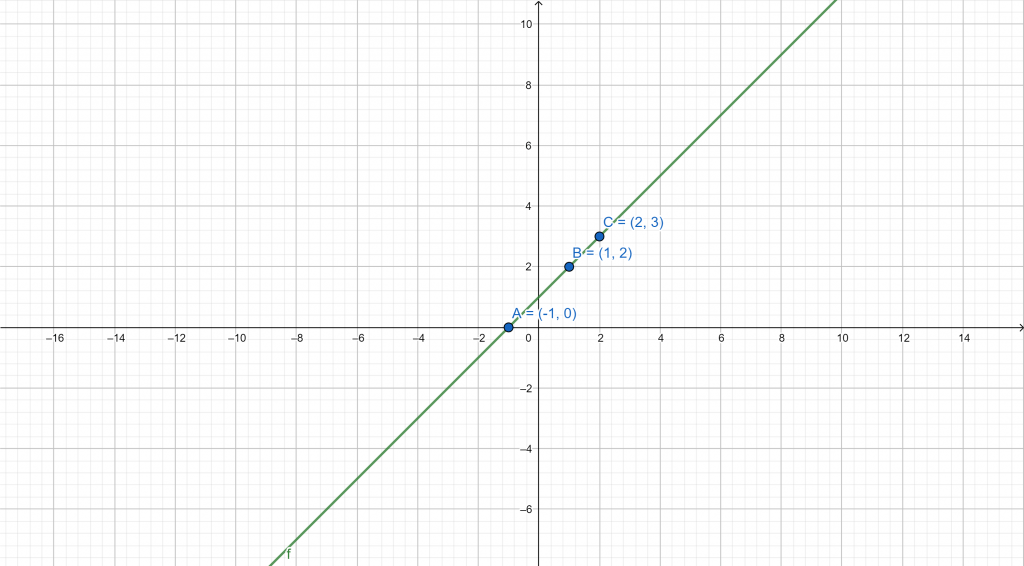
Graph of linear regression
Images/mathematical drawings are created with GeoGebra.