JUMP TO TOPIC
 The antiderivative graph is the graph of the antiderivative or integral of a given function.
Take note that if we take the antiderivative of a derivative, it will provide us with the original function. Hence, when we want to sketch or draw the graph of an antiderivative, we are converting a derivative function to its original form.
In this guide, we will learn what an antiderivative graph means and how to draw or sketch an antiderivative graph accurately.
What Is Meant by Antiderivative Graph?
The antiderivative graph is the graph of an inverse derivative function, and the antiderivative is the opposite of the derivative function. When we take the integral of the derivative of a function, then it is called an antiderivative function, and the outcome of such function is the original function of the given differential equation.
Suppose we are given a function $f(x) = x^{3}$, then the antiderivative of this function is $F(x) = \dfrac{x^{4}}{4} + c$. Take note that if we take the derivative of $F(x)$, we get $f(x)$ back. If we draw the graph for F(x), then it will be called an antiderivative graph. The constant value “c” determine the vertical location of the graph, all the antiderivative graphs of a given function are simply vertical translations of each other, and their vertical location depends upon the value of “c”.
Drawing an Antiderivative Graph From a Derivative Function
We can easily draw the graph of an antiderivative function from the given derivative function, but to draw a graph, you should know some important points first.
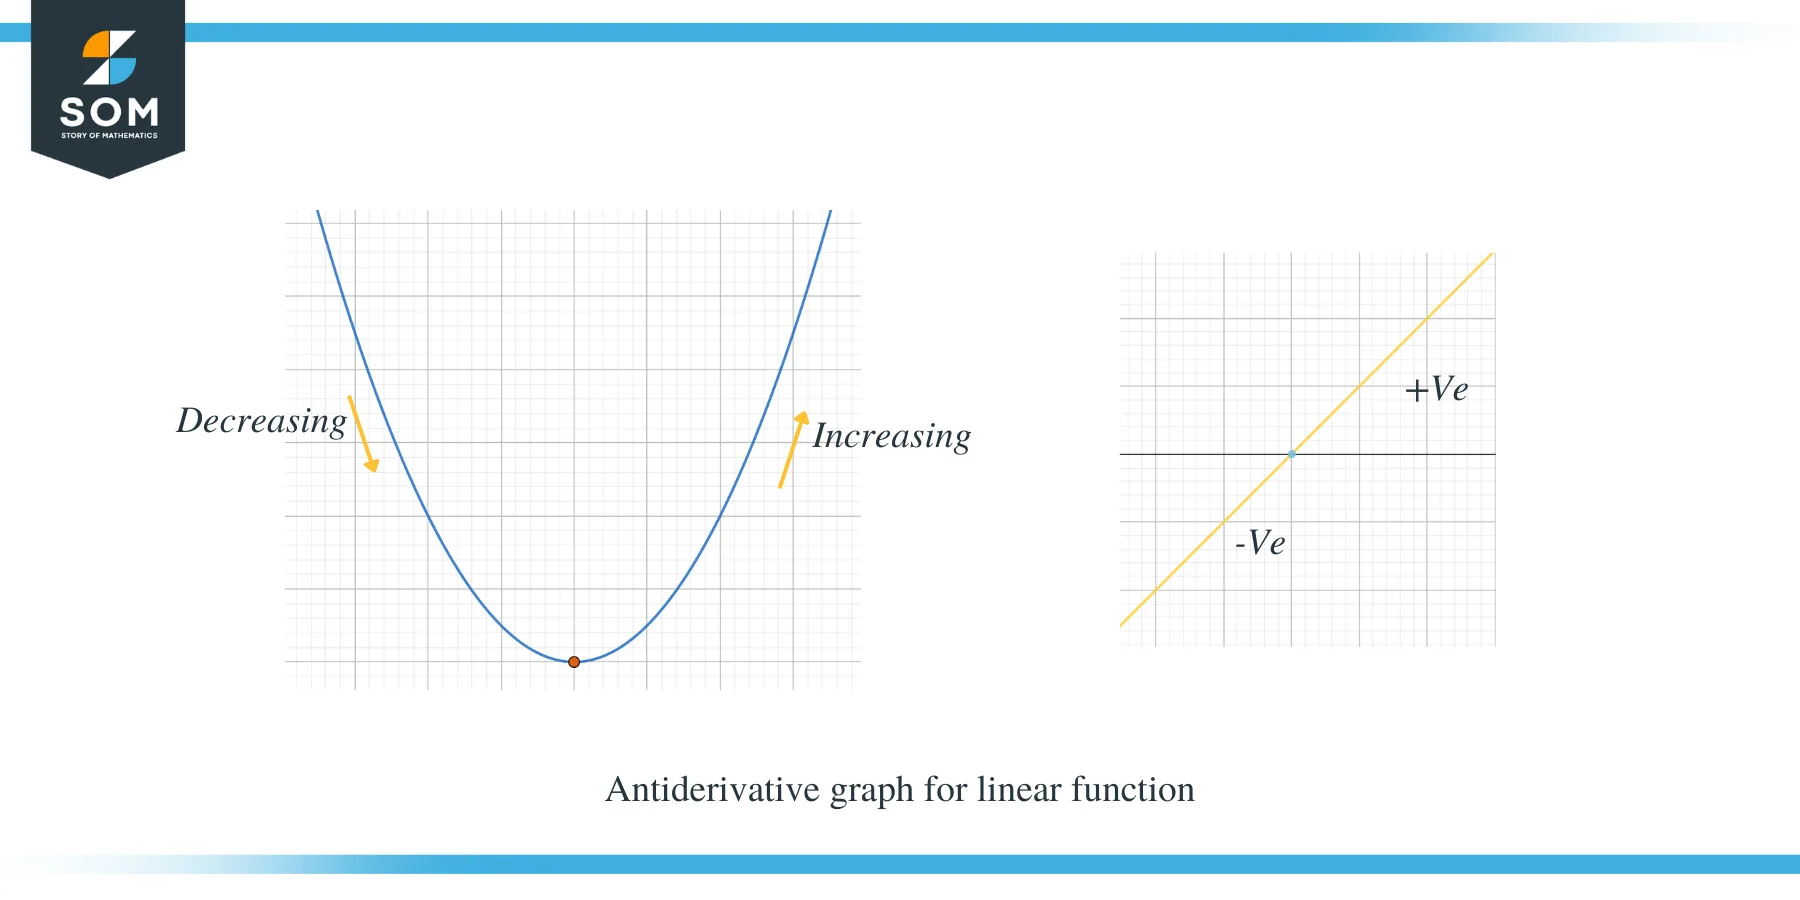
- If the derivative function $f’ (x)$ is below the x-axis, the original function’s slope will be negative.
- If the derivative function $f’ (x)$ is above the x-axis, the original function’s slope will be positive.
- All the x-intercept points of the derivative functions $f’ (x)$ will be the critical points / relative maximum points of f(x).
- If the derivative function is an even function, then the antiderivative function will be an odd function. Similarly, if the derivative function is an odd function, then the antiderivative function will be an even function.
Let us study the two graphs given below; the first graph shows the antiderivative graph for a linear function.
The second example shows the antiderivative graph of a parabola.
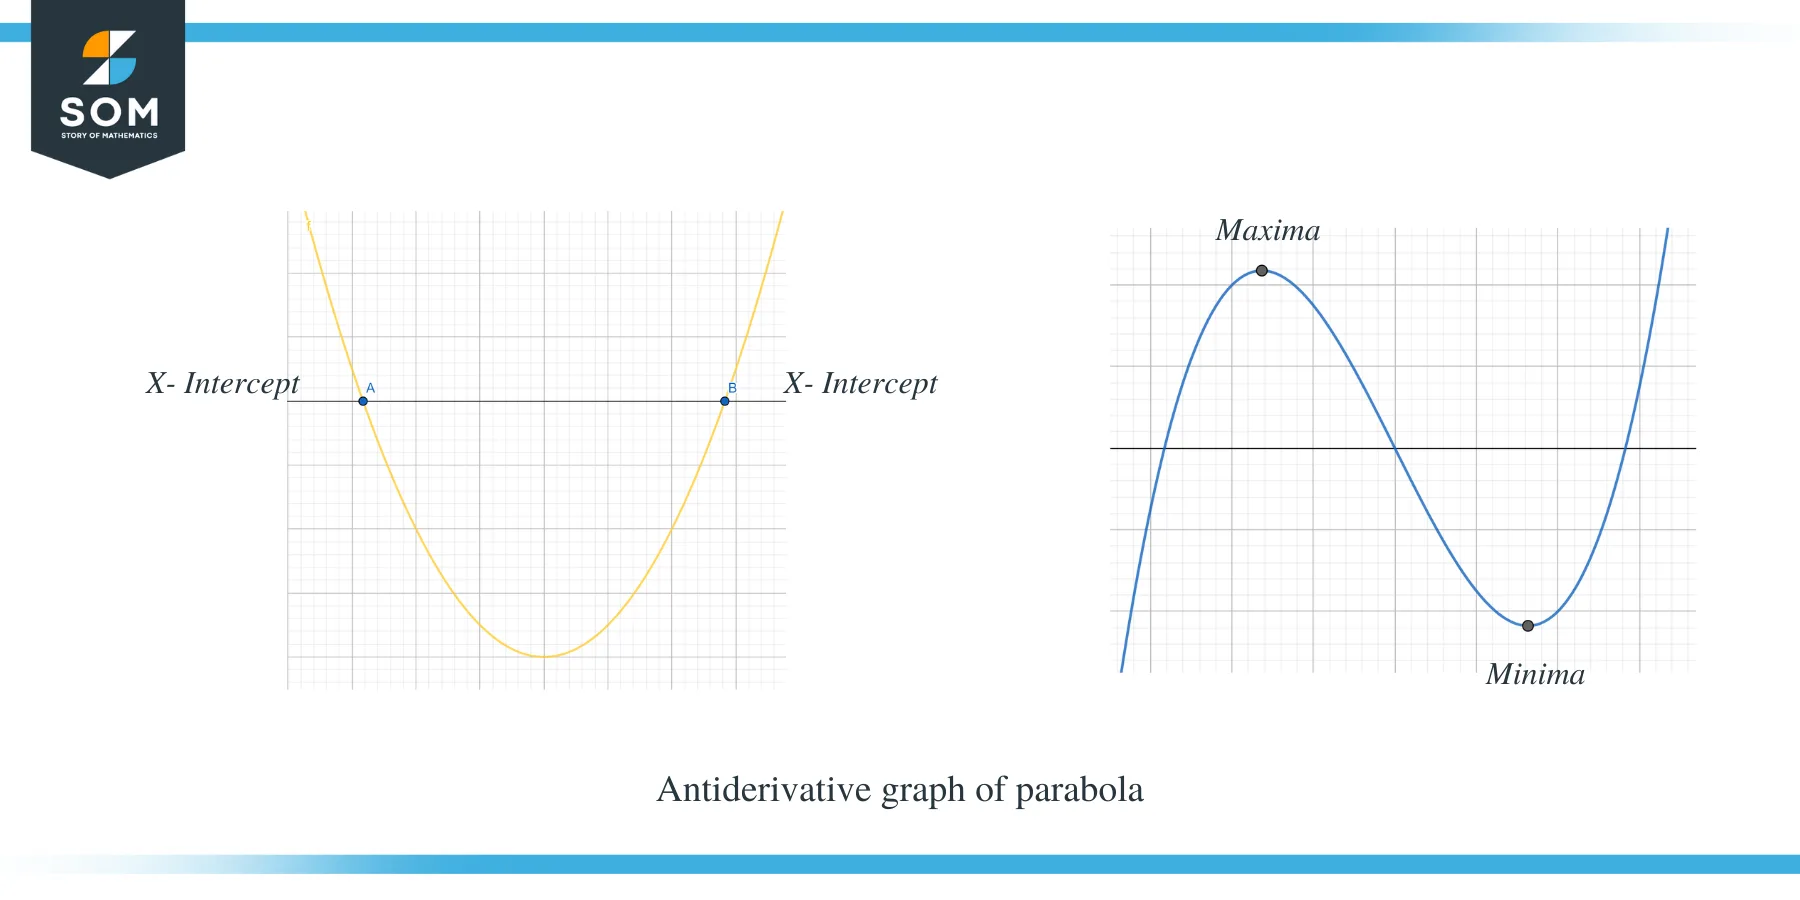
You can clearly see that when the $f’ (x)$ was above the x-axis, then the slope of $f(x)$ is positive, and when $f’ (x)$ is below the x-axis, then the slope of f(x) is negative. Furthermore, we can also observe that the x-intercept points of $f'(x)$ are the critical points for $f(x)$.
Derivative vs Antiderivative Functions
The difference between the derivative and antiderivative functions is presented in the table below. In the table, the original function or the antiderivative function is represented by “$F$” while the derivative function is represented by $f’$. It is essential that you grasp the basic differences between them because it will help you in solving complex problems when drawing an original function graph from a derivative graph.
| Derivative Functions | Antiderivative Functions |
When antiderivative $F$ is increasing, then $f’$ will be positive. | If $f’$ is positive, then $F$ will be increasing. |
When antiderivative $F$ is increasing, then $f’$ will be positive. | If $f’$ is negative, then F will be decreasing. |
At maxima or minima of $F(x)$, the value of $f'(x)$ will be zero. | When $f’$ will be zero, then F will either have a maxima or a critical number. |
If $F” = 0$, then we will have a change in concavity, and this point will be called inflection point. | As $F” = f’$, so when $F” = 0$, then it is certain $f’$ will either have a minima or maxima. |
If the antiderivative function is concave down, then $f’$ is negative. | When $f’$ is negative, then F is concave down. |
If the antiderivative function is concave up, then $f’$ is positive. | When $f’$ is positive, then F is concave up. |
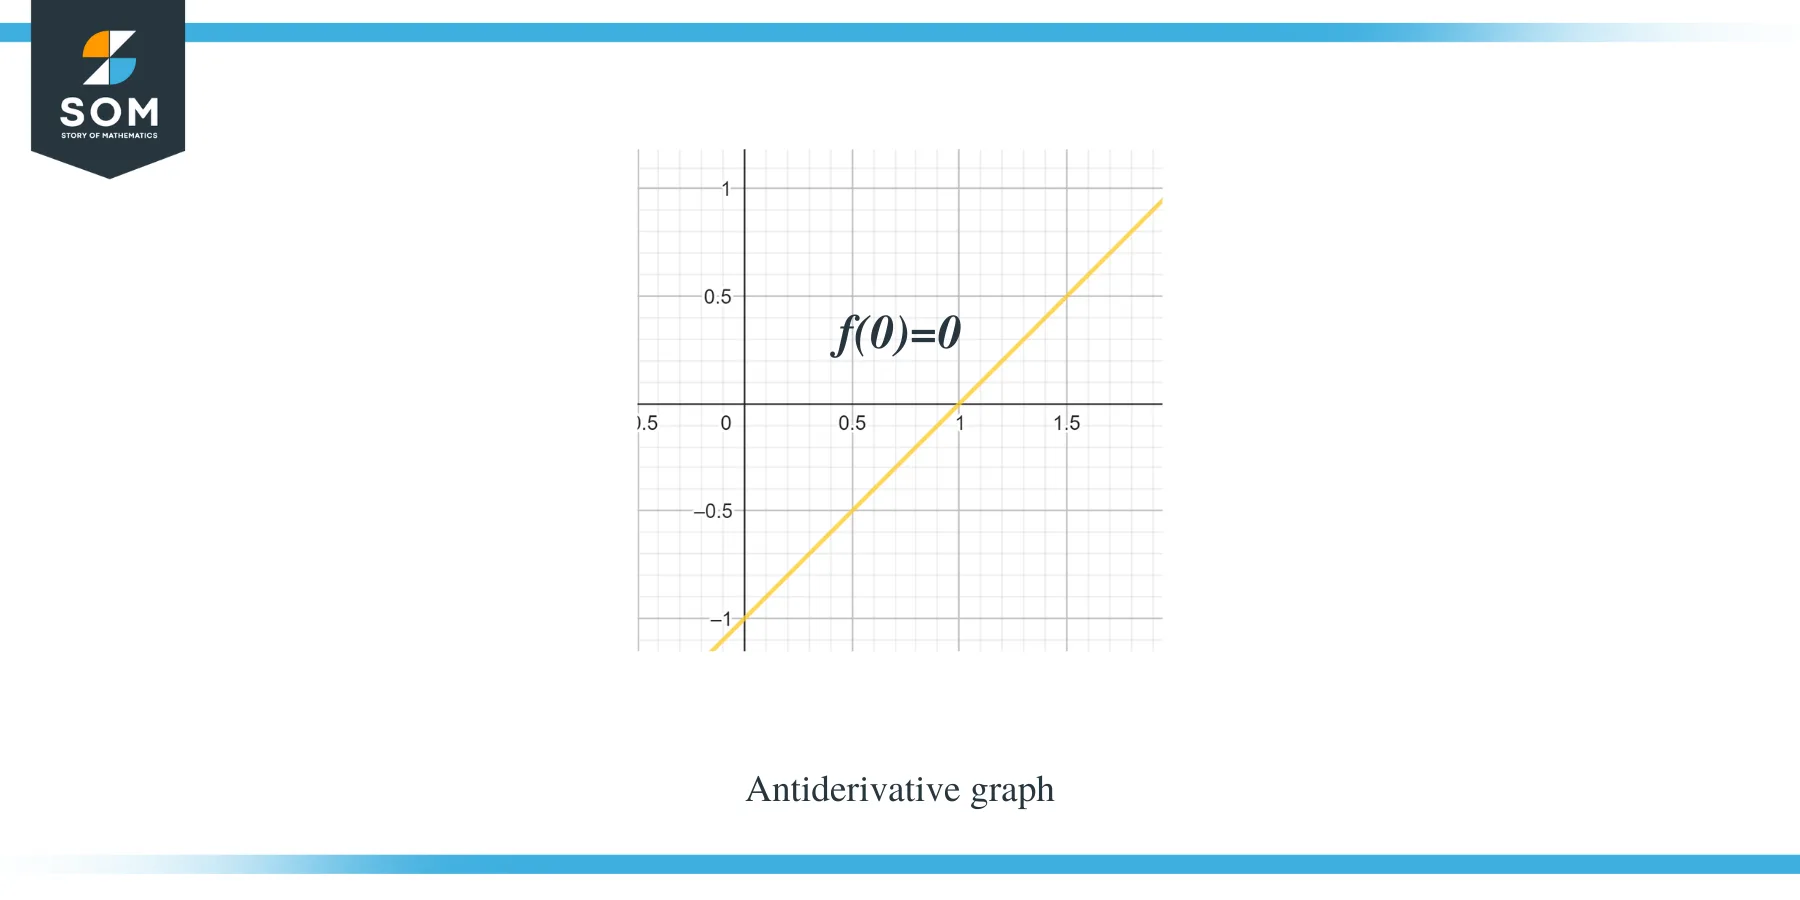
Example 1: You are given a graph for a piecewise linear function/ smooth function f(x), and you are required to sketch a graph for its antiderivative function such that $F(0) = 0$.
Solution:
The graph we are given is for the function $f(x)$. This graph is a derivative graph for function $F(x)$, so we can say that $f(x) = F'(x)$.
To accurately plot the graph of the function, we have to apply the rules which we have learned so far.
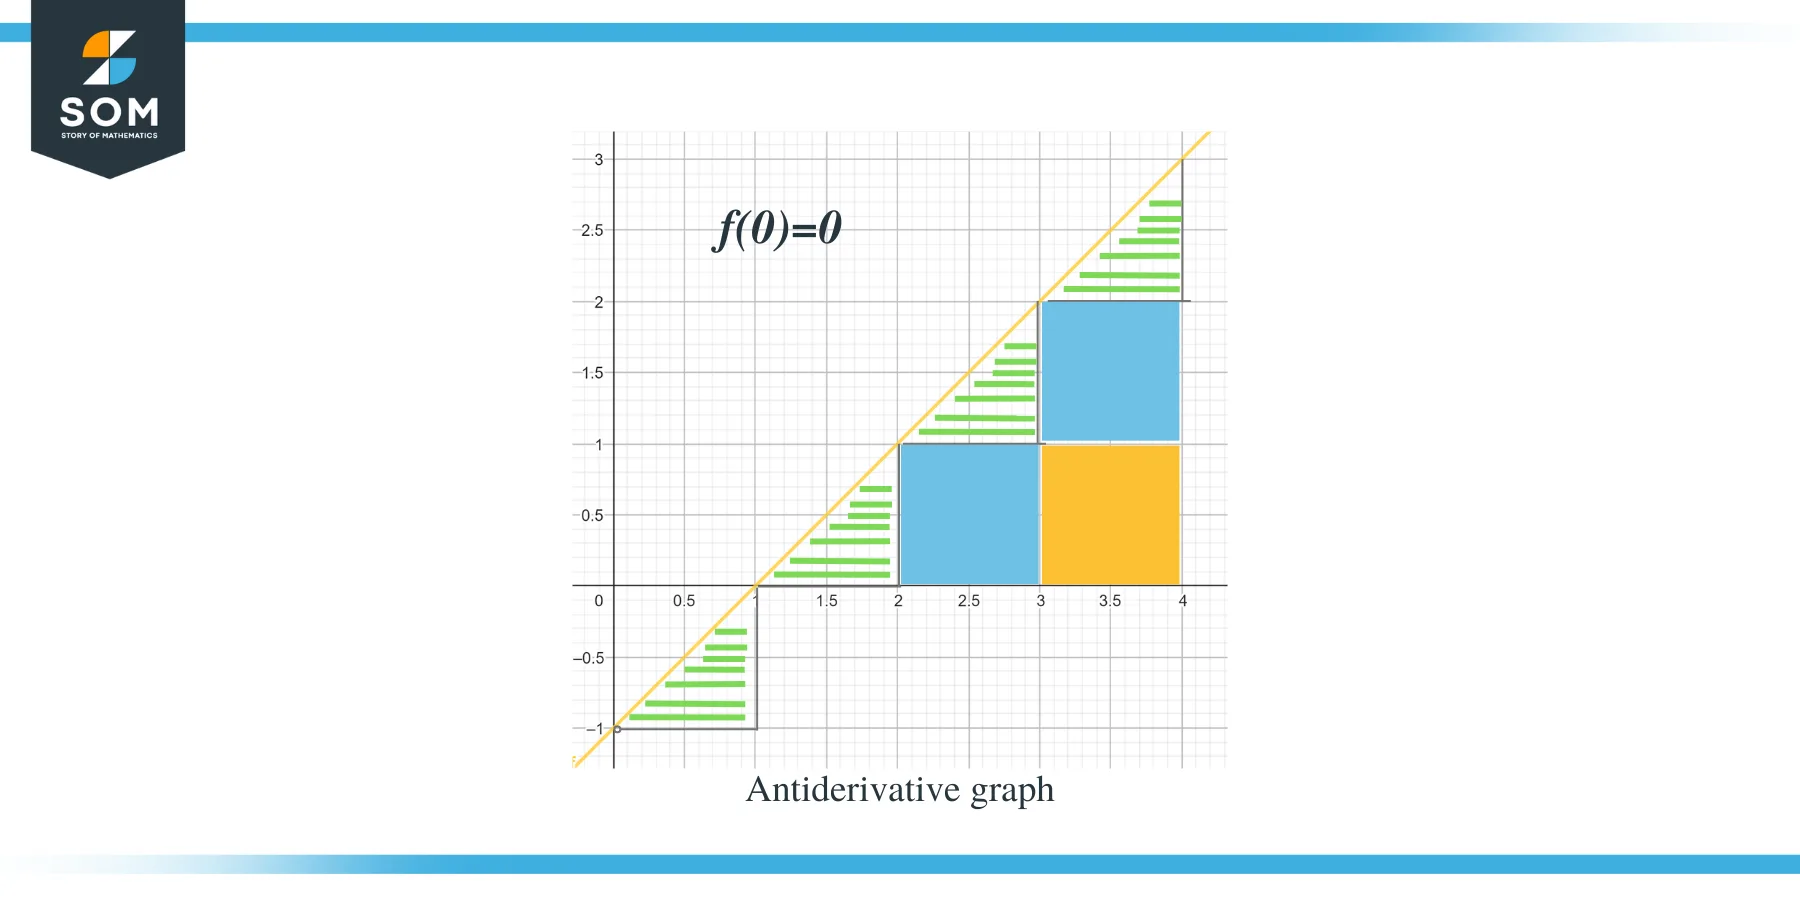
Let us re-draw the graph and then apply the rules accordingly.
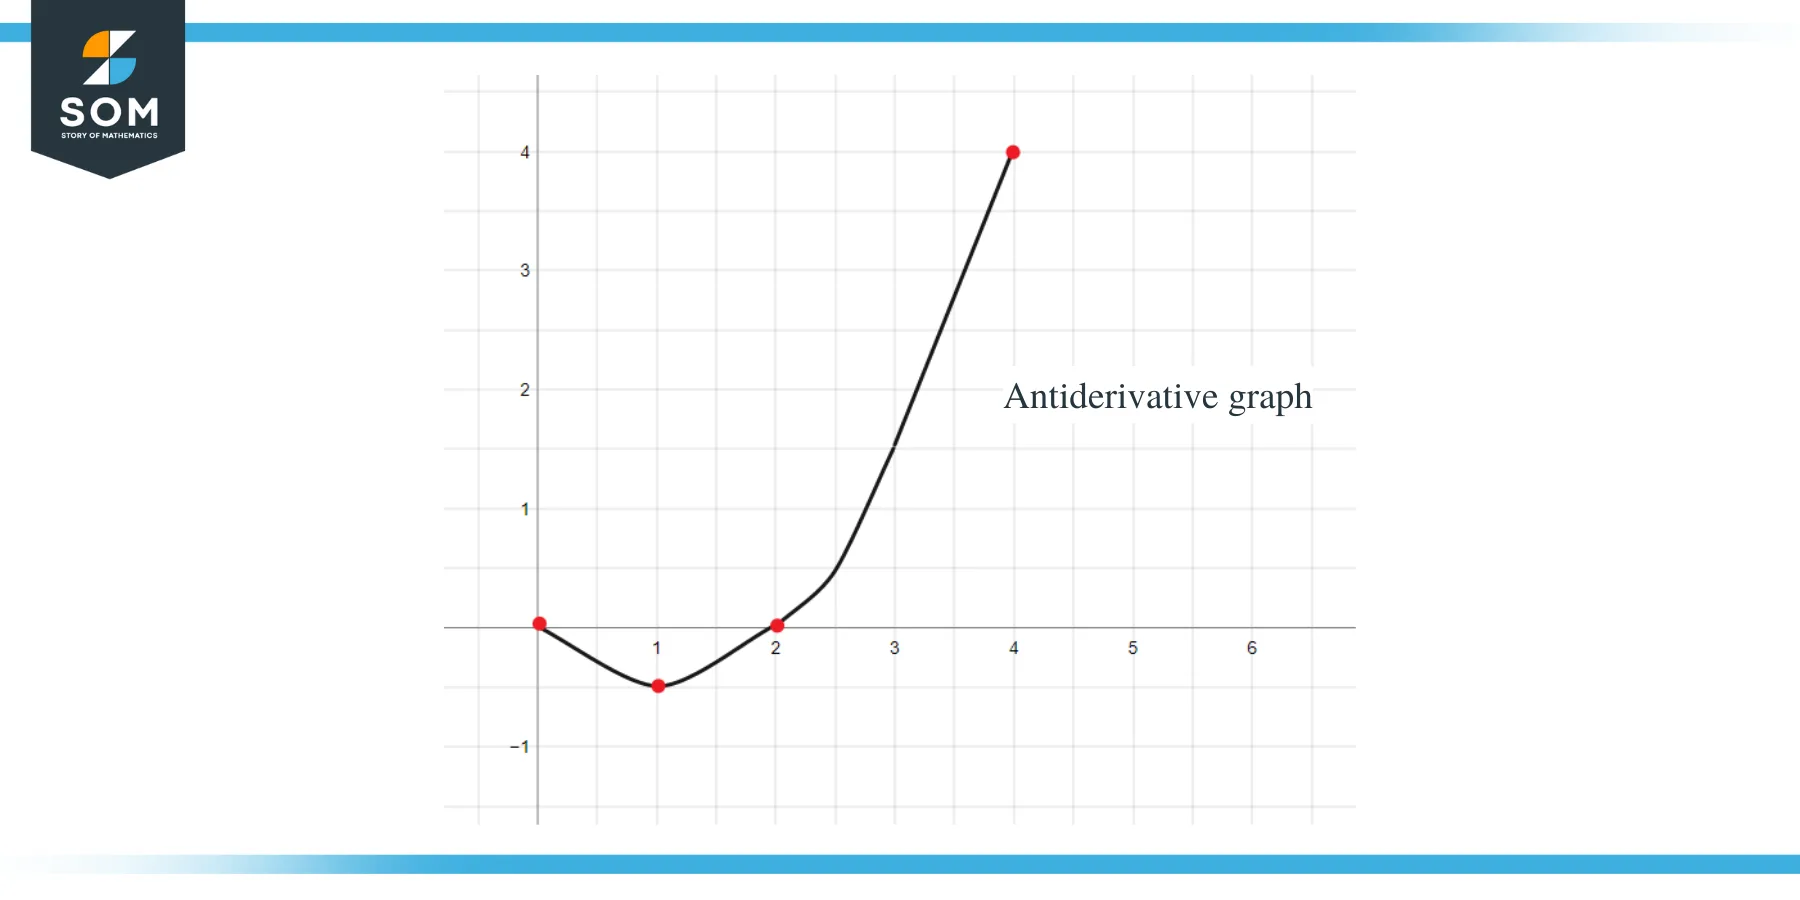
- The antiderivative graph will start at $(0,0)$ as we are given $F(0) = 0$.
- If we go along the x-axis from 0 to 1, we can see that “f” or “$F’$” is less than zero or negative, so the graph of F from 0 to 1 will be decreasing.
- When we go along the x-axis from 1 to 2, we can see that “$f$” or “$F’$” is greater than zero or positive, so the graph of F from 1 to 2 will be increasing.
- Similarly, when we go along the x-axis from 2 to 4, we can see that “$f$ “or “$F’$” is greater than zero or negative, so the graph of $F$ from 2 to 4 will be increasing.
- The value graph of $F’ (x)$ or $f(x)$ is “0” at x = 1, so at this point, the antiderivative graph will have its minima point because the graph also decreases from interval 0 to 1.
Now that we are aware of the direction of the antiderivative graph for the given function, let us discuss how can we calculate the magnitude values of each interval. The expected value of the antiderivative graph can be calculated by measuring or calculating the area under the curve of the given graph. We have highlighted the triangles by using bars, while square portions are colored.
- For the interval $[0,1]$, a right-angle triangle is being formed, and the height and base of the triangle are 1 unit each. So the area of this region will be Area $= \dfrac{1}{2} \times base \times height = \dfrac{1}{2}\times 1 \times 1 = \dfrac{1}{2}$.
- For the interval $[1,2]$, just like the previous interval, a right-angle triangle is being formed and the height and base of the triangle are 1 unit each. So the area of this region is also $= \dfrac{1}{2}$.
- For the interval $[2,3]$, a square is formed for the range or y-interval $[0,1]$ and a triangle is formed for the range or y-interval $[1, 2]$. The square formed is a unit square with all sides equal to unit 1; hence, the area of the square is = 1 unit, while the area of the triangle is just like the area of previous triangles, $= \dfrac{1}{2}$ unit. So the total area of this region is $= 1 + \dfrac{1}{2} = \dfrac{3}{2}$.
- For the interval $[3,4]$, two unit squares are being formed for the range or y-interval $[0,1]$ and for the range or y-interval [1,2] while a triangle is being formed for the range or y-interval $[2, 3]$. The area of both unit squares is 1 unit each while the area of the triangle is $\dfrac{1}{2}$. So the total area of this region will be $= 1 + 1 + \dfrac{1}{2} = \dfrac{5}{2} = 2\dfrac{1}{2}$ and the next point will be 2 and half units away from the previous point.
The area of the piecewise regions or the multiple antiderivatives in a single function/graph can also be determined by using the simple calculus formula of the definite integrals. The definite integral formula is given as:
$F(b) – F(a) = \int_{a}^{b} F'(x)$
By using all the above data, we can graph the antiderivative graph of the given function as:
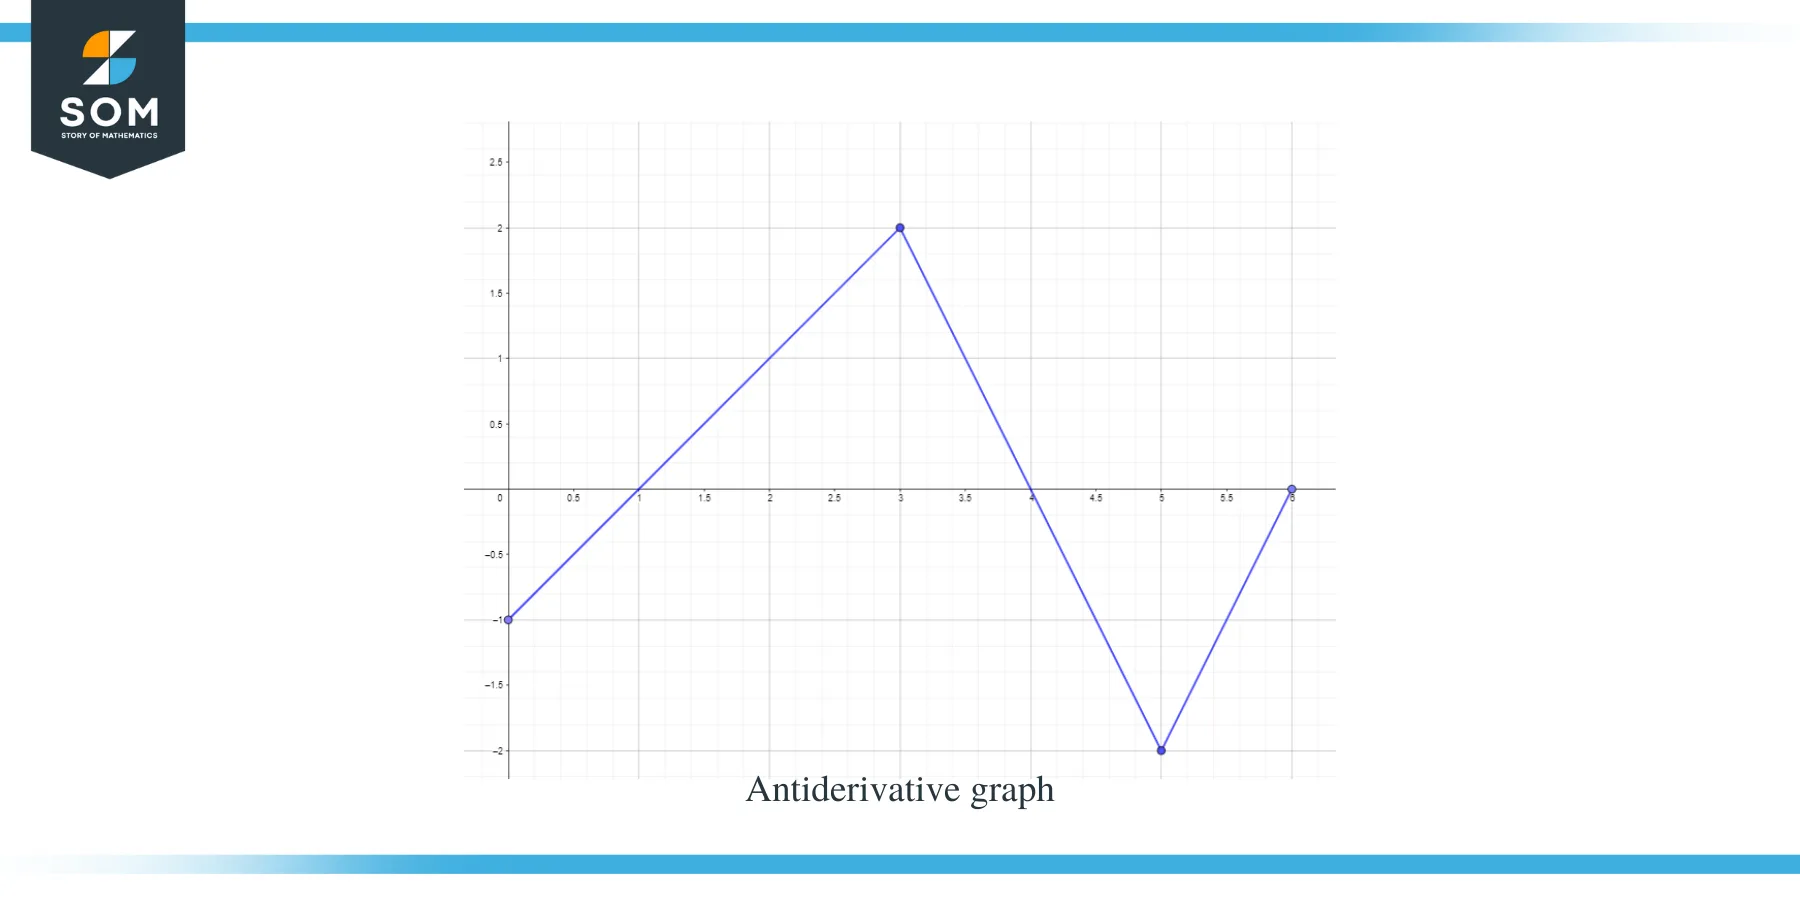
Example 2: You are given a graph for function $f(x)$ and you are required to sketch a graph for its antiderivative function such that $F(0) = -1$.
Solution:
We are given a graph for the function f(x). This graph is a derivative graph for function $F(x)$, so we can say that $f(x) = F'(x)$.
To accurately plot the graph of the function, we have to apply the rules which we have learned so far.
Constructing accurate graphs of antiderivatives can easily be done by applying the rules which we learned so far.
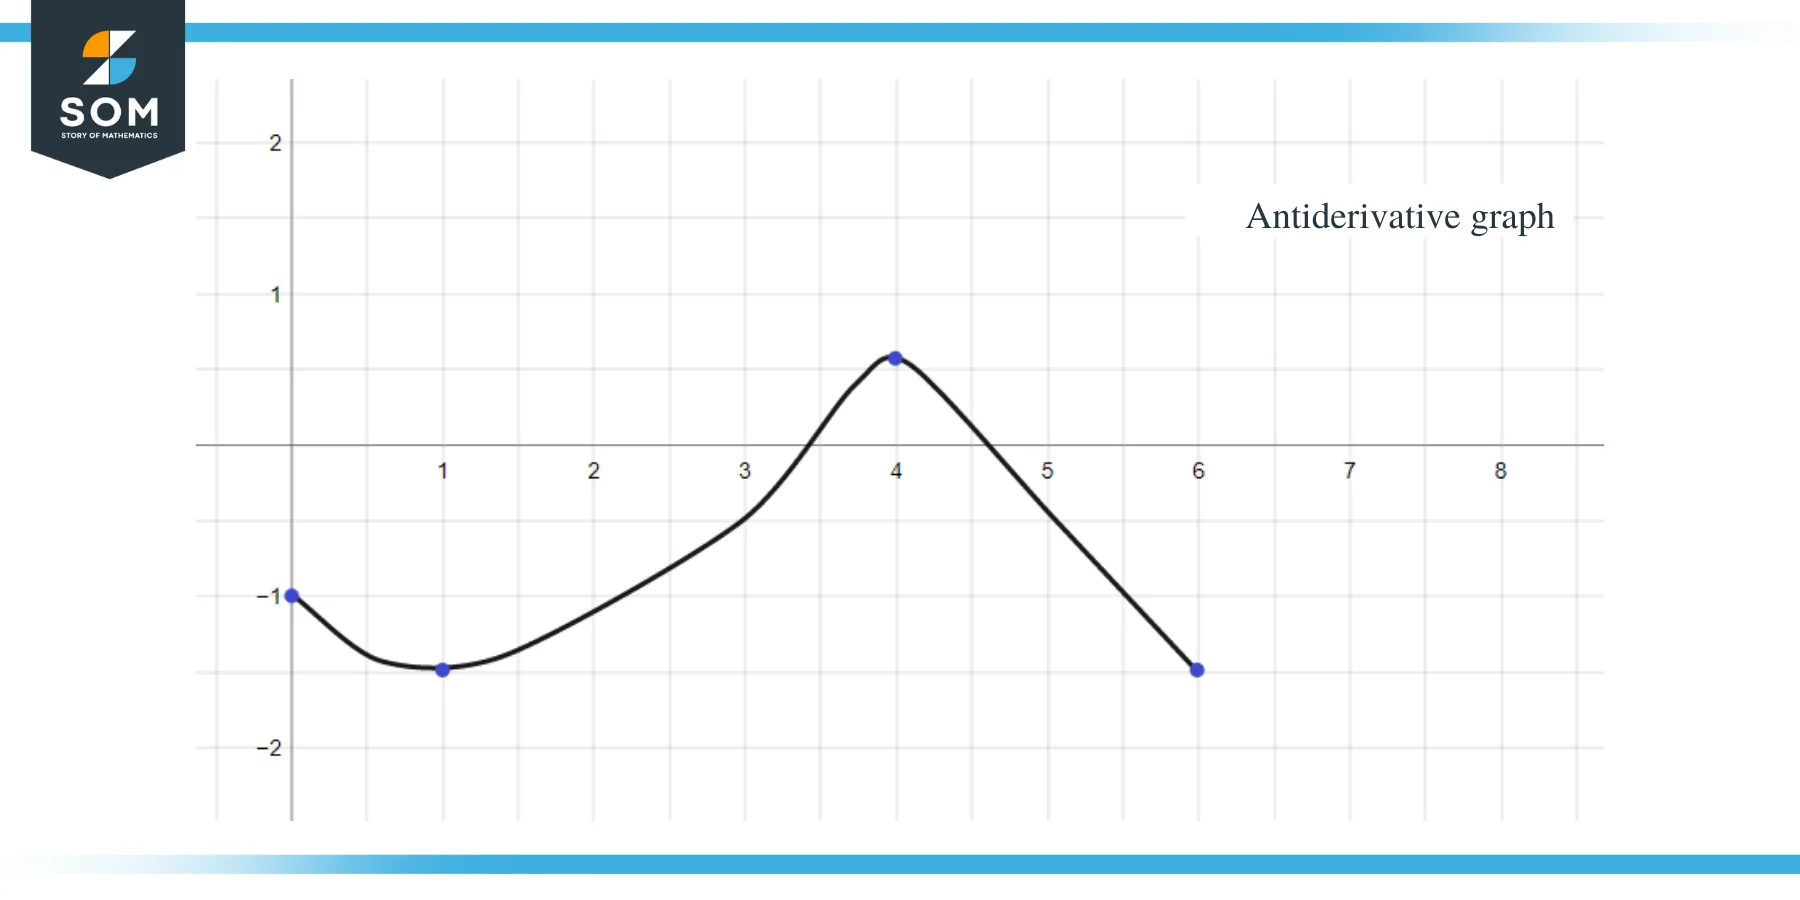
- The antiderivative graph will start at y = -1 as we are given $F(0) = -1$.
- If we go along the x-axis from the interval $[0, 1]$, we can see that “$f$” or “$F’$” is less than zero or negative, so the graph of F from 0 to 1 will be decreasing.
- When we go along the x-axis from the interval $[3, 4]$, the slope of the graph is negative but the value of that “f” or “$F’$” is greater than zero or positive, so the graph of F for this interval will be increasing.
- When we go along the x-axis from the interval $[4,6 ]$, we can see that “f” or “F’$” is less than zero or negative, so the graph of F for this interval will be decreasing.
- The value graph of $F’ (x)$ or f(x) is “0” at $x = 1$, $4$ and $6$, so these points will be critical points for the antiderivative graph, which means we will have our maxima and minima at these points. So in this case, we will total three critical points.
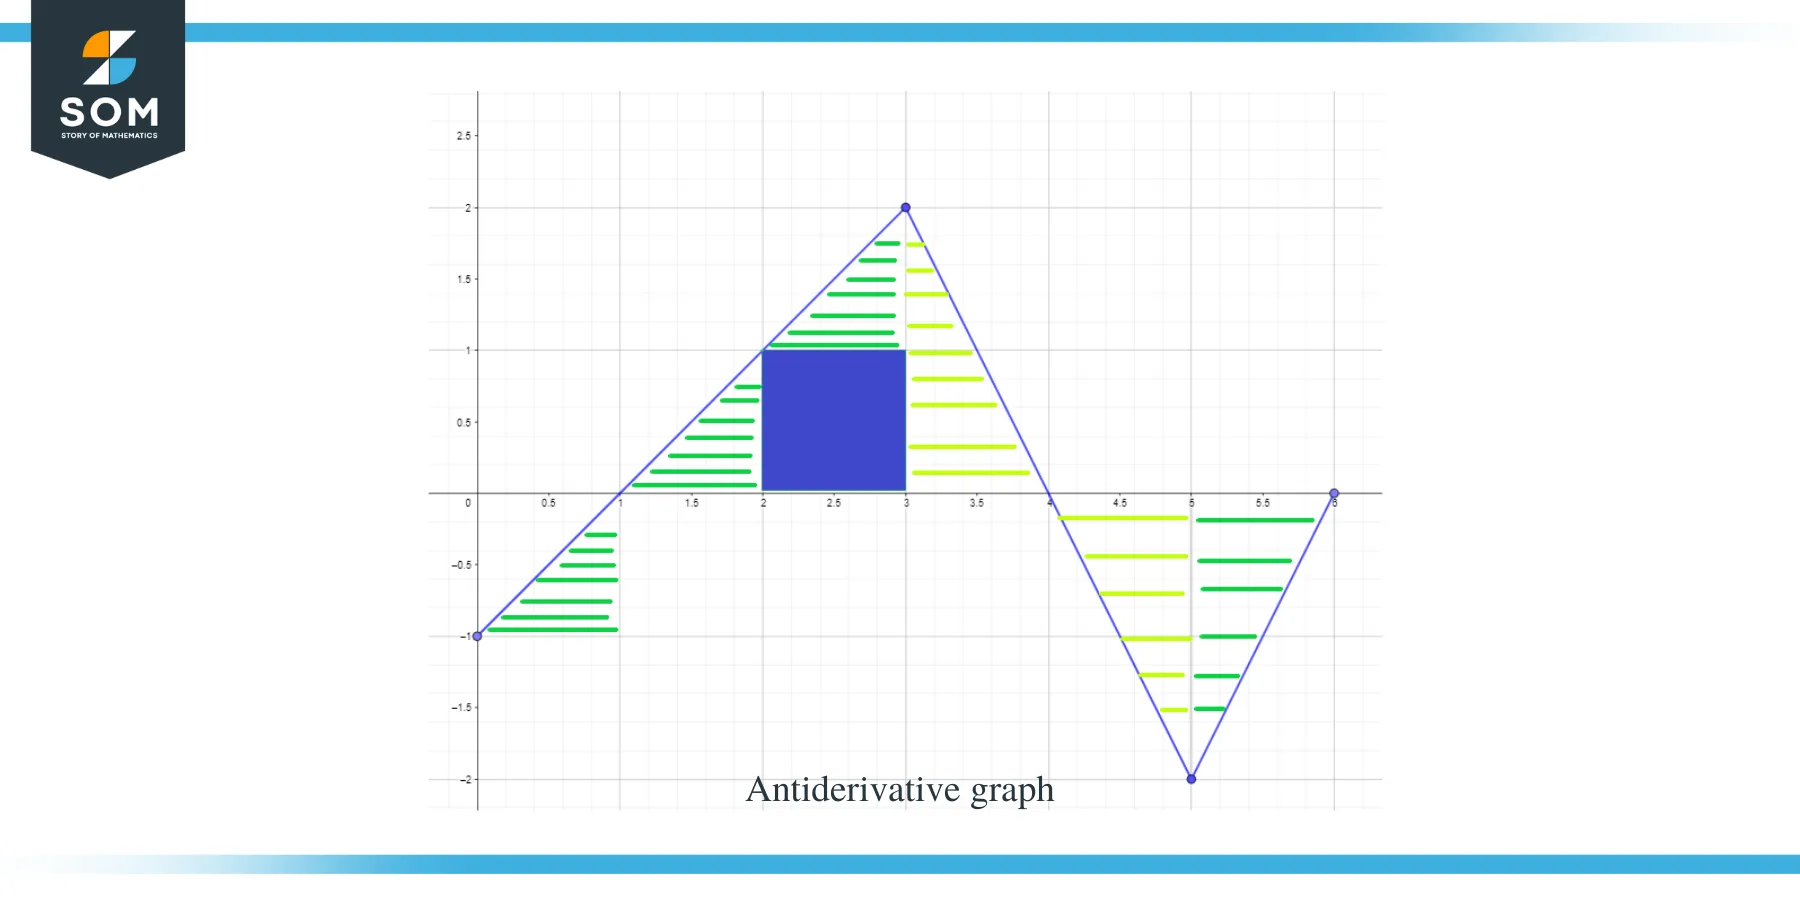
Now that we know the direction of the antiderivative graph as well as its maxima and minima points, let us now calculate the area under the curve for the given function so that we know the magnitude or value of the graph for the function F(x).
The area of the graph which needs to be calculated has been highlighted in the figure, and as you can see, we are mostly dealing with right-angle triangles along with 1 square region.
- The interval $[0,1]$ forms a right-angle triangle just like in the previous example, and the area for this region is $\dfrac{1}{2}$.
- For the interval $[1,2]$ a right angle triangle is formed. The base and height of the triangle have 1 unit each so the area of the triangle will be $= \dfrac{1}{2} \times 1 \times 1 = \dfrac{1}{2}$.
- For the interval $[2,3]$, a square is formed for the range or y-interval $[0,1]$ and a triangle is formed for the range or y-interval $[1, 2]$. The square is a unit square with each side equal to 1, so the area of the square will be $= 1 \times 1 = 1$ unit while the area of the triangle is $\dfrac{1}{2}$. So the total area of the region is $= 1 + \dfrac{1}{2} = \dfrac{3}{2}$.
- If we add the area of the interval $[1,2]$ and $[2,3]$, it gives us $\dfrac{1}{2} + \dfrac{3}{2} = 2$. We get the same result if we take the complete area under the curve for the interval $[1,3]$. This whole region is a right-angle triangle with a base and height equal to 2 units each, so if we take the area of the triangle, it will be $= \dfrac{1}{2} \times 2 \times 2 = 2$ units.
- For the interval $[3,4]$, a right angle triangle is being formed with a base of 2 units and height of 1 unit, so the area of this region will be $= \dfrac{1}{2} \times 1 \times 2 = 1$ unit.
- For the interval $[4,5]$, a right angle triangle is being formed with a base and height of 1 unit each, so the area of this region will be $= \dfrac{1}{2}$.
- For the interval $[5,6]$, a right angle triangle is being formed with a base and height of 1 unit each, so the area of this region will be $= \dfrac{1}{2}$.
By using all the above data, we can graph the antiderivative graph of the given function as:
The same rules which we have discussed so far can also be applied to piecewise constant functions. Finally, to finish the guide, here are several practice questions for you to check if you have fully grasped the concept.
Practice Questions:
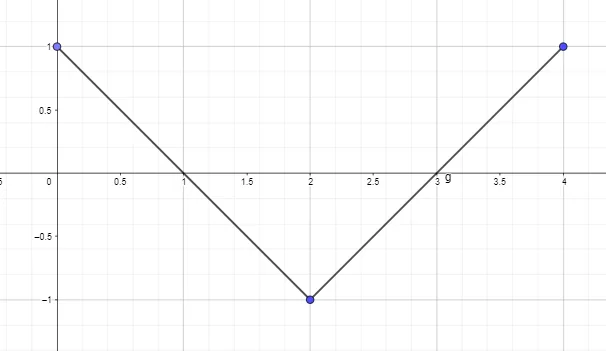
- Plot or Draw the antiderivative graph by using the derivative graph of the function given below such that F(0) = 0.
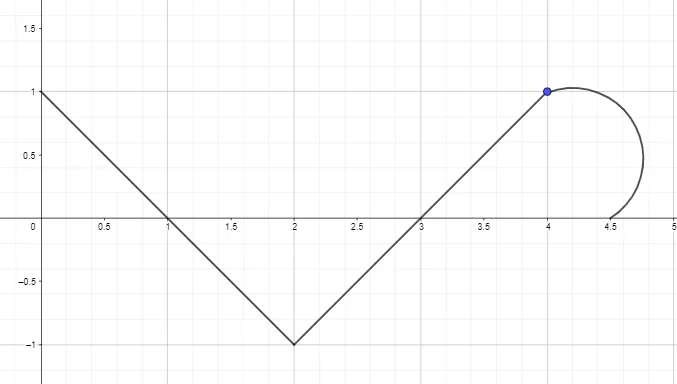
 2. Plot or Draw the antiderivative graph by using the derivative graph of the function given below such that F(0) = 0.
Answer Key:
1).
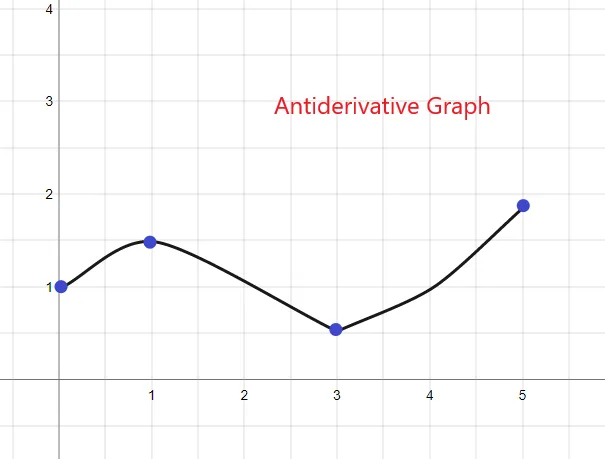
The antiderivative graph for the given f(x) will start at y = 1 as we are given F(0) = 1. The graph can be sketched as:
2).
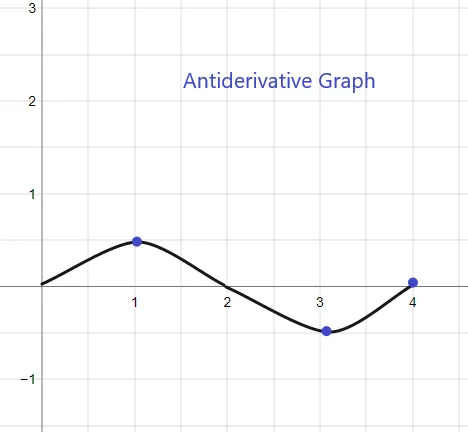
The antiderivative graph for the given f(x) will start at y = 0 as we are given F(0) = 0. The graph can be sketched as:
