JUMP TO TOPIC
 Learning how to complete the table of values is an important task in understanding functions and graphs. First of all, you have to identify the type of function you are given, whether it is a linear function or a non-linear function. Once you have identified the type of equation, the second step involves the creation of two columns “$x$” and “$y$”.
This article will provide you with a complete guideline on how to complete the table of values for different algebraic functions using numerical examples.
How To Complete Tables for Linear Equations
A linear function is basically a line graph that is expressed as a linear relation between “$x$” and “$y$”. For example, if we are given a linear relation $y = x$, this means that for each value of “$x$,” the relation has the exact same value of “$y$”. If the function is $y = 3x$, then it means that for each value of “$x$” the value of “$y$” will be three times greater.
After identifying the type of function and creating two columns, put the values of “$x$” in the left column and solve for the values of “$y$”, and fill in calculated values “$y%” in front of the corresponding values of “$x$” in the second column.
There is no table of values formula or table of values calculator available anywhere, so you will need to follow the steps mentioned below on how to complete a function table of values for a linear equation.
1. Step 1: Create a Table Having Two Columns “x” and “y”
The first step is to form a table like this:
| $x$ | $y$ |
2. Step 2: Put in the Desired Values of “x”
Suppose we were given the function $y = 2x +1$ and we want to calculate the function for the three different values of “$x$”. Let the values of “$x$” be 1,2,3 and 4.
| $x$ | $y$ |
| $1$ | |
| $2$ | |
| $3$ |
3. Step 3: Solve the Equation for the Values of “$x$”
The third step involves solving the function for the values of “$x$”.
For $x = 1$, $y = 2 (1) +1 = 3$
For $x = 2$, $y = 2 (2) + 1 = 5$
For $x = 3$, $y = 2 (3) + 1 = 7$
4. Step 4: Put in the Calculated Values of “y”
This step involves filling up the values in the second column.
| $x$ | $y$ |
| $1$ | $3$ |
| $2$ | $5$ |
| $3$ | $7$ |
5. Step 5: Plot the Points and Graph
The points on the coordinates can be plotted as:
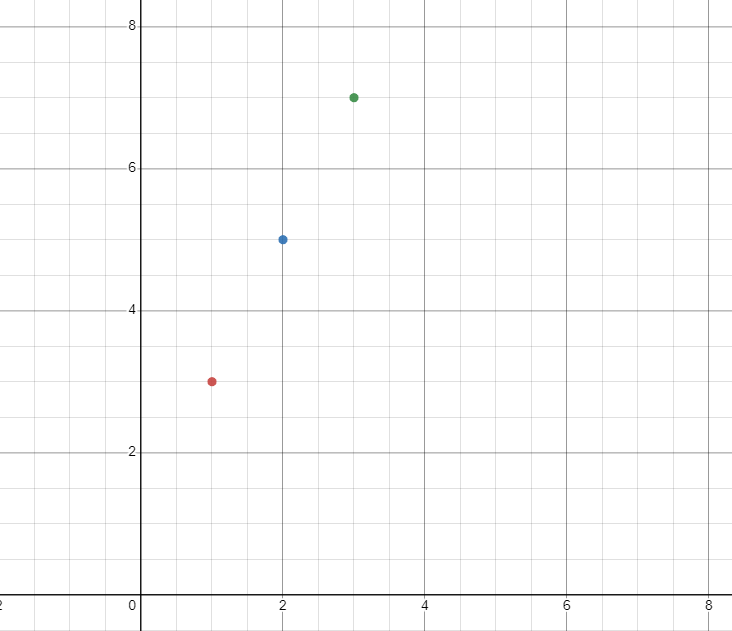
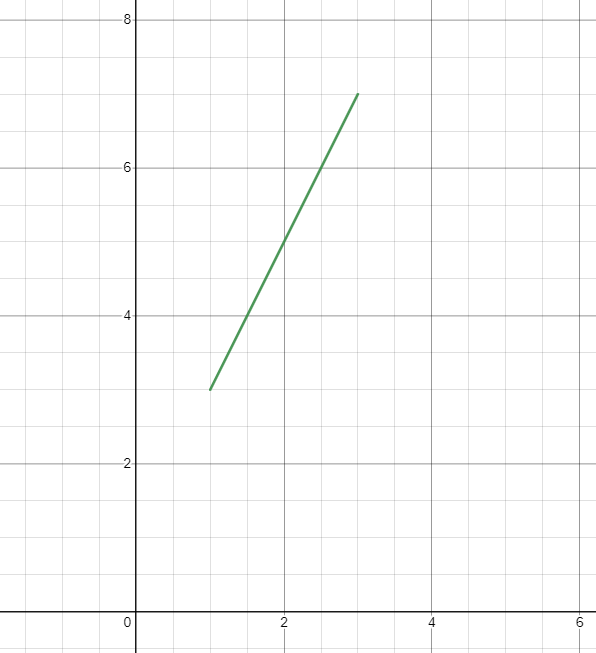
A graph can be made by joining the points.
Example 1
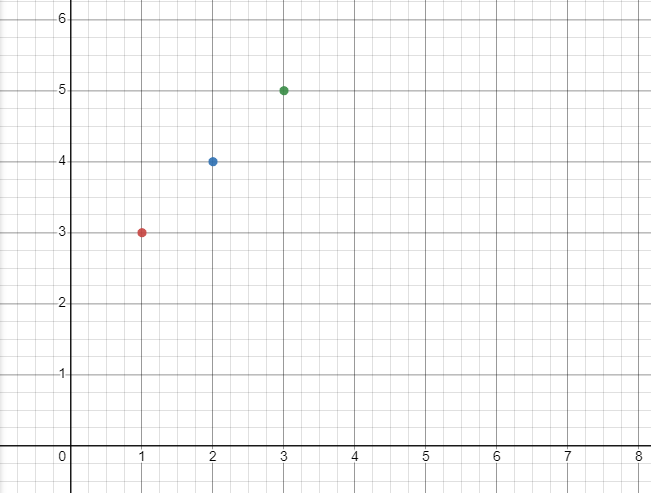
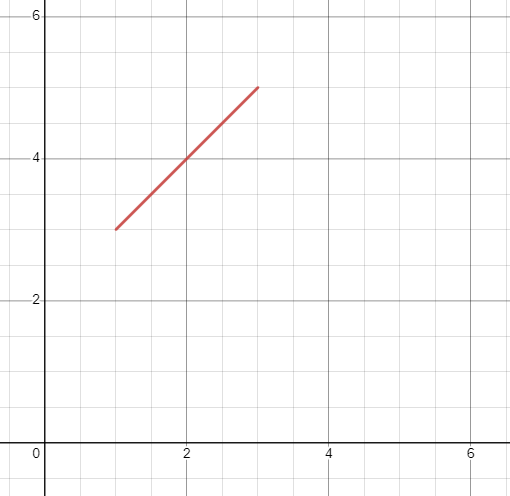
Complete the table for the equation $y = x +2$, for $x = 1,2,3$. Also plot the points and draw the graph.
| $x$ | Equation | $y$ |
| $1$ | $ (1) + 2 = 3$ | $3$ |
| $2$ | $ (2) + 2 = 4$ | $4$ |
| $3$ | $ (3) + 2$ | $5$ |
The points on the coordinate plane will be plotted as:
The table of values graph will look like this:
Example 2
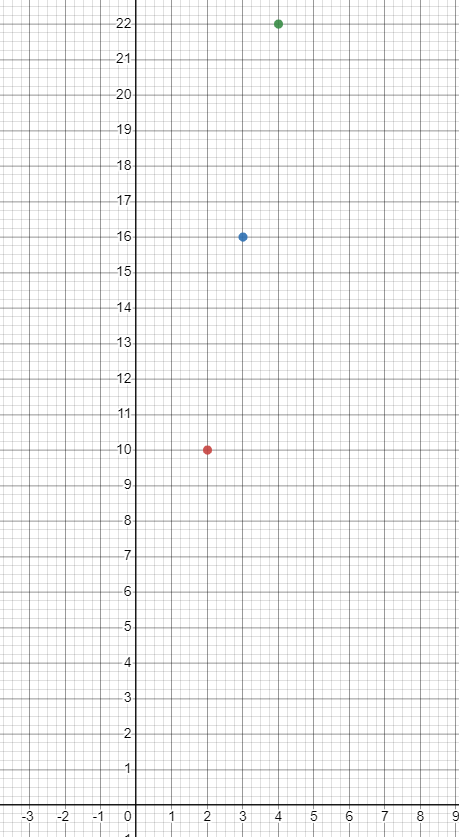
Complete the table for the equation $y = 6x -2$, for $x = 2,3,4$
| $x$ | Equation | $y$ |
| $2$ | $6(2) – 2 = 12 – 10 =10$ | $10$ |
| $3$ | $6(3) – 2 = 18 – 2 =16$ | $16$ |
| $4$ | $6(4) – 2 = 24 – 2 = 22$ | $22$ |
The points on the coordinate plane will be plotted as:
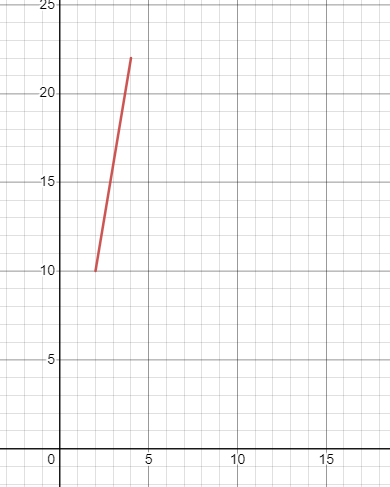
The corresponding graph will be:
Example 3
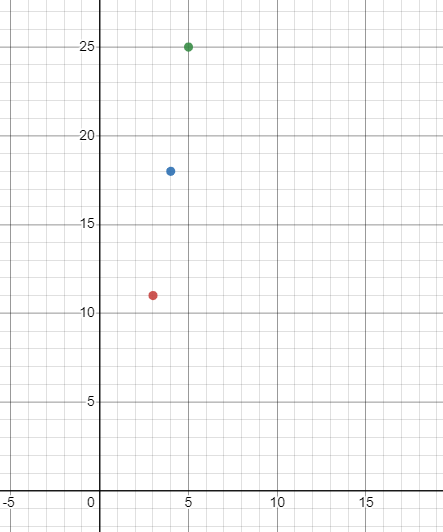
Complete the table for the equation $y = 7x -10$, for $x = 3,4,5$
| $x$ | Equation | $y$ |
| $3$ | $7(3) – 10 = 21- 10 = 11$ | $11$ |
| $4$ | $7(4) – 10 = 28 – 10 = 18$ | $18$ |
| $5$ | $7(5) – 10 = 35 -10 = 25$ | $25$ |
The points on the coordinate plane will be plotted as:
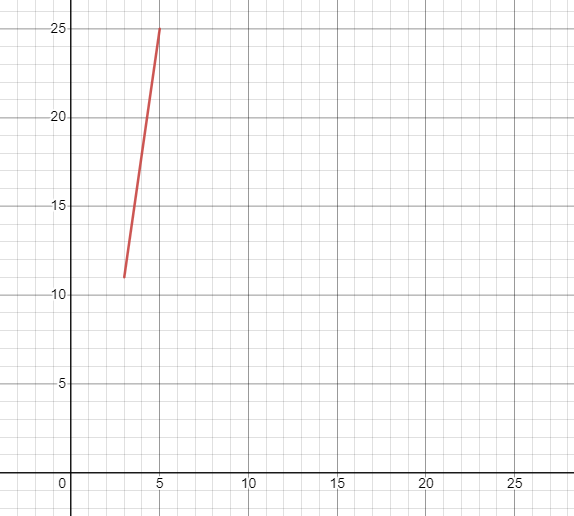
The corresponding graph will be:
How To Complete Tables for Quadratic Equations
A quadratic equation is a non-linear function with degree $2$, which means the highest power in the equation is $2$. The table of values can be completed for non-linear equations, but it becomes complex to solve cubic and higher equations, so we will keep this article limited to linear and quadratic equations.
For example, $y = 3x^{2}-2x +1$ is a quadratic equation.
The steps on how to make a table of values for the quadratic equation are given below.
1. Step 1: Write the Quadratic Equation
The first step is to write the quadratic equation in $ax^{2}+ bx + c$ in this form.
2. Step 2: Calculate the Vertex Points
The second step involves calculation of the vertex of the function in the form $(-\dfrac{b}{2a}, f(-\dfrac{b}{2a}) )$.
3. Step 3: Create the Table
The third step involves creating the table, where “$x$” is on the left column and “$y$” or $f(x)$ on the right column.
4. Step 4: Fill in the Table
This step involves filling up the values in both columns. The values of “$x$” depend on the calculation of the vertex points. We take two values on the left and two on the right in reference to the vertex point, and from the generated values of “$x$” we can calculate the values of “$y$”.
5. Step 5: Plot the Points and Draw the Graph
Example 4
Complete the table for the function $f(x) = x^{2}-8x + 10$.
Solution
We are given the equation $f(x) = y = x^{2}-8x + 10$, here $a =1$, $b = -5$ and $c = 10$
We have to find the values of the vertex for the given function. The value of “$x$” for the vertex will be:
$x = -\dfrac{b}{2a}$
$x = -\dfrac{-8}{2 (1)}$
$x = \dfrac{8}{2} = 4$
Plugging in this value to calculate $f(x)$
$f(8) = 4^{2}- 8 (4) + 16 = 16 – 32 +10 = -6$
So, the vertex for the function is $(4, -6)$.
Now let us create the table and fill in the values of $x$. We will take two values on the left and two values on the right of the “$x$” value of the vertex and then solve for the value of “$y$” for each value. The “$x$” value of the vertex is “$4$”, so we place “$ 2, 3$” as the left values and “$5,6$” as the right values of “$x$”.
| $x$ | $f(x) = x^{2}-8x + 10$ | $y$ |
| $2$ | $2^{2}- 8 (2) + 10 = -2$ | $-2$ |
| $3$ | $3^{2}- 8 (3) + 10 = -5$ | $-5$ |
| $4$ | $4^{2}- 8 (4) + 10 = – 6$ | $-6$ |
| $5$ | $5^{2}- 8 (5) + 10 = -5$ | $-5$ |
| $6$ | $6^{2}- 8 (6) + 10 = -2$ | $-2$ |
The next step is to plot the given values.
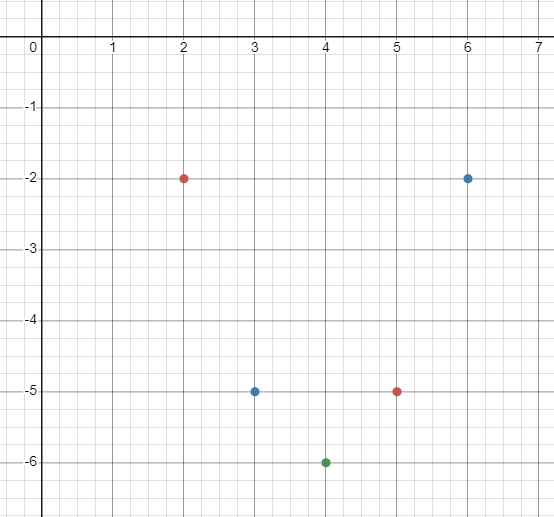
You will see that a bell-shaped graph will be formed by combining the points.
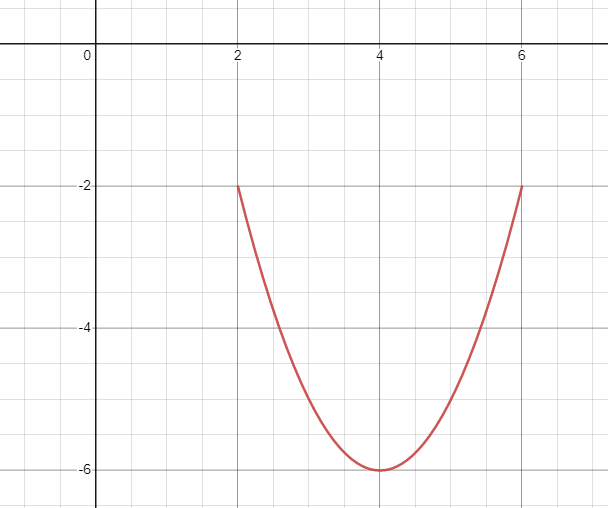
Example 5:
Complete the table for the function $f(x) = 2x^{2}- x – 15$.
Solution
We are given the equation $f(x) = y = 2x^{2}+ x – 15$, here $a = 2$, $b = 1$ and $c = -15$
We have to find the values of the vertex for the given function. The value of “$x$” for the vertex will be:
$x = -\dfrac{-1}{2a}$
$x = -\dfrac{-1}{2 (2)}$
$x = \dfrac{1}{4}$
Plugging in this value to calculate $f(x)$
$f(-\dfrac{1}{2}) = 2(\dfrac{1}{4})^{2} – (\dfrac{1}{4}) – 15 = \dfrac{1}{8}- \dfrac{1}{4}- 15 = – \dfrac{121}{8} $
So, the vertex for the function is $( \dfrac{1}{4}, – \dfrac{121}{8} )$.
Now let us create the table and fill in the values of $x$. We will take two values on the left and two values on the right of the “$x$”. To obtain the first value on the left, we subtract “$x$” value of the vertex with $-1$ and to obtain the second value on the left we subtract the vertex value with $-2$.
Similarly, to obtain the right side values we add the “$x$” of the vertex with $+1$ and $+2$. Once we have obtained the values of “$x$”, we will use the values to calculate the values of “$y$” and complete the table accordingly.
| $x$ | $f(x) = x^{2}-8x + 10$ | $y$ |
| $- \dfrac{7}{4}$ | $2(-\dfrac{7}{4})^{2}- (-\dfrac{7}{2}) – 15 = -\dfrac{57}{8}$ | $-\dfrac{57}{8}$ |
| $- \dfrac{3}{4}$ | $ 2(-\dfrac{3}{4})^{2}- (-\dfrac{3}{4}) – 15 = -\dfrac{105}{8}$ | $- \dfrac{105}{8}$ |
| $\dfrac{1}{4}$ | $ 2(\dfrac{1}{4})^{2}- (\dfrac{1}{4}) – 15 = -\dfrac{121}{8}$ | $- \dfrac{121}{8}$ |
| $\dfrac{5}{4}$ | $ 2(\dfrac{5}{4})^{2}- (\dfrac{5}{4}) – 15 = -\dfrac{57}{8}$ | $- \dfrac{105}{8}$ |
| $\dfrac{9}{4}$ | $ 2(\dfrac{9}{4})^{2}- (\dfrac{9}{4}) – 15 = -\dfrac{57}{8}$ | $- \dfrac{57}{8}$ |
The next step is to plot the points on the coordinates.
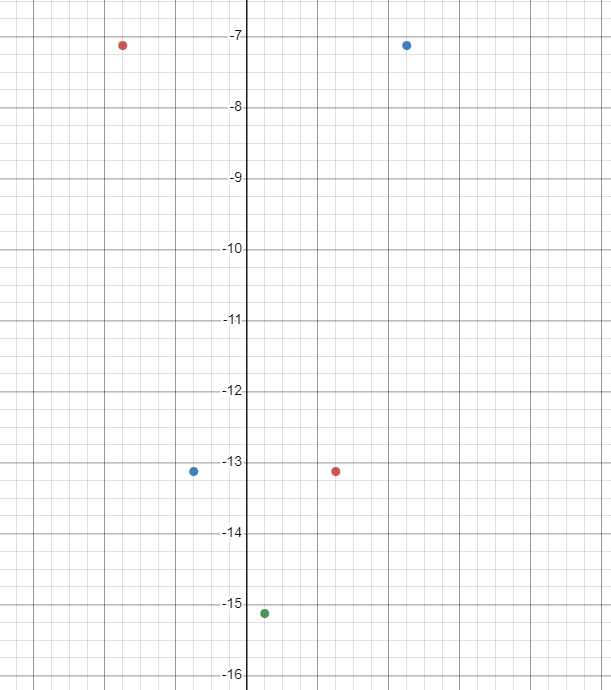
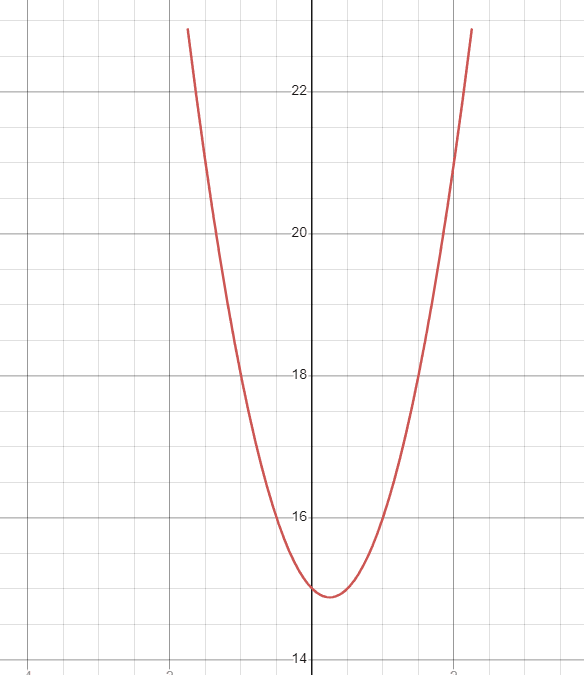
Now join all the points to form the graph.
How To Write Linear Equation From Table of Values
You can also write a linear equation by using the table of values. It is the opposite process of the completion of table values. In this case, we are provided with the values of “$x$” and “$y$” and we will use these values to develop the equation of the line $y = mx + b$.
The first step involves calculation of slope “$m$” by using the formula $m = \dfrac{y_2 – y_1}{x_2 – x_1}$. In the next step, we use the values “$x$”, “$y$” and “$m$” to calculate the value of “$b$”. In the last step, we plug in the values to get the final equation.
Let us develop the linear equation for the table given below.
| $x$ | $y$ |
| $4$ | $3$ |
| $8$ | $0$ |
| $12$ | $-3$ |
First, we will calculate the slope $m$
$m = \dfrac{y_2 – y_1}{x_2 – x_1}$
We can take any two consecutive values of “$x$” and “$y$”
Let us take $x_1 = 4$, $x_2 = 8$, $y_1 = 3$ and $y_2 = 0$
$m = \dfrac{0 – 3}{8 – 4}= -\dfrac{3}{4}$
Putting this value of “$m$” in the line equation $y = mx + b$
$y = -\dfrac{2}{3}x + b$
We can now put any value of “$x$” and its corresponding value of “$y$” to calculate the value of “$b$”.
$4 = -\dfrac{2}{3}(3) + b$
$4 = -2 + b$
$b = 6$
So the final equation is $y = -\dfrac{2}{3}x + 6$.
Conclusion
Using the information that you obtained through this guide, let us recap the main points one last time:
- Identify the given function to determine whether it is linear or quadratic.
- Draw a table having two columns with “x” and “y”.
- Put in the desired values of “x” for which you want to solve the equation.
- Fill in the table with the calculated values of “y” in the previous step.
- Form the calculated values of “y” from the graph.
