To find an exponential function from a graph, I first identify the key components of the graph, like the horizontal asymptote, which can indicate the value of ( k ).
This value helps discern the vertical shift from the graph’s simplest form. Understanding the graph of an exponential function is pivotal because it tells us how the function behaves, whether it’s increasing or decreasing, and helps us gauge the function‘s growth or decay rate.

Next, I look for two points with exact coordinates, typically where the function crosses the x-axis and another distinct point on the graph.
These points provide specific values that enable me to solve for the parameters ( a ) and ( b ) in the exponential function‘s equation of the form $f(x) = ab^x $.
With these components, I piece together a complete representation of the exponential function. It’s quite like assembling a puzzle – methodical and precise, leading to a clear picture of the mathematical relationship depicted.
In learning the steps to represent this type of function, I find myself equipped to explore various realms of applications, from compound interest to population growth, all rooted in the power of exponential relationships.
And who knows, as we plot our course through the graph, we might just unveil more than a set of coordinates – but a story of growth and change.
Identifying Exponential Functions on Graphs
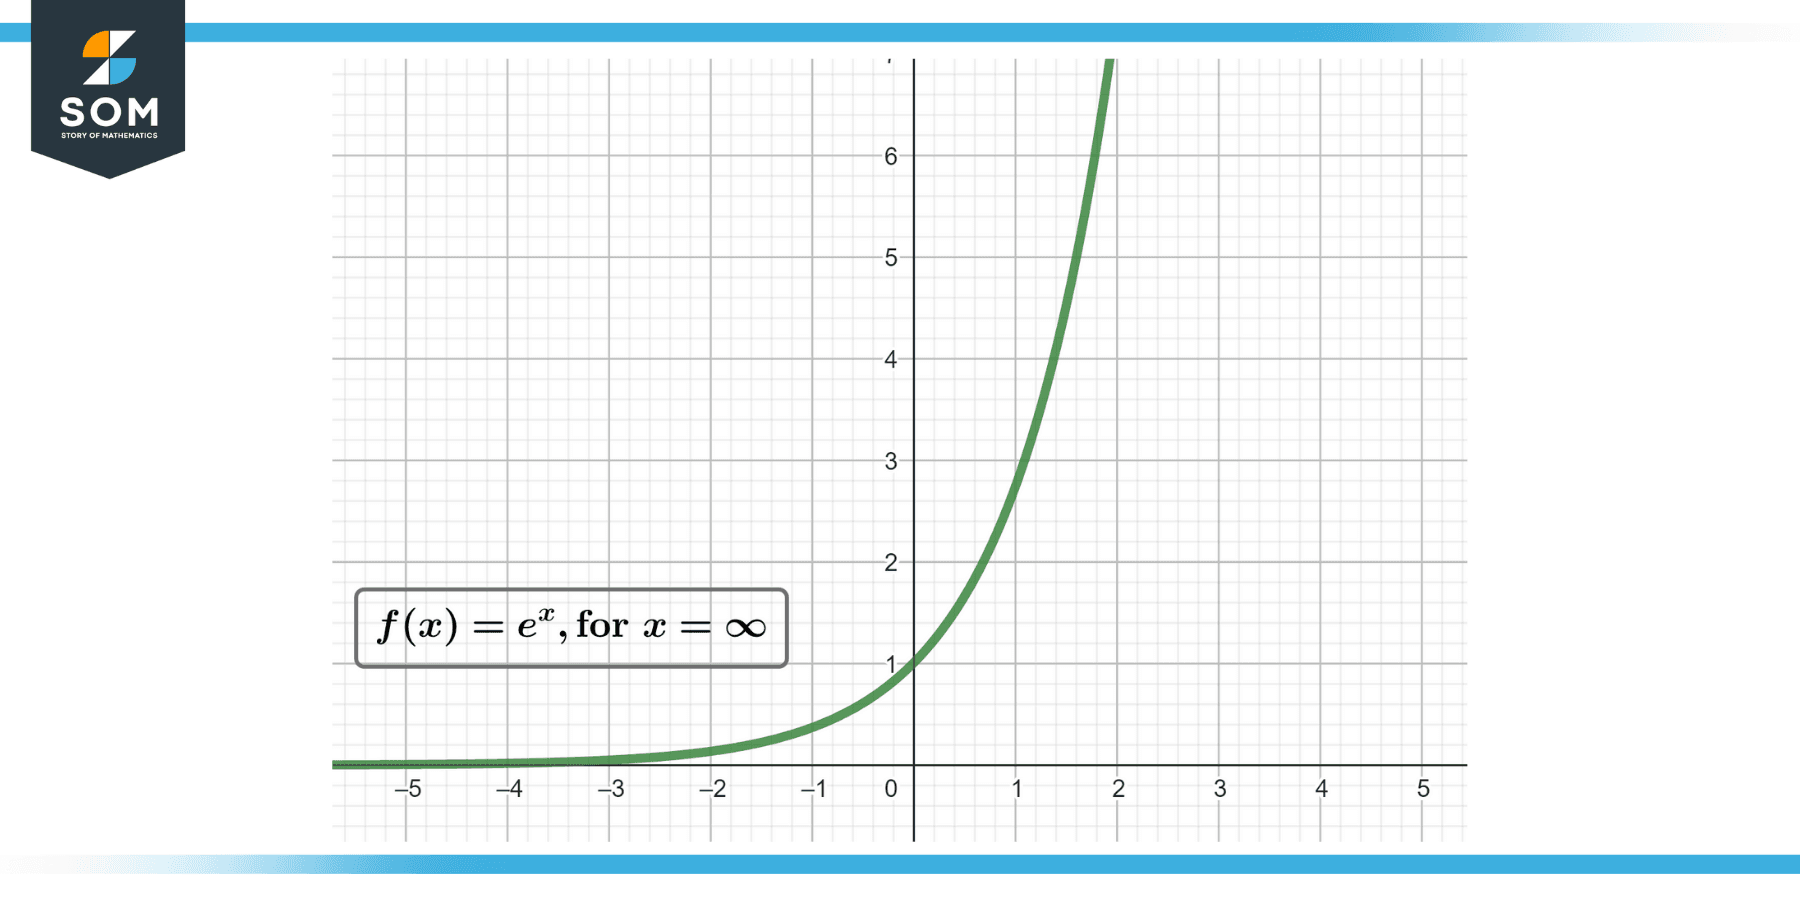
When identifying exponential functions on graphs, I first look for a distinctive curve rather than a straight line, which indicates exponential behavior, whether it’s growth or decay.

Here’s what I focus on:
Y-intercept: This is where the graph crosses the y-axis. The exponential function is typically in the form of ($f(x) = ab^x$), where (a) is the y-intercept.
Horizontal Asymptote: As x approaches infinity, the curve approaches a line. This line is never touched or crossed, which shows the function’s limit.
Slope: Unlike linear functions, the slope of an exponential function is not constant. It changes at every point of the graph. The slope is positive for exponential growth and negative for exponential decay.
Domain and Range: The domain of an exponential function is all real numbers. However, for growth, the range is (y > 0); for decay, it’s (y < a), assuming (a) is the y-intercept.
Axis: The horizontal asymptote often lies along the x-axis, but it can shift based on the equation.
Increase and Decrease: For an exponential growth function, the values increase as x increases. In exponential decay, the values decrease.
Real-world applications of exponential functions include population growth, radioactive decay, and financial predictions. Such applications rely on the characteristically rapid increase or decrease shown by the curve’s slope. When using these functions for predictions, it’s important to consider the impact of various factors on the domain and range.
For a visual summary, consider the following table:
| Feature | Exponential Growth | Exponential Decay |
|---|---|---|
| Direction of the Curve | Upward | Downward |
| Y-intercept | (a > 0) | (a > 0) |
| Horizontal Asymptote | (y = 0) | (y = 0) |
| Slope | Increasing | Decreasing |
| Domain | All real numbers | All real numbers |
| Range | (y > 0) | (y < a) |
By understanding these characteristics, I can recognize exponential functions and differentiate them from other function types.
Calculating and Plotting Exponential Functions
When I come across a graph and need to find the corresponding exponential equation, my first step is to identify two key features: the initial value and the constant ratio.
The initial value is the y-intercept of the graph, while the constant ratio determines how steeply the graph curves upward or downward.
The general form of an exponential function is $y = ab^x$, where (a) is the initial value and (b) is the base, representing the constant ratio.
To calculate the exponential function, I start by setting up a table of values. I select points with coordinates ((x, y)) that are clear on the graph. At least one of these points should be the y-intercept, which is where the graph crosses the y-axis. This gives me the initial value, which is (a) in the equation.
Next, I look for another point on the graph to determine the base, (b). If I pick the point with coordinates (1, (y)), then (y) will be equal to $ab^1$, which simplifies to (ab), allowing me to solve for (b) since I already know (a).
Additionally, I must be aware of any transformations. If the graph has been shifted up or down (vertical translation), left or right (horizontal translation), or stretched vertically (represented by a vertical stretch factor), I’ll adjust the equation accordingly to reflect these changes.
The horizontal shift is represented as (c) and the vertical shift as (d) in the transformed equation: $y = ab^{(x-c)} + d$.
Lastly, I plot the points from my table onto a coordinate grid and draw a smooth curve through them, ensuring that it approaches but never touches the horizontal asymptote, typically the x-axis, unless there has been a vertical shift.
| x-value | y-value |
|---|---|
| 0 | a |
| 1 | ab |
Conclusion
In this guide, I’ve shown you the essential steps to determine an exponential function from its graphical representation. Remember, identifying the horizontal asymptote is crucial to finding the vertical shift and subsequently the value of $k$.
With the correct value of $k$, you’ve set the stage for fleshing out the rest of the function.
Next, the growth factor, indicated by $b$, and the initial value, represented by $a$, are found by examining distinct points on the graph.
More specifically, $b$ is determined from the rate of growth or decay, ensuring $b>0$ and $b \neq 1$, while $a$ is derived from the function’s value when $x = 0$. I urge you to practice with a variety of graphs to become adept at writing functions quickly and correctly.
Writing exponential functions from their graphs is a skill that can be mastered with diligence and by paying attention to the details I’ve outlined.
Approach each graph with a systematic analysis, hunting down $a$, $b$, and $k$, and remember that practice makes perfect.
Whether you’re working on homework or curious about mathematical functions, I hope this information serves you well. Keep practicing, and you’ll find that identifying these functions becomes second nature.