Is a horizontal line a function? This article delves into this query, exploring the foundational definition of a function and how horizontal lines fit (or don’t fit) within that framework. Join us on this journey as we unravel the nuances of functions, lines, and the intricate dance between algebraic and geometric representations.
Is a Horizontal Line a Function?
Yes, a horizontal line is a function, because, a horizontal line passes the vertical line test, and any vertical line will intersect at most once, therefore, it can be concluded that a horizontal line does represent a function.
The question “Is a horizontal line a function?” can also be answered by recalling the definition of a function in relation to the vertical line test.
Definition of a Function
A relation between a set of inputs and a set of possible outputs is called a function if each input is related to exactly one output.
Vertical Line Test
A graph in the coordinate plane represents a function if and only if no vertical line intersects the graph at more than one point.
Horizontal Line
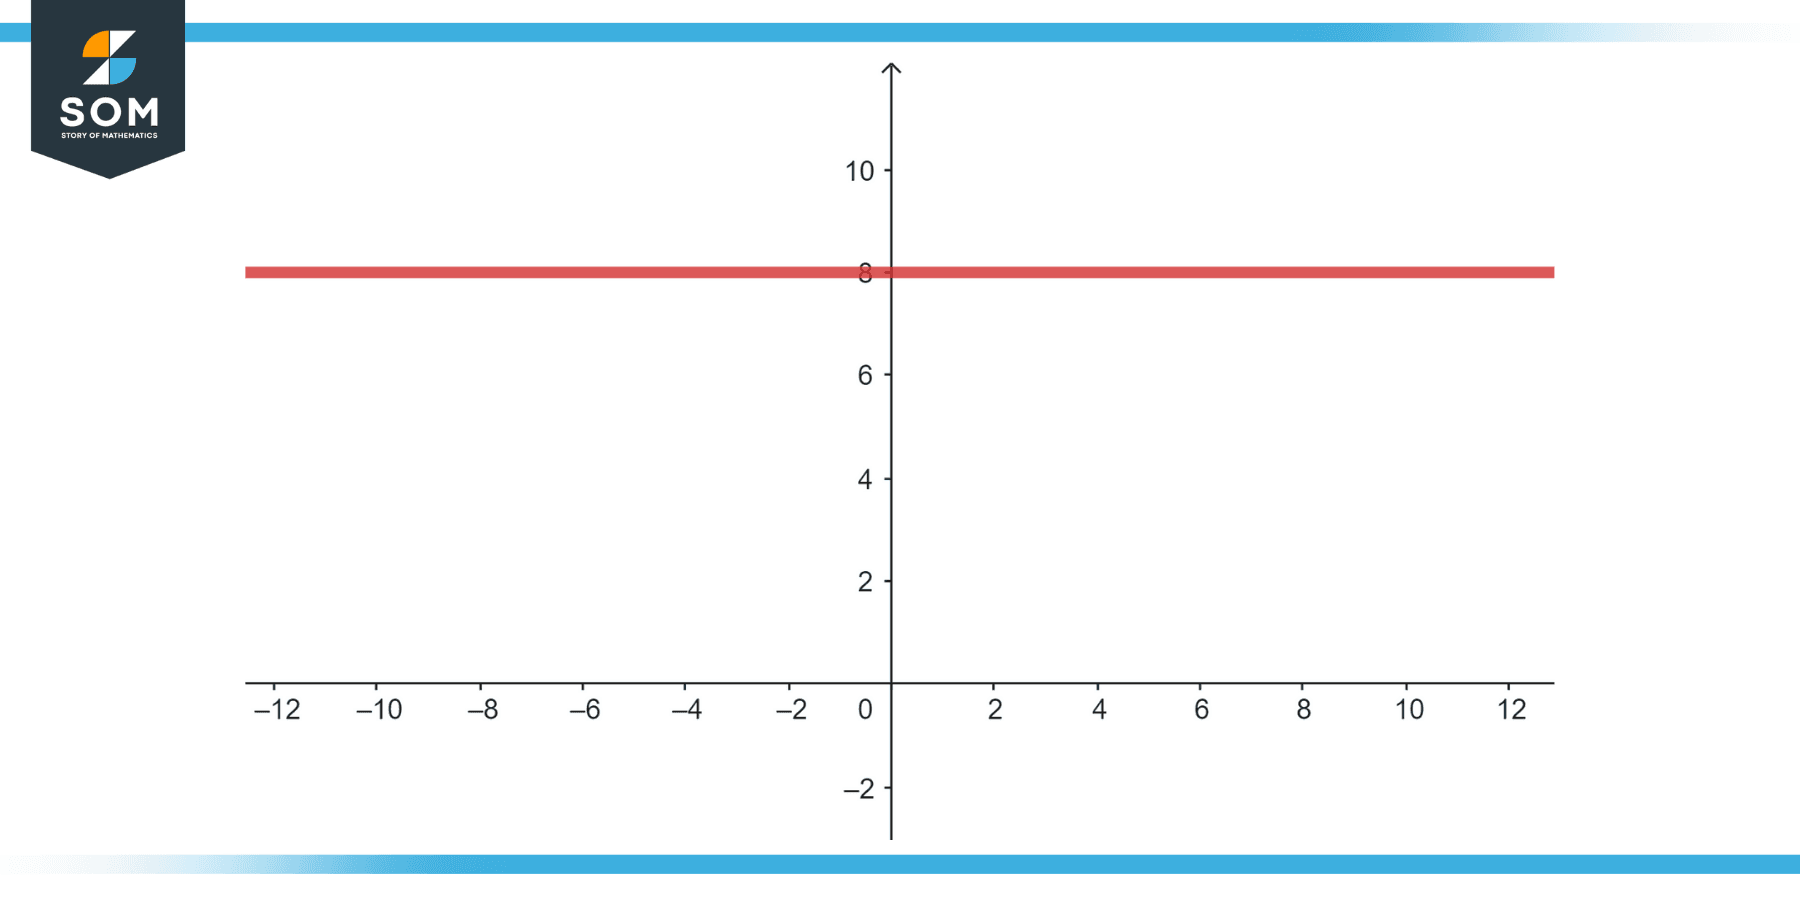
A horizontal line is of the form y = c where c is a constant. This means that for any value of x, y remains constant.

Figure-1.
Given the above definitions, we can conclude that:
A horizontal line passes the vertical line test because any vertical line will intersect at most once. Therefore, a horizontal line does represent a function.
Properties
When examining the statement “is a horizontal line a function,” there are several key properties and implications to explore:
Definition of a Horizontal Line
- A horizontal line is a straight line that runs from left to right on the coordinate plane. Its equation is of the form y = c, where c is a constant. This means that no matter the x-value, the y-value remains consistent and equal to c.
Vertical Line Test
- A graphical representation is that of a function if no vertical line intersects the graph more than once. A horizontal line meets this criterion, as any vertical line drawn will touch the horizontal line at exactly one point.
Function Mapping
- A function maps each input to exactly one output. In the context of a horizontal line, every x-value (input) maps to one consistent y-value (output), which is the constant c. This one-to-one mapping reinforces that a horizontal line is a function.
Slope and Rate of Change
- The slope of a horizontal line is 0, indicating that there is no rate of change in the y-values as x changes. This constant behavior is characteristic of horizontal lines.
Domain and Range
- Domain: The set of all possible x-values. For a horizontal line, the domain is all real numbers (−∞,∞), as the line extends indefinitely in both the left and right directions.
- Range: The set of all possible y-values. For a horizontal line with the equation y=c, the range is just the single value c, as the y-value does not change.
Intercepts
- X-Intercept: A horizontal line doesn’t have an x-intercept unless the line coincides with the x-axis. In that case, the x-intercept is all real numbers.
- Y-Intercept: The y-intercept of a horizontal line is the point where it crosses the y-axis, which will always be c, the constant y-value of the line.
Relation to Horizontal Asymptotes
- While a horizontal line is a function, it can also serve as a horizontal asymptote for other functions. A horizontal asymptote provides a boundary that certain functions approach but may never touch as the input approaches infinity or negative infinity.
Uniqueness in Graphs
- In the context of function graphs, a horizontal line is unique in that it’s one of the few linear forms where every input (from negative to positive infinity) corresponds to a singular output.
In conclusion, a horizontal line exhibits unique qualities that distinguish it from other linear forms on the coordinate plane and embodies the fundamental requirements of a function. From algebra through calculus, understanding these qualities is essential since it helps to comprehend the behavior and features of diverse functions.
Exercise
Example 1
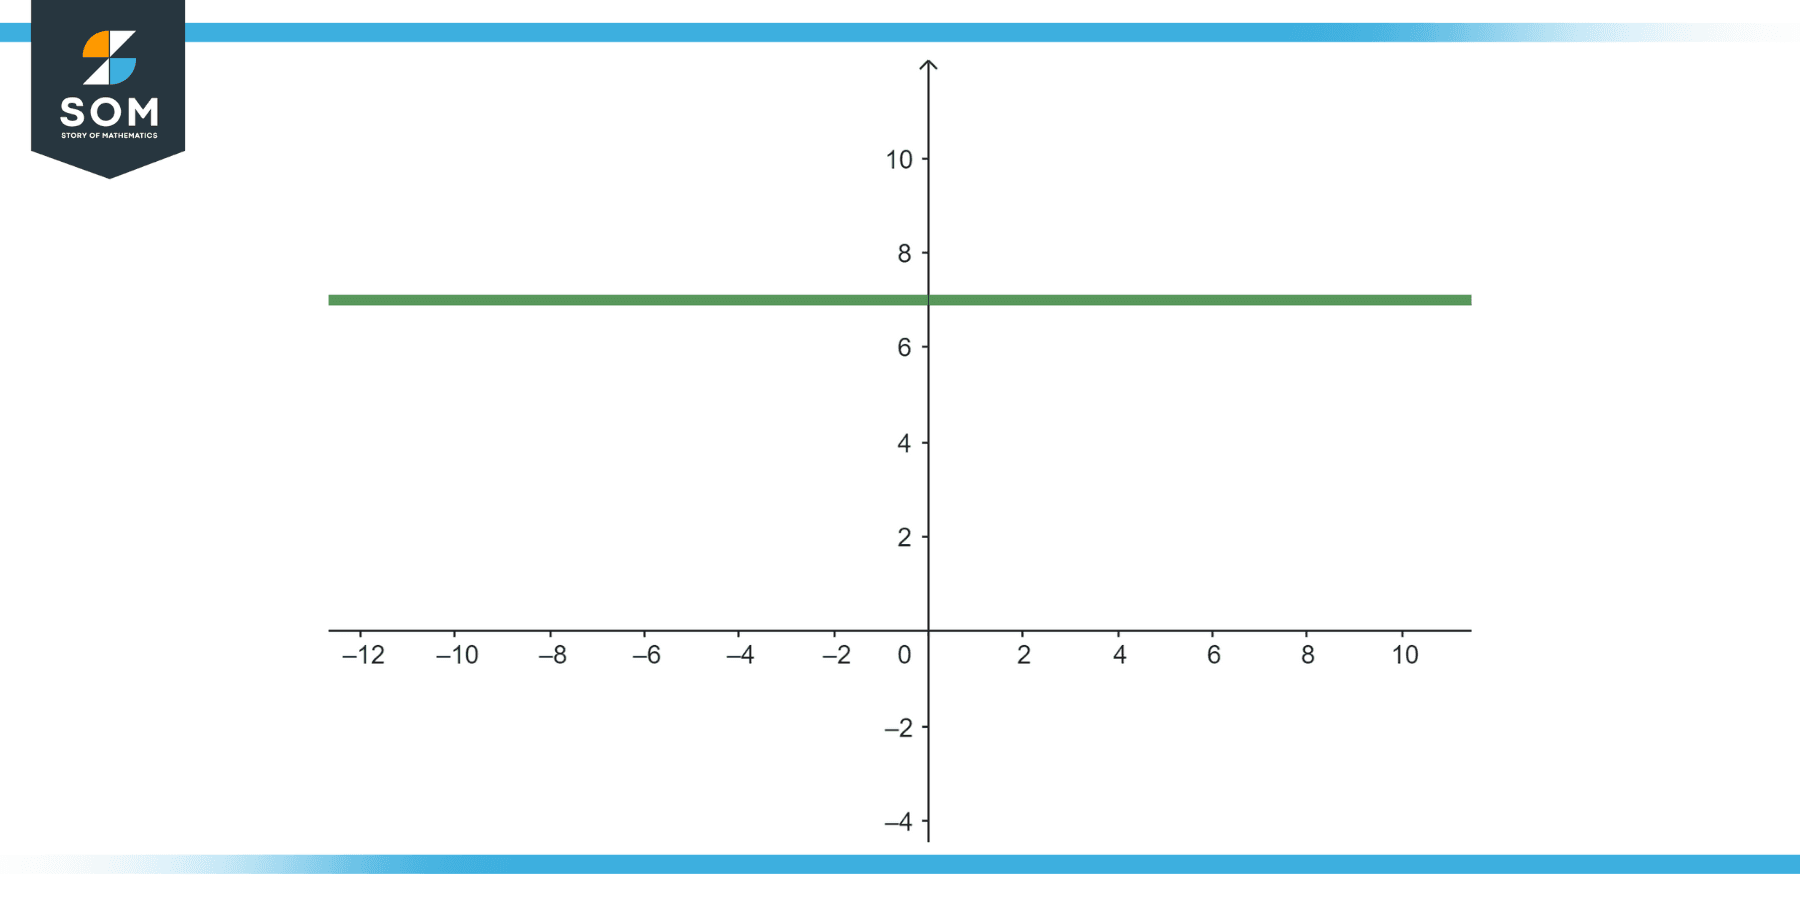
Given Equation
y = 7

Figure-2.
Solution
This equation represents a horizontal line where the y-value is always 7, regardless of the x-value. No matter which x-value you pick, y will always be 7, thus it passes the vertical line test and is a function.
Example 2
Finding the Slope
Given the points A = (2, 5) and B = (6, 5)
Solution
Slope:
m = (y2 − y1)/(x2 − x1) = (5 − 5)/(6 − 2) = 0/4 = 0
A slope of 0 indicates a horizontal line. Since all horizontal lines are functions, the line passing through these points is a function.
Example 3
Graphical Representation
Suppose you have a graph with a horizontal line passing through y =−3.
Solution
Drawing vertical lines at any x-value on the coordinate plane will show that each vertical line touches the horizontal line at exactly one point, verifying it as a function.
Example 4
Inequalities
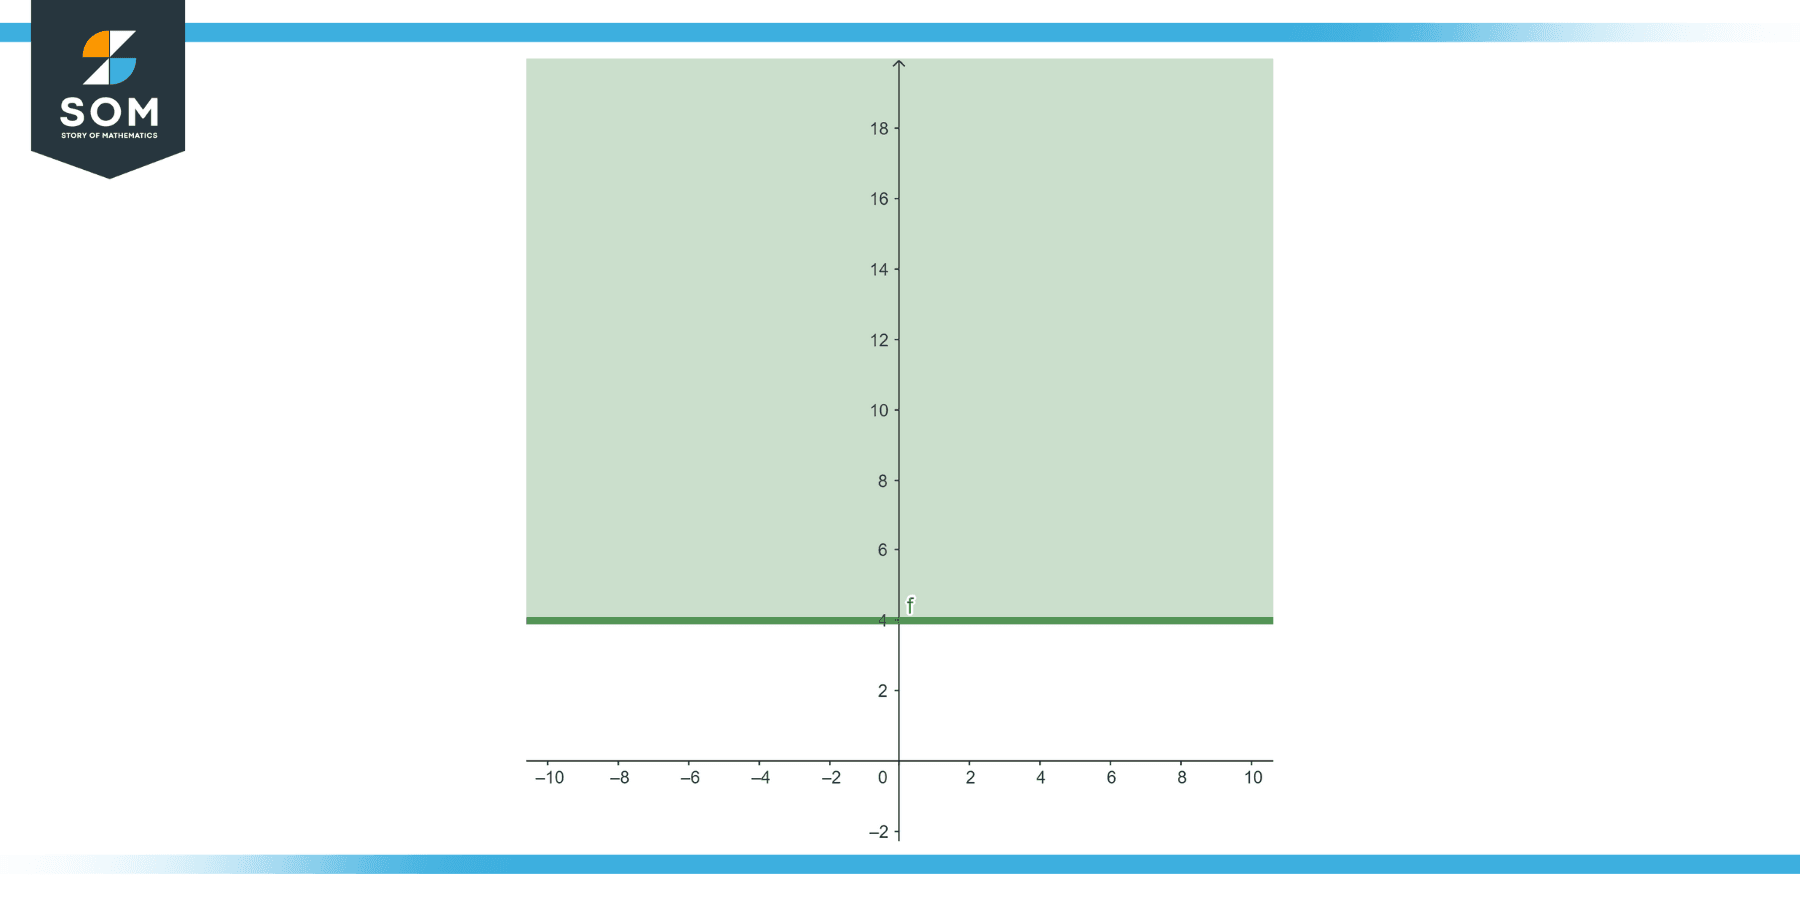
Given the inequality y ≥ 4

Figure-3.
Solution
The boundary line here is y=4, a horizontal line. As previously demonstrated, this line is a function.
Example 5
Mapping Diagram
Consider a set of ordered pairs: {(1, 6), (2, 6), (3, 6), (4, 6)}
Solution
Each x-value maps to the same y-value, 6. This is a representation of a horizontal line and is thus a function.
Example 6
Function Notation
Given: f(x) = 9
Solution
No matter the input value of x, the output will always be 9. This is an example of a horizontal line as a function.
Example 7
Domain and Range
Consider a horizontal line passing through y = 2.
Solution
Domain: x can be any real number (−∞, ∞).
Range: y is always 2.
The line is still a function since every x-value corresponds to a single y-value.
Example 8
Intercepts
Suppose you have the horizontal line represented by the equation y = 0.
Solution
This line is also the x-axis. It’s a function with a y-intercept at the origin (0,0) and has every real number as its x-intercept.
Applications
Mathematics
- Calculus: Horizontal lines are often encountered when determining horizontal asymptotes of functions. A horizontal asymptote indicates the behavior of a function as the input approaches positive or negative infinity.
- Linear Algebra: The concept of linear independence and vector spaces might touch upon horizontal lines when discussing the geometry of solutions.
Physics
- Kinematics: A horizontal line on a distance-time graph indicates that an object is stationary. Similarly, on a velocity-time graph, it indicates constant velocity.
- Statics: In beam and truss problems, horizontal lines can represent equilibrium conditions where forces are balanced, and there’s no net vertical movement.
Economics
- Supply and Demand: In economic graphs, a perfectly inelastic demand or supply curve is represented as a horizontal line, indicating that quantity demanded or supplied doesn’t change regardless of price.
- Break-even Analysis: A horizontal line can represent constant costs in a cost-revenue graph.
Biology
- Population Studies: A horizontal line on a population growth graph can signify that a population has reached its carrying capacity and isn’t growing nor declining.
Computer Graphics
- Raster Graphics: Horizontal line algorithms are fundamental in computer graphics, especially in rasterization processes. Efficiently drawing horizontal lines can be essential for screen rendering.
Medicine
- Heart Rate and ECG: In an electrocardiogram (ECG) reading, a horizontal line might indicate a flatline, representing a lack of heart electrical activity.
Geography and Earth Sciences
- Topographic Maps: On a topographic or contour map, a horizontal line can signify a region of consistent elevation.
Chemistry
- Concentration-Time Graphs: In kinetics, a horizontal line on a concentration-time graph indicates that a reaction has reached equilibrium.
Astronomy
- Light Curves: In the study of stars and their luminosities, a horizontal line on a light curve might indicate a star’s constant brightness over time.
Engineering
- Control Systems: In systems engineering, particularly in control systems, a horizontal line in a response graph can signify that a system has stabilized at a particular output level.
- Although the idea of a horizontal line as a function is a fundamental one, its applications span many fields and frequently denote stability, equilibrium, or a consistent condition.
All images were created with GeoGebra.
