JUMP TO TOPIC
 At an advanced level, statistics is considered harder than calculus, but beginner-level statistics is much easier than beginner calculus.
Frankly, it mostly depends upon the student’s interest as some students find it hard to comprehend statistics while others find it hard to understand calculus.
In this article, we will make a case for both statistics and calculus to identify which is harder and best suited for you to choose as your major in college. So let us explore which subject is best suited for you.
Is Statistics Harder Than Calculus?
Yes, statistics tends to be harder than calculus mainly because it is vast and covers many topics built on top of calculus. Statistics itself is a vast field; statistics vs calculus comparison is like comparing mathematics with calculus. But having said that, it will eventually depend on which majors you want to pursue in the future.
This question arises in most students’ minds when thinking about choosing their majors in the field of mathematics. Is statistics harder than calculus? Is statistics better than calculus? Is statistics harder than college algebra? Why is statistics so hard? Is statistics difficult? Is stat the hardest math class/ap class, or is statistics easier than calculus? Which one to choose, statistics vs calculus in high school?
Suppose you have not developed any specific interest in statistics or calculus and want to choose one subject between one of the two purely based on difficulty. In that case, as we mentioned above, statistics is harder than calculus. Note that entry-level or beginner statistics is much easier as compared to calculus, while advanced statistics is way more complex and difficult than calculus in general.
What To Choose
So, is it a good decision to choose ap stat/ ap statistics or ap calculus at the college level purely based on the difficulty level? That would not be a good choice as along with the difficulty you should also consider the field you want to pursue in future along with your aptitude in maths. Deciding what courses you should take during your senior high school years or in college will mostly depend upon your comfort level or taste with certain topics and the type of field/career you want to pursue.
If you think you have all the basics covered and you are good at pre-calculus, then you should prefer calculus, but if you think you can perform well in ap stat and can learn statistics easily, then choose statistics over calculus.
When To Choose Statistics
Now let us compare these two subjects on the basis of the career you want to pursue. For example, suppose you want to do a major in business administration, marketing, management etc. In that case, statistics will be best suited for you and for the above-mentioned majors you don’t need to study advanced level calculus as most of these majors deal with real-life problems which deal with statistics.
The course of ap statistics is different from ap calculus as it is more related to solving real-life problems and is also an essential tool for research and surveys. Statistics allows you to analyze the data collected through surveys and will provide you with tools to draw different statistical patterns to analyze the data.
When To Choose Calculus
On the other hand, if you are interested in doing your majors in STEM( Science, Technology, Engineering and Math), then you have to study calculus, as all the engineering and technology colleges prefer calculus over ap stats as there are more applications of calculus as compared to stats in the field of engineering and technology. Finally, suppose any medical student is wondering which to choose between statistics or calculus for medical school. In that case, statistics might be a better option as statistics is required in medical research as well as in subjects such as community medicine.
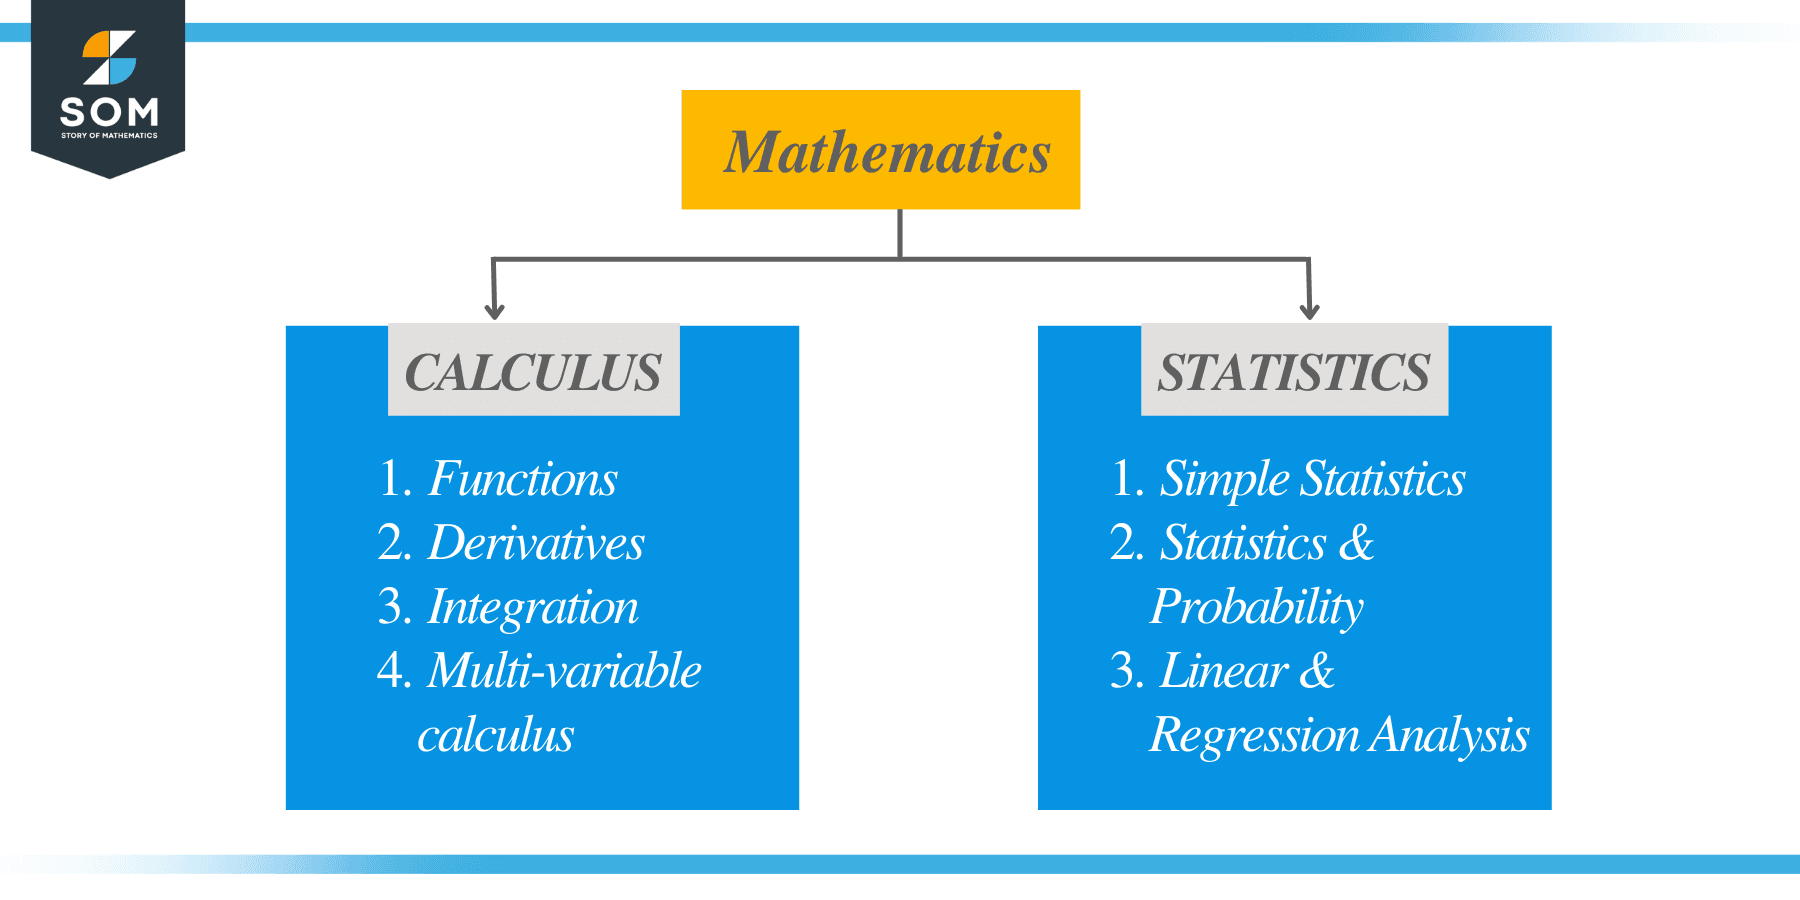
Now that we have a general idea about statistics and calculus. Let us dig deeper and study statistics and calculus in detail.
What Is Statistics?
Statistics, as the name suggests, is a field that is used to carry out statistical analysis of data, surveys or any research in general. Statistics is a tool that is essential for developing distribution charts in the field of business and commerce. Statistics deals with arithmetics, means, standard deviation, variance and other statistical features, and it can be used to study the growth and fall of a business, stock market etc.
Why It’s Harder
Statistics has more real-life applications than calculus, but to study statistics at the high school or college level, you should have a grasp of basic algebra in school-level math classes. For calculus, it is recommended to study pre-calculus before you choose to study calculus at the college level.
Statistics is notoriously considered hard, and most students avoid it by just hearing about the difficulty level of statistics. The truth is statistics may feel competitive at the start, but once you get the hang of it, then it becomes much easier. There are individual topics of statistics which are actually quite hard, but statistics as a whole is not very hard. The good thing about statistics is that basic statistics is much easier than calculus.
We use statistics in our daily life without even considering it. For example, calculating the average values of some data, finding the middle number between a sequence etc. See, statistics is not that difficult, is it? Then why do students are reluctant to choose statistics and think it is difficult? As discussed earlier, stats deal with daily life problems and some of the individual concepts are far more tricky in advanced statistics, so when such a problem is given to students, they find it hard to comprehend.
Complex Formulas
Let us look at some of the reasons why students find statistics more difficult. One of the main reasons is the numerous complex formulas involved in statistics. The second confusing step involves the usage of formulas in a given problem. Some formulas look similar but are different and each formula can be applied to a specific situation.
Students find it hard to grasp the concept of where to use a certain formula and as the problem itself is complicated in nature the students initially don’t comprehend the problem and then use the wrong formula.
Performing regression analysis in statistics is quite hard and students find it hard to grasp the concept and types of regression analysis used to study a survey or do research. As most of the questions are real-life scenarios, students find that most of the real-life scenarios are out of context with what they study in books, and it is harder for them to apply a related concept to a given problem.
So, we can conclude that statistics itself is not that hard but how you approach a problem will define the difficulty of the problem. When studying a formula in calculus, it is quite easy to apply it to different problems. But in statistics, understanding the context of a given problem is essential before you go further to apply a certain formula. The main difference between statistics and calculus are given in the picture below.
So if you have good analytical abilities and can comprehend a given word problem easily, you will not find statistics as challenging as it generally is. Let us study some of the problems related to statistics so you can get an idea of what you are dealing with when you choose statistics.
Example 1
Calculate the mean value and standard deviation for the given sets:
Set A = { 2,4,6,8,10}
Set B = {5,5,6,6,7,7}
Solution
The mean value is the average value of the set. So, if we calculate the average value of the given data of the set, it will give us the mean value of the set.
Mean Value of Set A $= \dfrac{2+4+6+8+10}{5}= \dfrac{30}{5} = 6$
Mean Value of Set B $= \dfrac{5+5+6+6+7+7}{6}= \dfrac{36}{6} = 6$
Standard Deviation for any set can be calculated by using the following formula
$\sigma = \dfrac{\sum(X-\mu)}{N}$
$\sigma$ = Standard Deviation of the Set
$\sum$ = Summation or sum of
$\mu$ = mean of the population or set
$N$ = Number of elements or population of the set
S.D for Set A $= \sqrt{\dfrac{(2 – 6)^{2} + (4 – 6)^{2} + (6 – 6)^{2} +(8 – 6)^{2} + (10 – 6)^{2} }{5}}$
S.D for Set A $= \sqrt{\dfrac{(-4)^{2} + (-2)^{2} + (0)^{2} +(2)^{2} + (4)^{2} }{5}}$
S.D for Set A $= \sqrt{\dfrac{(16 + 4 + 0 + 4 + 16 }{5}}= \sqrt{\dfrac{40}{5}} = \sqrt{8}= 2\sqrt{2}$
S.D for Set B $= \sqrt{\dfrac{(5 – 6)^{2} + (5 – 6)^{2} + (6 – 6)^{2} +(6 – 6)^{2} + (7 – 6)^{2} + (7 – 6)^{2} }{6}}$
S.D for Set B $= \sqrt{\dfrac{(-1)^{2} + (-1)^{2} + (0)^{2}+ (0)^{2} +(1)^{2} + (1)^{2} }{5}}$
S.D for Set B $= \sqrt{\dfrac{(1 + 1 + 0 + 0 + 1 + 1 }{5}}= \sqrt{\dfrac{4}{5}} = \dfrac{2}{\sqrt{5}}$.
Example 2
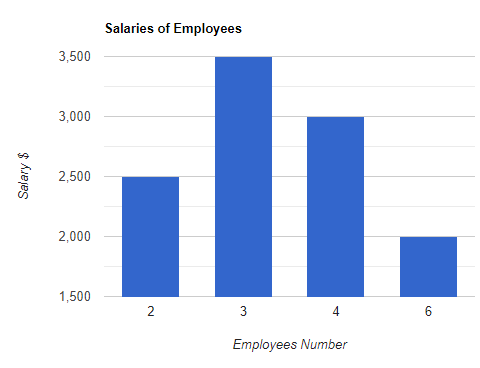
Calculate the mean value and standard deviation for the graph given below.
Solution
The total number of employees are
Number of employees $= 2 + 3+ 4 + 6 = 15$.
We need to multiply the respective salary by the number of employees to get the final amount of salary, and then we can divide it by the total number of employees to get the average or mean value of the salary.
Total Salary $= (2\times 2500) + (3\times 3500) + (4\times 3000) + (6\times 2000)$
Total Salary $= 5000 + 10,500 + 12,000 + 12,000 = 39,500$
Mean Salary $= \dfrac{Total Salary}{Number of Employees} = \dfrac{39,500}{15}=2633.3\$$
$\sigma = \dfrac{\sum(X-\mu)F_i}{F_i}$
Here, $F_i$ is the frequency data.
S.D for Set A$= \sqrt{2} \times$
$\sqrt{ \dfrac{(2500 – 2633.33)^{2} + 3\times (3500 – 2633.33)^{2} + 4\times (3000 – 2633.33)^{2} + 6\times (2000 – 2633.33)^{2}}{15}}$
S.D for Set A $= \sqrt{\dfrac{2\times (-133.33)^{2} + 3\times (866.67)^{2} + 4\times (366.67)^{2} + 6 \times (-633.33)^{2}}{15}}$
S.D for Set A $= \sqrt{\dfrac{(35553.8 + 2253350.67 + 537787.56 + 2406641.33 )}{15}}= \sqrt{370,222.24} \approx 608.46$.
Example 3
Suppose a class has $60$ students with a mean score in mathematics of $70$. Can we regard this score as a sample from the population with a mean score of $55$ and a deviation of $35$ marks?
Solution
To answer this question, we must first define what is meant by sampling and sampling distribution.
In statistics, sampling is gathering elements, data or representatives from a given population.
The sampling distribution is given by the formula
$z(score)=\dfrac{\bar{x}-\mu}{\frac{\sigma}{\sqrt{n}}}$
Here, $\bar{x}$ is the mean value when we choose a sample of the number “$n$” from the population having the mean $\mu$. So, $\mu$ is the mean value of the population while $\bar{x}$ is the mean value of the sample. “$z$” is the distribution score, and the above formula is used when the sample size is greater or equal to $30$. In our case, the sample size is $60$, so we can use this formula.
So, the answer to the question is yes, it is possible for that sample mean value to deviate from the population mean value and maybe even greater than the population mean value.
Let us put in the values in the formula
$z(score)=\dfrac{70 – 55}{\frac{35}{\sqrt{60}}} = 3.3$
The probability of the same of 70 can be determined by using the standard positive table for values of z.
P(z $\geq$ 3.3) = 1 – P(z $\leq$ 3.3) $= 1 – 0.9995 = 0.005$ so the probability for the mean value of the sample to be greater than the the mean value of population is 0.05 %.
We have just covered three different examples related to statistics. You can notice that the first two examples are quite easy, and they are studied at the beginner level, but as you go deep and study advanced statistics, it mostly deals with sampling, probability, and distributions, and these are the topics which make statistics complex than the calculus.
What Is Calculus?
Calculus, or as we should call it, infinitesimal calculus, is a branch of mathematics that involves the study of continuous change or the rate of change. In calculus, we study topics related to functions, differentiation, and integration. Calculus is not typically used in daily life experiences, but it has major applications in the field of physics and dynamic sciences.
We know everything in the universe is constantly moving, so calculus has helped us to understand how particles, atoms, and stars move and change direction in real-time. Calculus mainly deals with numerical and algebraic problems.
Differences
Calculus problems are quite straightforward as we don’t play with the words and try to understand the context of the given problem. Most of the time, we are given a numerical problem, and we just have to solve it to get the right solution.
When we are dealing with algebraic problems, we can even verify our answers through different methods. All you need to do is to grasp the initial concepts. Entry-level calculus sometimes does seem harder as compared to entry-level statistics, but once you get the hang of the concepts, calculus problems are easier to solve, and you have to apply the same technique to many different problems.
Unlike statistics, you are not given random data to analyze, understand and then apply different techniques to present the raw data in a good explanatory form. In calculus, we just have to solve the problem to solve for the rate of change, and the only basic requirement is that you have to be good in algebra.
Let us look at several problems related to calculus so that you get an idea of what type of problems you are mostly going to come across in calculus.
Example 4:
For the given function find the value of “$y$” at $x = 1$ and $x = 0$
$f(x) = y = x^{2}+3x$
Solution:
$f(1) = y = 1^{2}+ 3(1) = 1+3 = 4$
$f(0) = y = 0^{2}+ 3(0) = 0$
Example 5:
Find the derivative of the given function
$f(x) = y = x^{2}+3x$
Solution:
The derivative formula for an exponential expression is given as
$\dfrac{d}{dx}x^{n} = n . x^{n-1}$
$\dfrac{dy}{dx}= \dfrac{d}{dx} x ^{2} + \dfrac{d}{dx}3x = 2x + 3$
Example 6:
Find out the value of “a” and “b” in the linear equation $f(x) = ax + b$ if the $f^{-1}(3) = 5$ and $f^{-}(-2) = 4$
Solution:
If $f^{-1}(3) = 5$ and $f^{-1}(-2) = 4$
Then we can say that f(5) = 3 and f(4) = -2. So, we can write the linear equations as
$f(5) = 5a+b = 3$
$f(4) = 4a+b = -2$
if we solve the above equations, we get the values of “a” and “b”, which are
$a = 5$
$b = -22$
So now that we have discussed calculus and statistics, we can draw a table to highlight the basic differences between the two subjects.
Calculus | Statistics |
Deals with numerical and algebraic problems related to the rate of change. | Deals with analyzing and studying collected data and related research |
| The concepts of calculus originated from the basic idea of pre-calculus | The concepts of statistics originated from arithmetics and computations. |
| It focuses on solving the given problem mathematically. | It focuses on understanding and computation of the provided data or information. |
| Calculus is crucial for science, engineering, and technology | Statistics is crucial or essential for business, commerce, and stock markets |
| The skills required to fully understand the concept of calculus are previous mathematics knowledge and, in general, computation skills | The skills needed to be good in statistics are reading, analysing, processing and high logical reasoning. |
Conclusion
After reading this article, you now have a clear picture of the differences between statistics and calculus and which one is suited for you. Let us summarize in bullet points what we have learned so far.
- In general, statistics is more vast and covers more topics than calculus. Hence, it is also perceived to be more challenging.
- Basic or entry-level statistics is much easier as compared to basic level calculus.
- Advance level statistics is much much harder than advanced level calculus.
- If you are thinking of pursuing a career in commerce and business administration, then you should understand and study basic and advanced level statistics. If you want to pursue a career in engineering and technology, then you should focus on calculus.