JUMP TO TOPIC
 If in a given table of two quantities, an increase/decrease of one quantity results in a proportional increase/decrease in the other quantity, then the table represents a linear function.
If we are provided with a table with two variables “$x$” and “$y$” and for every value of “$x$” there is a specific corresponding value of “$y$”, we can tell whether the given values represent a linear function by just looking at the values. In this complete guide, we will discuss a linear function and how to recognize a linear function using a table of available values.
Which Table Represents a Linear Function?
A table contains two variables, “$x$” and “$y$” and if we plot these variables in a two-dimensional plane, we get a straight line — such a table represents a linear function.
Similarly, if we are given a table with values of “$x$” and “$y$” and we write an equation by using the values of “$x$” and “$y$” and the resultant equation is a linear equation then we will say this table represents a linear function.
Finally, if we are given a table with values of “x” and “y” such that each increase or decrease in “x” is met by a corresponding proportional increase or decrease in “y”, then such table represents a linear function.
So, we can conclude that there are three methods to tell whether or not a given table represents a linear function.
- By plotting the graph
- By developing a linear equation
- By comparing the change in the variable values
Plotting the Graph
If we plot the points provided to us in a table and they form a straight line, then we can conclude that the given table represents a linear function. For example, if we are given a table:
| x | y |
$1$ | $4$ |
$2$ | $6$ |
$3$ | $8$ |
| $4$ | $10$ |
The graph represents a straight linear line.
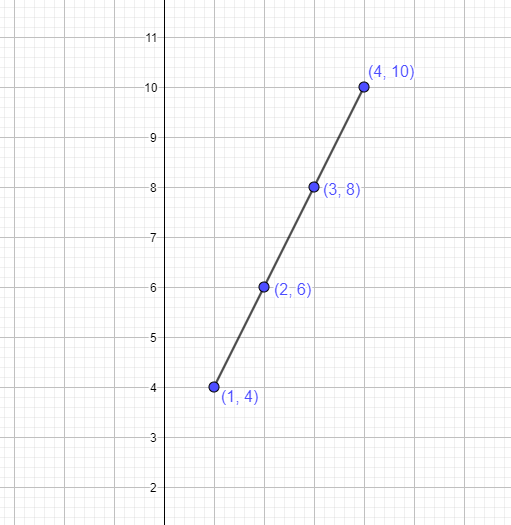
The graph verifies that a straight line is formed by using the values of the table. Hence, the values in the table represent a linear function.
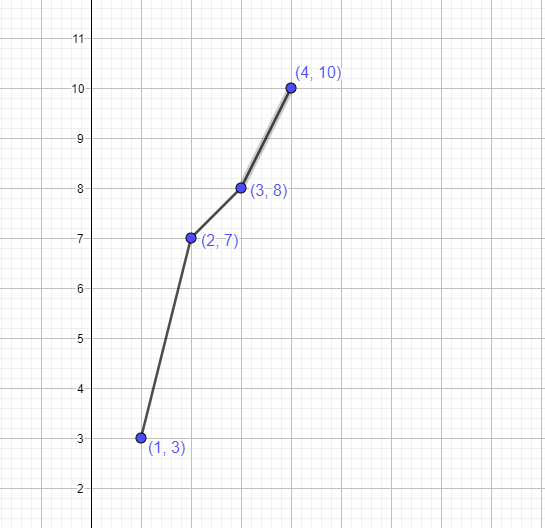
Similarly, if we look at the table given below and plot the graph by using the values of “$x$” and “$y$”, we will see the graph is not a straight line, hence the table below does not represent a linear function.
x | y |
$1$ | $3$ |
| $2$ | $7$ |
$3$ | $8$ |
| $4$ | $10$ |
The graph will be:
Developing a Linear Equation
The second method we can use to tell whether or not a table represents a linear function is by developing an equation using the values of the table. If the equation is linear, we can deduce that the table represents a linear function. We will only be able to develop a linear equation if the slope for all values of “$x$” and “$y$” remains constant.
If we are provided with a table having different values of “$x$” and “$y$”, then we will use these values to develop an equation of a straight line, i.e., $y = mx + b$. If we can develop such an equation by using the data provided, then we will conclude that the table represents a linear function.
The first step is to calculate the value of the slope “$m$” from the given data and we can do this by using the formula of the slope.
Slope $= \dfrac{y_2 – y_1}{x_2 – x_1}$.
In the second step, we will use the values of “$x$” and “$y$” and determine the value of the constant “b.”
In the final step, we will use the values of “$m$” and “$b$” and develop the equation of the line.
Suppose we are given the table below; let us see whether or not the given table represents a linear function.
| x | y |
$6$ | $5$ |
| $8$ | $0$ |
$10$ | $-5$ |
| $12$ | $-10$ |
We will calculate the value of the slope by using the formula given below:
$m = \dfrac{y_2 – y_1}{x_2 – x_1}$
To calculate the slope, we will take the consecutive values of “x” and “y” from top to bottom:
Let us take $x_1 = 6$, $x_2 = 8$, $y_1 = 5$ and $y_2 = 0$
$m = \dfrac{0 – 5}{8 – 6}= -\dfrac{5}{2}$
Let us take $x_1 = 8$, $x_2 = 10$, $y_1 = 0$ and $y_2 = -5$
$m = \dfrac{-5 – 0}{10 – 2}= -\dfrac{5}{2}$
Let us take $x_1 = 10$, $x_2 = 12$, $y_1 = -5$ and $y_2 = -10$
$m = \dfrac{-10 – (-5)}{12 – 10}= -\dfrac{5}{2}$
As we can see, the slope for any given value of “$x$” along with the corresponding value of “$y$” remains constant; hence we can say the table represents a linear equation. Now let us determine the value of $b$.
Now putting the value of slope “m” into the equation $y = mx + b$, we get:
$y = -\dfrac{5}{2}x + b$
To calculate the value of “b”, we will take any of the given values of “x” from the table, and we will also take the corresponding value of “y” that is in the same row as “x”.
$0 = -\dfrac{5}{2}(8) + b$
$0 = -20 + b$
$b = 20$
So the final equation is $y = -\dfrac{5}{2}x + 20$. As it is a linear equation, hence the table represents a linear function.
Example 1: If the table represents a linear function, what is the slope of the function?
| x | y |
$1$ | $2$ |
| $2$ | $4$ |
$3$ | $6$ |
| $4$ | $8$ |
Solution
We know that the table represents a linear function. Hence, we can calculate the slope of the function by using the formula:
Slope $= \dfrac{y_2 – y_1}{x_2 – x_1}$.
Let us take $x_1 = 1$, $x_2 = 2$, $y_1 = 2$ and $y_2 = 4$
$m = \dfrac{4 – 2}{2 – 1}= \dfrac{2}{1} = 2$
Let us verify it
Let us take $x_1 = 2$, $x_2 = 3$, $y_1 = 4$ and $y_2 = 6$
$m = \dfrac{6 – 4}{2 – 1}= \dfrac{2}{1}= 5$
The slope of the function is m = 2.
Example 2: Using the slope method, determine whether or not the given table represents a linear function.
x | y |
$1$ | $2$ |
| $2$ | $6$ |
$3$ | $10$ |
| $4$ | $12$ |
Solution
To determine whether or not the table represents a linear function, we will calculate the value of slope “m” for each value of “$x$” along with the corresponding value of “$y$” in the same row. We know that we can write the slope formula as:
$m = \dfrac{y_2 – y_1}{x_2 – x_1}$.
Let us take $x_1 = 1$, $x_2 = 2$, $y_1 = 2$ and $y_2 = 6$
$m = \dfrac{6 – 2}{2 – 1}= \dfrac{4}{1} = 4$
Let us take $x_1 = 2$, $x_2 = 3$, $y_1 = 6$ and $y_2 = 10$
$m = \dfrac{10 – 6}{3 – 2}= \dfrac{4}{1}= 4$
Let us take $x_1 = 3$, $x_2 = 4$, $y_1 = 10$ and $y_2 = 12$
$m = \dfrac{12 – 10}{4 – 3}= \dfrac{2}{1} = 2$
As the slope value does not remain constant, the given table is not a linear function.
Comparing the Change in Variables
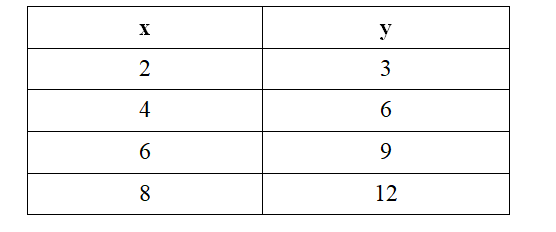
The third and final method to determine whether or not a given table represents a linear function is by verifying that a change in the values of “$x$” results in a proportional change in “$y$”. This method is only limited to those tables where the value of $x$ changes by a constant number, e.g., if the values of “x” are $2$,$4$,$6$, and $8$, then we can see that the rate of change in the values of “$x$” is $2$. If the corresponding values of “y” are $3$,$6$,$9$, and $12$, then we can see that the rate of change in the values of “$y$” is $3$. Such a table would represent a linear function. If for a constant change in $x$, the change in the values of $y$ is not constant, then such a table represents a non-linear function.
In this method, we do not require to calculate the slope for the given values. We can just find out whether or not the table represents the linear function just by looking at the change in the values of “$x$” and “$y$”
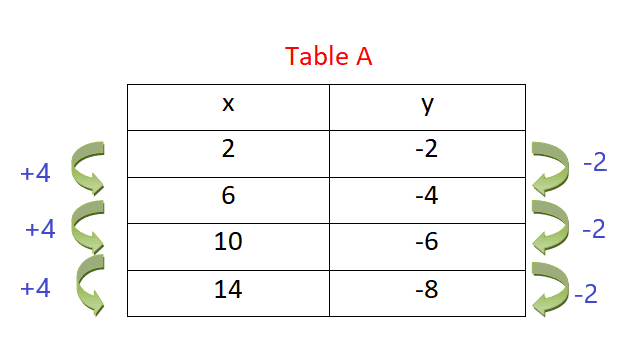
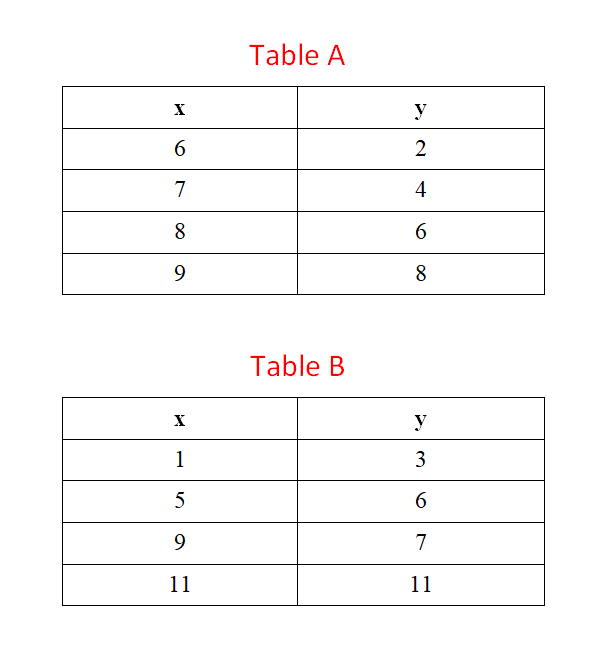
Example 3: Determine which table represents a function.
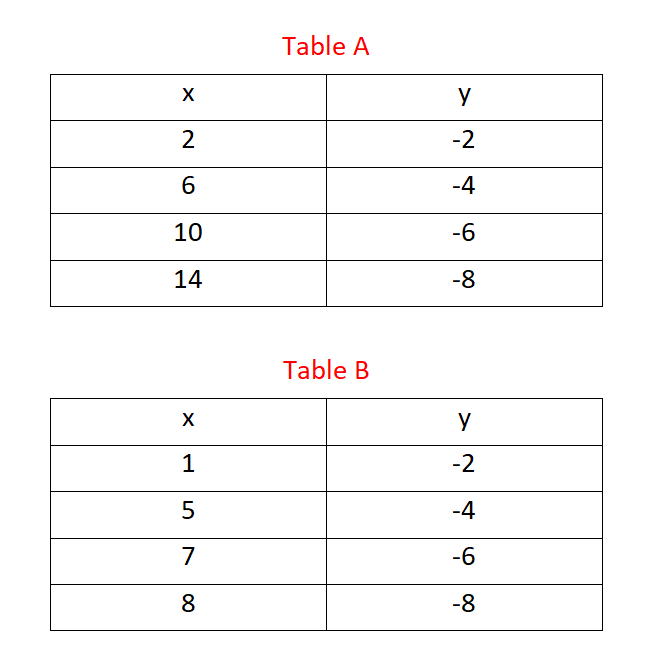
Solution
The change in values of x and y values in table A is constant as shown in the figure below. So table A represents a linear function.
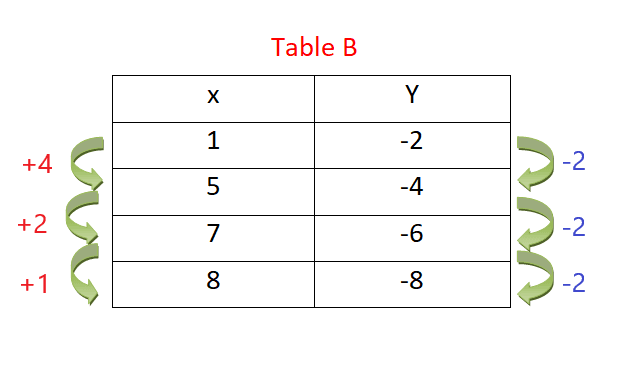
The change in values of x and y values in table B is not constant, as shown in the figure below. So our method is not applicable in the case of table B. We should use the other methods discussed in the article to find out if this table is linear or not.
Example 4: Determine whether or not we can apply the “Comparing the change” method for the table given below:
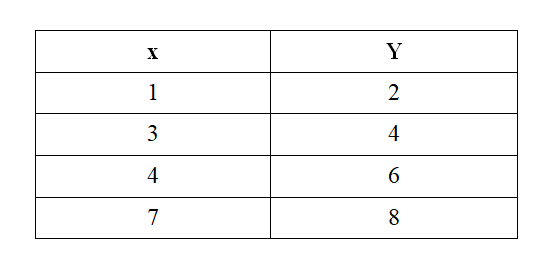
Solution
Let us see if the change in the values of “x” and “y” is constant or not.
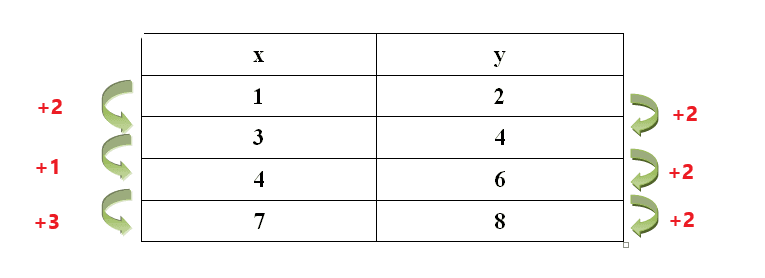
As we can see, the rate of change in the values of “$x$” is not constant, while the rate of change in values of “$y$” is constant. Even if the rate of change in the values of “$y$” is constant, if the rate of change in the values of “$x$” is not constant, then we cannot apply the “Comparing the change” method in this case.
Let us study some examples of linear equations and their tables.
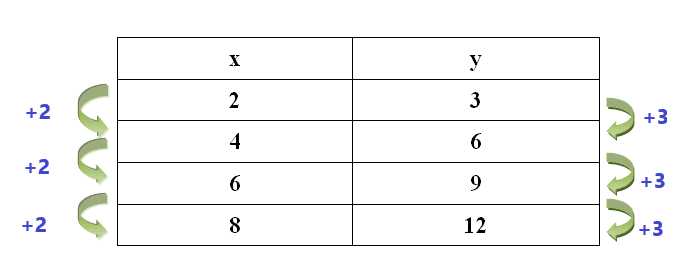
Example 5: The values in the table represent a linear function. What is the common difference of the associated arithmetic sequence?
Solution
The common difference of the variable “$x$” sequence is “$2$” while the common difference for the variable “$y$” sequence is “$3$.”
Example 6: Which Table does not represent a linear function?
Solution
In Table “A”, the change in values of $x$ is constant and is equal to 1. The corresponding change in the values of $y$ is constant as well and is equal to 2. So this table represents a linear function.
In Table “B”, the change in $x$ is not constant, so we have to rely on some other method. The slope using the first two rows is equal to $\frac{6-3}{5-1} = \frac{3}{4}$. The slope using the second two rows is $\frac{11-7}{11-9} = 2/2 = 1$. Since the slope is not constant, so Table B represents a non-linear function.
Example 7: Which equation represents a linear function
a) $y = x^{3}$ b) $y = 5x+5$ c) $y = 2x^{2}$
Solution
The equation “b” $y = 5x+5$ represents a linear function.
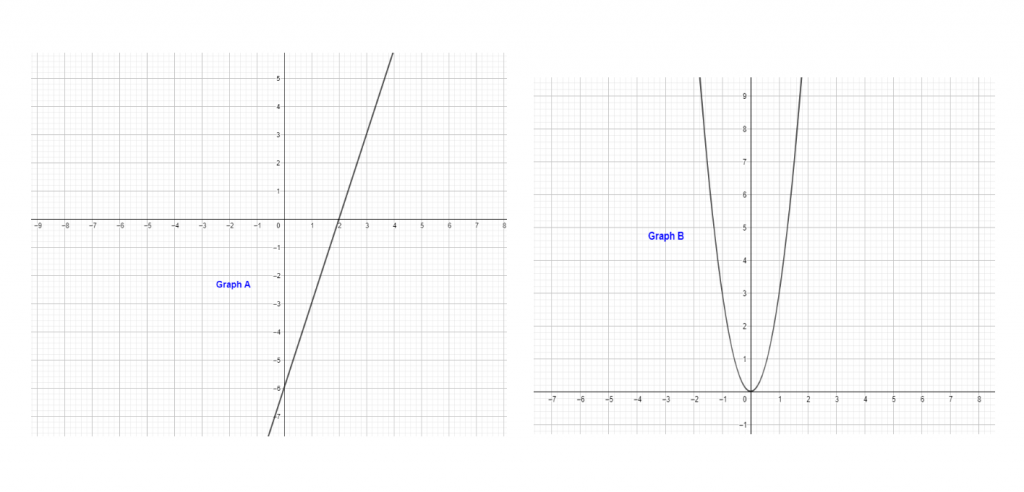
Example 8: Which graph shows a linear function
Solution
Graph “A” represents a linear function
Example 9: Which equation represents the graphed function?
a) $x = \pm$ y b) $x =3x-6$ c) . $y =3x-6$
Solution
The equation “a” $x = \pm$ does not represent a graphed function. The rest of the two are linear functions, and a table that represent these functions can be used to plot the graph of the functions.
Example 10: which table represents a linear function that has a slope of 5 and a y-intercept of 20?
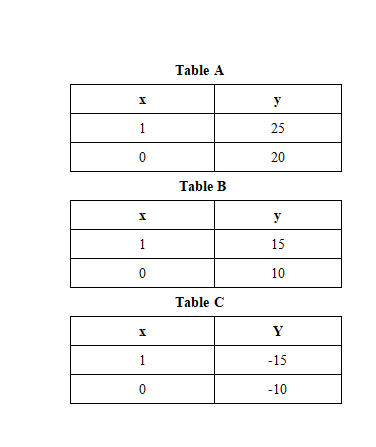
Solution
We know that the equation of a linear function is written as
$y = mx + b$
Slope = m = 5 and y-intercept = b = 20
$y = 5x +20$
If we put in the values of “x” from all three tables, then we can conclude that only Table “A” satisfies the equation; hence table “A” represents a linear function with the slope of $5$ and the y-intercept of $20$.
$y = 5(1) + 20 = 25$
$y = 5(0) + 20 = 20$
Conclusion
Let us now revisit what we have learned so far.
- We can determine whether or not a given table represents a linear function by using three different methods.
- The easiest method is to check the rate of change of values of “x” and “y” in their respective columns.
- If the rate of change remains constant for “x” and “y”, then we will conclude that the table represents a linear function.