JUMP TO TOPIC
 Linear vs nonlinear functions is a standard comparison you will encounter while studying mathematics. Any given function can be represented as a graph. The graph can be linear or nonlinear, depending upon the characteristics of the function. This guide will help you better understand linear and nonlinear functions and how they differ from each other by using many examples and practice questions.
Let us learn about the differences between linear and nonlinear functions and how you can tell at a glance whether the given function is linear or nonlinear.
Linear vs Nonlinear Functions Side-by-Side Comparison
Sr. No | Linear function | Nonlinear function |
| 1 | A linear function is plotted as a straight line with no curves. | Nonlinear equations do not form a straight line; instead, they always have a curve. |
| 2 | The degree of the equation representing a linear function will always equal 1. | The degree of the equation for a nonlinear function will always be greater than 1. |
| 3 | A linear equation will always form a straight line in the XY- Cartesian plane, and the line can extend to any direction depending upon the limits or constraints of the equation. | Nonlinear functions will always form a curved graph. The curve of the graph will depend upon the degree of the function. The higher the degree, the higher the curvature. |
| 4 | Linear functions or equations are written as $y = mx + b$ Here, “$m$” is the slope, while “b” is the constant value. “$x$” and “$y$” are the variables of the equation. | An example of a nonlinear equations is $ax^{2}+ bx = c$. As you can see, the degree of the equation is $2$, so it is a quadratic equation. If we increase the degree to $3$, it will be a cubic equation. |
| 5 | Examples of linear functions $3x + y = 4$ $4x + 1 = y$ $2x + 2y = 6$ | Examples of nonlinear functions $2x^{2}+ 6x = 4$ $3x^{2}- 6x +10 = 0$ $3x^{3}+2x^{2}+3x = 4$ |
What Are the Differences Between Linear and Nonlinear Functions?
The main difference between linear and nonlinear functions is their respective plots. The linear function will always be a straight line, while the nonlinear function will never produce a straight line.
What Is a Linear Function?
The function or equation having a degree of 1 with a single dependent and a single independent variable is called a linear function. Such functions will always give a straight line. Linear functions are written as:
$f(x) = y = a + bx$
Here, “$x$” is the independent variable while “$y$” is the dependent variable. “$a$” is the constant, and “$b$” is termed as the coefficient for the independent variable.
How To Graph a Linear Function
Graphing linear functions is relatively easy. You can follow the steps given below to plot the linear functions:
1. Determine $2$ or more points that satisfy the given equations.
2. Plot the points found in step $1$.
3. Join the points to form a straight line.
Example 1
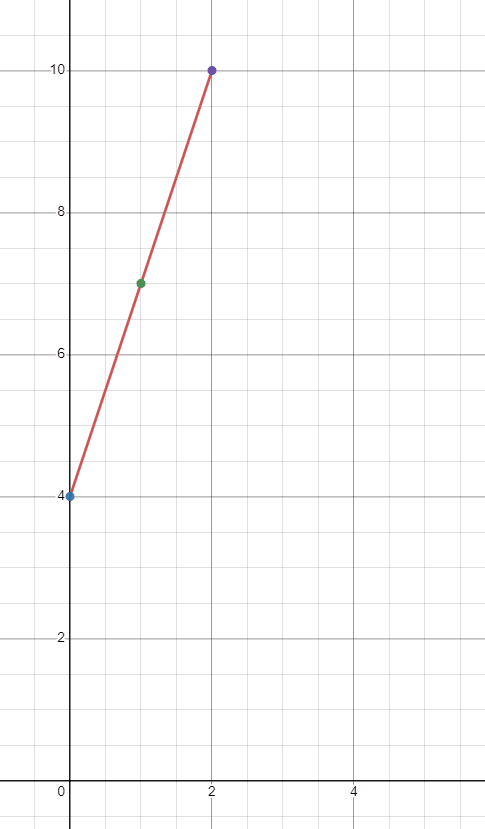
Plot the graph for the linear function $y = 3x + 4$
Solution
We will find the value of “$y$” at three different values of “$x$”. Let us find the value of “$y$” at $x = 0, 1$ and $2$.
When $x = 0$
$y = 3(0) + 4 = 4$
When $x = 1$
$y = 3(1) + 4 = 7$
When $x = 2$
$y = 3(2) + 4 = 10$
Example 2
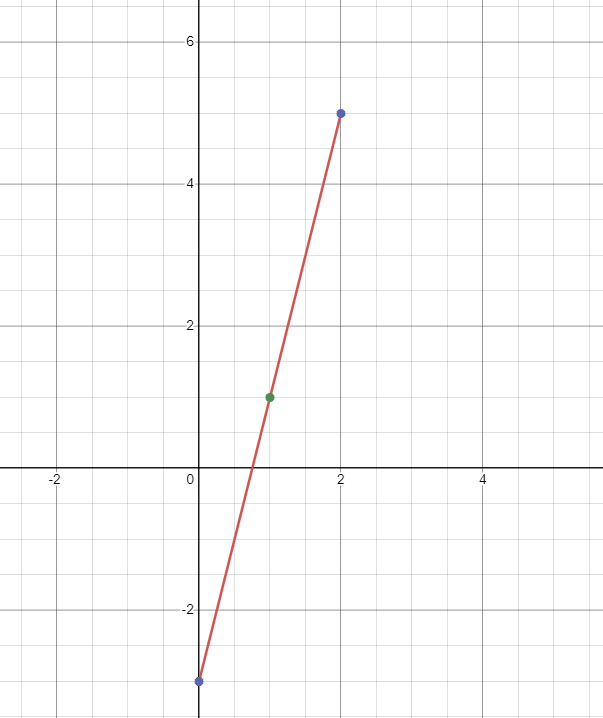
Plot the graph for the linear function $y = 4x – 3$.
Solution
We will find the value of “$y$” at three different values of “$x$”. Let us find the value of “$y$” at $x = 0, 1$ and 2$.
When $x = 0$
$y = 4(0) – 3 = -3$
When $x = 1$
$y = 4(1) – 3 = 1$
When $x = 2$
$y = 4(2) – 3 = 8 – 3 = 5$
We have discussed basic examples of a linear function. Let us now study a complex example related to a linear function.
Example 3
A small village had a population of $1000$ in the year $2003$. The same village had a population of $1300$ in the year $2006$. If the population of the village is denoted by “$G$” while the growth rate is depicted as a linear function of time “$t$,”
a) What will be the population of the village at the end of the year $2012$?
b) Determine the linear function that related the population of the village “$G$” with the time “$t$”.
Solution
We are given that the growth rate of the village is a linear function. So to solve the first part of the equation, we can form ordered pairs and find out the slope of the function, and then we can put that in the formula:
$y = mx + b$
If “$b$” is the population in the year $2003$, while “$x$” is the number of years, and if we find out the slope (per year increase in population), then we can determine the total population in the year $2010$.
a)
We can write the variable “$G$” and “$t$” in the ordered pair as $(t, G)$. For the year $2003$ we will assume $t = 0$ and for year $2006$ value of “$t$” will be equal to $3$. So we have obtained two ordered pairs as:
$(0, 1000)$ and $(3, 1300)$
As we know, the village population increases linearly, so we can find out the rate increase per year by calculating the slope from the above two ordered pairs.
Slope $= m = \dfrac{y_{2} – y_{1}}{x_{2}- x_{1}}$
$m = \dfrac{(1300 – 1000)}{(3 – 0)} = 100$ people per year.
So now we can find out the population growth by using the slope and the given population of year 2003. We know the total amount of years from $2003$ to $2012$ would be equal to $9$.
$G (2010) = G(2003) + 9 \times 100 = 1000 + 900 = 1900$ people.
b)
We have calculated the slope in the first part so it can be used to determine the general relation between “$G$” and “$t$”.
$G – G_{1} = m (t – t_{1})$
$G – 1000 = 100 (t – 0)$
$G = 100 t + 1000$
What Is a Nonlinear Function?
A function or equation having a degree greater than 1 with dependent and independent variable(s) will be called a nonlinear function. Such functions, when plotted, do not form a straight line. Alternatively, if any function is not linear, then it will certainly be a nonlinear function. Nonlinear equations are generally written as:
$f(x) = y = ax^{2} + bx +c$
Here, “x” is the independent variable while “$y$” is the dependent variable. “$a$” is the coefficient of “$x^{2}$” and “$b$” is the coefficient of “$x$.”
How To Graph a Nonlinear Function
Graphing nonlinear equations is a bit tricky compared to linear functions. The method is the same.
1. Find out $2$ or more points that satisfy the given equation.
2. Plot the points found in step $1$.
3. Join the points to form a straight line.
The steps mentioned above are the basics to plot a graph for any function. However, finding out the points which satisfy the equation for a high-degree polynomial function can be tricky. Let us study the steps to plot the graph if you are given a quadratic function.
Step 1: The first step is to write the quadratic equation in a standard form as $ax^{2}+bx +c$.
Step 2: In the second step, calculate the vertex points of the given function as $(-\dfrac{b}{2a}, f(-\dfrac{b}{2a}) )$.
Step 3: In the third step, solve the given function for two integer values above and below the vertex points. For example, if the vertex point is $(2,3)$, then you will solve the given function for $x = 0,1,3$ and $4$. After solving the equation, you will get the corresponding values of “$y$.”
Step 4: Scatter plot the points you found out in step $3$.
Step 5: Join all the points to form the nonlinear graph for the function.
Example 4
Plot the graph for the nonlinear function $f(x) = x^{2}- 6x + 12$.
Solution
For the given function $f(x) = x^{2}- 6x + 12$, the value of a, b and c will be $1$, $-6$ and $12$, respectively.
$a = 1$ , $b = -6$, $c = 12$
Let us find out the vertex point of the given nonlinear function.
$x = -\dfrac{b}{2a}$
$x = -\dfrac{-6}{2 (1)}$
$x = \dfrac{6}{2} = 3$
Plugging in this value to calculate “y”
$y = x^{2}- 6x + 12$
$y = 3^{2}- 6 (3) + 12 = 9 – 18 +12 = 3$
So, the vertex of the nonlinear function is $(3, 3)$.
Now let us solve for the two values above number “$3$” and for two values below number “3”. We will solve the nonlinear function at $x = 1,2, 4$ and $5$.
$y = x^{2}-6x + 12$
When $x = 1$
y = $1^{2}- 6 (1) + 12 = 7$
When $x = 2$
y = $2^{2}- 6 (2) + 12 = 4$
When $x = 4$
y = $4^{2}- 6 (4) + 12 = 4$
When $x = 5$
y = $5^{2}- 6 (5) + 12 = 7$
Let us form the table so we can easily plot our ordered pairs.
| x | y |
$1$ | $7$ |
$2$ | $4$ |
$3$ | $3$ |
$4$ | $4$ |
$5$ | $7$ |
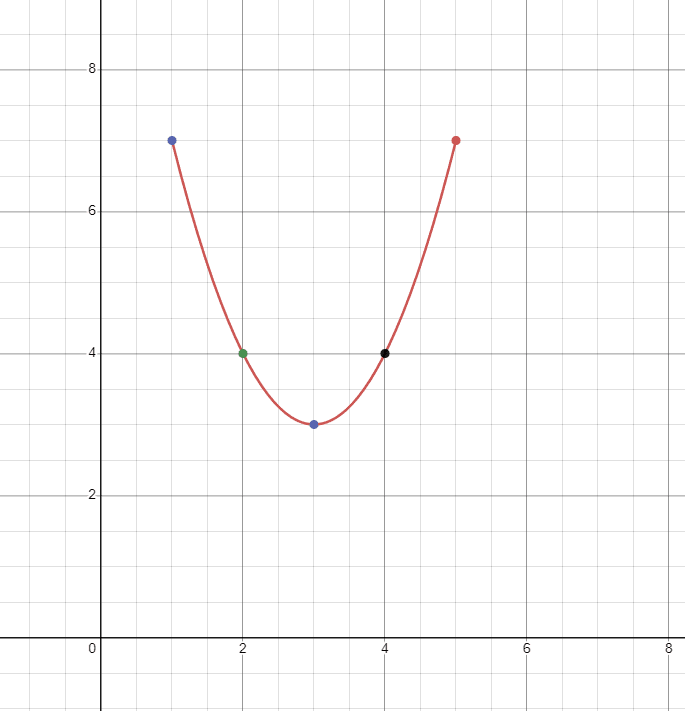
As you can see, the values of “$y$” in the first and second row are the same as in the 4th and 5th row, and the graph formed by using these values will be a bell-shaped parabola. Remember, only the graph for a quadratic equation can be plotted using this method.
Example 5
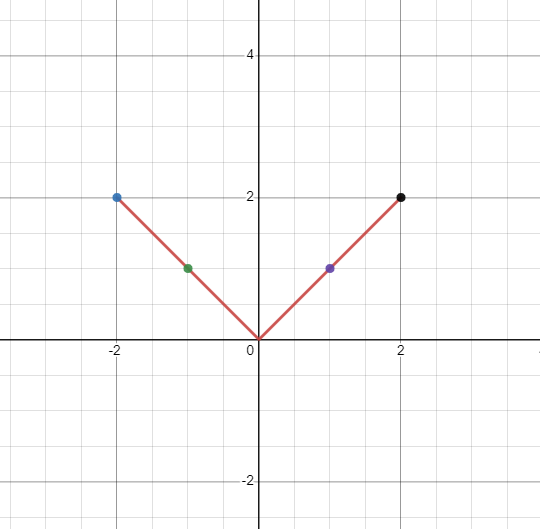
Plot the graph for the nonlinear function $y = |x|$.
Solution
We will use the basic method to draw the graph for the given nonlinear function.
As “y” is equal to the absolute of “x,” “y” cannot be negative. Hence, we will have a bell-shaped graph. The value of “y” will be the same for every value of \pm x.
When $x = 1$
$y = |1| = 1$
When $x = -1$
$y = |-1| =1$
When $x = 2$
$y = |2| = 2$
When $x = -2$
$y = |-2| = 2$
We will have a “$V$” shaped graph, but as it is not a straight line, it is a nonlinear graph.
Example 6
Allan is monitoring bacterial growth in a lab. Suppose the at the start or initial numbers of bacteria were $1000$ and they grow four times during the week. You must form the nonlinear equation and draw the graph for the equation.
Solution
Let “$x$” be the number of weeks, then we can write the nonlinear equation as:
$f(x) = y = 1000 (4)^{x}$
Now let us calculate the value of “y” for different values of “x”
When $x = 0$
$y = 1000 (4)^{0} = 1000 \times 1 = 1000$
When $x = 1$
$y = 1000 \times 4 = 4000$
When $x = 2$
$y = 1000 \times 4^{2}= 1000 \times 16 = 16,000$
After studying these examples, you can further practice linear vs nonlinear examples to enhance your skills.
Frequently Asked Questions
How Do You Know if Its Linear or Nonlinear?
The equation with a degree of 1 will be called a linear equation, and any equation with a degree greater than 1 will be termed a nonlinear equation.
The only similarity between these two is that they are functions and have dependent and independent variables in the equation. Other than that, there are no similarities between linear and nonlinear functions.
Is y(t) = x sin(t) Linear or Non-linear?
The graph of the given function is not a straight line; hence it is a nonlinear function.
Conclusion
After thoroughly discussing linear vs nonlinear functions, we can conclude that linear functions will form a straight line while nonlinear functions will form a curve or not a straight line.
Linear functions are easier to solve than nonlinear functions, and the graph plotting of linear functions is also easier than nonlinear functions. Both have their importance in mathematics, but you will more often than not face them. For example, linear vs nonlinear differential equations are also part of calculus. When we differentiate linear equations, it is called differentiation of linear equation, and similarly, when we differentiate a nonlinear equation, it will be called nonlinear differentiation.