JUMP TO TOPIC
 Deciding which table represents a direct variation function is done by checking if the table of values presents a proportional relationship using the formula for direct proportion. It may seem like a difficult task, but worry no more because you can determine whether a function table displays a direct variation function or not within seconds. We will also touch on another type of variation function to widen our knowledge of this topic.
Which Table Represents a Direct Variation Function?
The table of values that shows a constant ratio between two variables represents a direct variation function. If there is at least one pair of values that has a different ratio, then the function is not a direct proportion. We would always go back to the equation for direct proportion. That means that the equation applies to each corresponding value between the two variables.
For instance, consider the function $f(x)=3x$. We can assign the variable $y$ to $f(x)$. Then, we have the following table of values for this function.
| $x$ | $y$ |
|---|---|
| 2 | 6 |
| 3 | 9 |
| 5 | 15 |
| 8 | 24 |
| 10 | 30 |
This table represents a direct variation function because if we take the pairwise ratio between the values of $x$ and $y$, we get the same ratio.
Notice that all the ratio is equal to 3. Thus, we say that $y$ varies directly with $x$ with a constant of variation 3.
| $u$ | $v$ |
|---|---|
| 1 | 4 |
| 4 | 8 |
| 7 | 28 |
| 10 | 20 |
Let’s check the ratio of the values between the variables $u$ and $v$.
\begin{align*}
\dfrac{4}{1} &=\dfrac{28}{7}=4\\
\dfrac{8}{4} &=\dfrac{20}{10}=2
\end{align*}
They have two ratios, 4 and 2. Since the ratio is not consistent for all the values of $u$ and $v$, then the table does not show a direct variation between $u$ and $v$. We say that $u$ does not vary directly with $v$.
Example
| Table 1 | |
|---|---|
| $x$ | $y$ |
| 1 | 5 |
| 2 | 10 |
| 4 | 20 |
| 8 | 80 |
| Table 2 | |
|---|---|
| $x$ | $y$ |
| 1 | $\frac{1}{4}$ |
| 2 | $\frac{1}{2}$ |
| 4 | 1 |
| 8 | 2 |
| Table 3 | |
|---|---|
| $x$ | $y$ |
| 1 | 0 |
| 2 | 4 |
| 4 | 6 |
| 8 | 8 |
In Table 1, the values 1, 2, and 4 correspond to a value in $y$ with a ratio of 5. However, when $x=8$, $y$ is 80, giving a ratio of 10, which is not equal to the ratio of the first three values in $x$. Thus, Table 1 does not represent a direct proportion.
Note that the values of $y$ in Table 2 yield a quarter of their corresponding value in $x$. This means that all the ratio between values of $x$ and $y$ is equal to $\frac{1}{4}$. Thus, Table 2 shows that $y$ varies directly with $x$.
Finally, in Table 3, you can see that when $x=1$, $y=0$. This means that the ratio is zero. Note that the constant of variation should not be equal to zero. Therefore, the relationship between the variables in Table 3 does not show a direct variation.
FAQ
Which Equation Is a Direct Variation Function?
Functions of the form $f(x) =kx$, where $k$ is a constant, are the only functions that can represent a direct variation. This is because direct proportion is represented by the direct variation formula that is given by $y=kx$.
Moreover, take note that there are no other possible functions that can represent a direct proportion. Let’s take a look at these examples to understand why.
Example
Consider the function $f(x) = 5x$. This is a function that shows direct proportion because the variable $x$ is multiplied by a constant 5. Opposite to it, the function $f(x) = 3x+1$ is not a direct proportion function. Even though $f(x)$ increases as the value of $x$ increases, the rate of increase is not constant. Thus, $f(x)$ does not vary directly with $x$.
So, which function has the greatest constant of variation? $f(x) = 2x$, $f(x) = x^2$, or $f(x) =\frac{x}{3}$? The answer is $f(x) =2x$. Note that the second equation is not a direct proportion equation because it is not on the form $f(x) = kx$. Moreover, the constant of variation of the function $f(x) = 2x$ is $2$, while $f(x) = \frac{x}{3}$ is $\frac{1}{3}$. Thus, $f(x) = 2x$ has the greatest constant of variation among these functions.
What are Graphs of a Direct Variation?
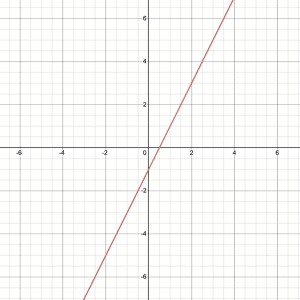
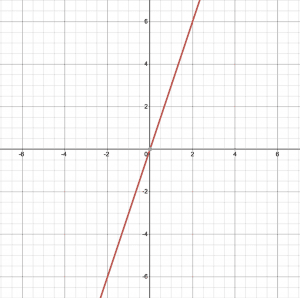
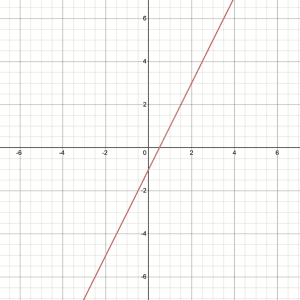
Graphs of linear equations that pass through the origin are the only graphs that represent direct variation. Moreover, it is not possible to have a function with translation because, in a direct variation, the graph of the linear function should pass through the origin. Any graph that is not linear automatically does not display a direct variation.
Let’s try this example. Which one of the graphs below represents the direct variation equation $y = 2x$?


What are Examples of Direct Proportion in Real Life?
Let us take a different view to see direct proportion relationships exist in real-world scenarios. Now, let us look at some examples involving direct variation in real life.
Thunderstorms are definitely something you are familiar with. During thunderstorms, lightning and thunder come together. The time it takes you to hear thunder varies directly with the distance you are from lighting.
- Suppose you are 4 kilometers away from where the lightning happened, and it takes you 2 seconds to hear the thunder. Using the direct variation equation $y=kx$, we let $y$ be your distance from the lightning and $x$ be the time it takes before you hear the thunder. Thus, we get that the constant of variation is $k=2$. This implies that if it took you 5 seconds before you could hear the loud crash of the thunder, then multiplying 5 by 2, we get 10. This means that the lightning struck 10 kilometers away.
- Name a few jobs where people were paid based on the total number of hours they have worked. This scenario represents direct variation between the number of hours you rendered to your work and the total amount of your paycheck.
The list of real-life problems where direct variation can be applied goes on. Now that we have learned how to show and determine whether there is a direct variation between two variables, you can also identify other real-life situations where direct variation exists.
What Is the Inverse Variation?
Example
Let’s consider these examples to better understand how inverse proportion works:
- Say $y$ varies inversely with $x$ by the constant 36, then $y$ is 9 whenever $x$ is 4.
- If $y$ varies inversely as $x$, and $x = 8$ when $y= 3$, then the constant of variation is 24 because $k=x\times y=8\times 3=24$.
- The following table shows an inverse proportion between $y$ and $x$ because as the values of $y$ decrease, the values in $x$ increase by a constant factor.
| $x$ | $y$ |
|---|---|
| 1 | 32 |
| 2 | 16 |
| 4 | 8 |
| 8 | 4 |
Conclusion
Two variables may or may not represent a direct proportion between their values. Direct variation shows a direct and consistent relationship between two variables that can be applied in real-life situations. Let us recall some of the important points we touched on in this article.
- We learned that $y$ varies directly with $x$ if $y$ increases (or decreases) at a constant rate as $x$ increases (or decreases).
- The direct variation equation is $y=kx$, where $k$ is the constant of variation.
- If the ratios between the values of the variables are equal, then the table of values represents a direct proportionality.
- A graph of a linear function that passes through the origin shows a direct proportion between the values on the $x$-axis and $y$-axis.
- The equation for inverse proportion is $y=\frac{k}{x}$, which means that $y$ increases (or decreases) at the same rate as $x$ decreases (or increases).
Determining whether a table of values represents a direct proportion is as direct as it could get. It will not take you that long to point out if the ratio between variables is constant. Like direct proportion, all you need to have is constant practice.
