JUMP TO TOPIC
Linear Graph – Explanation and Examples
A linear graph is a representation of a linear relationship in the Cartesian coordinate system.
Essentially, a linear graph is a straight line plotted on the $xy$ coordinate plane.
While linear graphs are an important geometric concept, they also play an important role in algebra and even calculus, which is concerned with finding tangent lines. Since many scientific relationships are linear, linear graphs can be used to convey important information and make predictions.
Before moving on with this section, it is a good idea to review slope of a line, linear equations, and graphing linear equations.
This topic covers:
- What is a Linear Graph?
- Linear Graph Examples
- Linear Graph Definition
What is a Linear Graph?
A linear graph is a representation of a linear relationship on the coordinate plane.
Recall that a linear relationship is one in which the dependent variable varies by a set amount for each one unit change in the independent variable. These linear equations also represent these relationships and can provide clues about the linear graph.
Each linear graph can be uniquely identified by two points or by a point and the slope. This slope is the change in the dependent variable for a fixed change in the independent variable. These values help graph an equation or determine its equation given a graph.
Typically, the dependent variable is $y$ and the independent variable is $x$.
Linear Equations
Linear equations express the linear relationship between two variables $x$ and $y$. Since each linear equation has a unique linear graph, either can be determined from the other.
There are three common ways to write a linear equation. These are slope-intercept, point-slope, and standard form.
First, slope-intercept form is $y=mx+b$. As the name implies, slope-intercept makes it easy to identify the slope, $m$, and the $y$-intercept, $b$, of the function. This is the point where the line crosses the $y$ axis, which is the point where $x=0$.
Next, point-slope form is $y-y_1=m(x-x_1)$. This equation includes the slope, $m$, and any point, $(x_1, y_1)$, on the line. By distributing the slope and then adding $y_1$ to both sides, this equation becomes slope-intercept.
Finally, standard form is $Ax+By=C$. In this form, $A, B,$ and $C$ are whole numbers, $A$ is non-negative, and $A, B,$ and $C$ do not have any common factors. This form gives two points, the $x$-intercept and the $y$-intercept. They are, respectively, equal to $\frac{C}{A}$ and \frac{C}{B}$.
Given any of these equations, it is possible to graph a line. Additionally, given a linear graph, it is possible to write all three of these equations.
Linear Graph Examples
Many well-known relationships have a corresponding linear graph. These include pressure and depth, quantity and price, volume and mass, and many more.
Recall that density is the relationship between volume and mass, is a linear relationship. For example, the density of water is $997$ kg/m$^3$. This means that for every additional meter cubed of water in a container, the mass increases by $997$ kg.
Since no water has no mass, the $y$-intercept is $0$. Therefore, the slope-intercept equation for the density of water is $y=997x$.
Linear Graph Definition
A linear graph is a representation of the linear relationship in the xy-coordinate plane. This will take the form of a straight line, which can be uniquely determined by two points or by one point and a slope.
How to Plot a Linear Graph
Plotting a linear graph is possible using the slope-intercept equation of the line, the standard equation of the line, two given points, or a point and the slope.
Common Examples
This section goes over common examples of problems involving linear graphs and their step-by-step solutions.
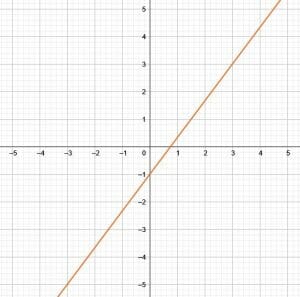
Example 1
Find slope-intercept form of the given graph.
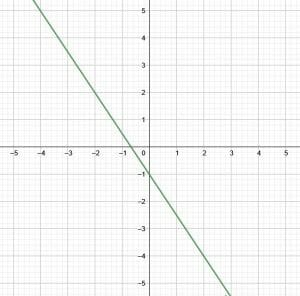
Solution
First, find the $y$-intercept, which is the point where the graph crosses the $y$-axis. In this case, the $y$-intercept is $-1$.
Now, the formula for slope is $m = \frac{y_1-y_2}{x_1-x_2}$ where $(x_1, y_1)$ and $(x_2, y_2)$ are points on the graph. In addition to the point $(0, -1)$, the $y$-intercept, the point $(-2, 2)$.
Then, plugging these values into the formula for slope gives $\frac{-1-2}{0+2} = -\frac{3}{2}$.
Finally, putting these values into the equation for slope-intercept, $y=mx+b$ gives $y=-\frac{3}{2}x-1$.
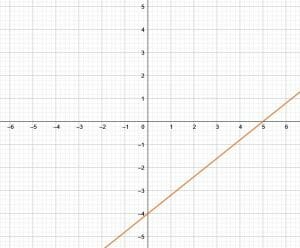
Example 2
Find standard form from the given graph.
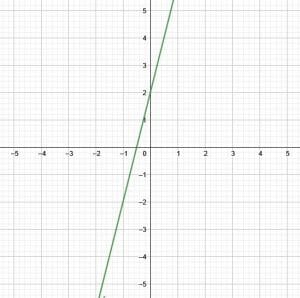
Solution
Recall that an equation in standard form has the format $Ax+By=C$, where $A, B,$ and $C$ are co-prime whole numbers and $A$ is positive. Also recall that the $x$-intercept is $\frac{C}{A}$ and the $y$-intercept is $\frac{C}{B}$.
This means that the $x$ and $y$ intercepts are a good place to start. In this case, both of these values are visible in the given graph.
Where $x=0$, $y=2$. Therefore, the $y$-intercept is $2$.
Similarly, where $y=0$, $x=-\frac{1}{2}$. Therefore, the $x$-intercept is $-\frac{1}{2}$.
Thus, $\frac{C}{A} = -\frac{1}{2}$ and $\frac{C}{B} = \frac{2}{1}$.
Now, let $C$ be the larger of the two given values for $C$. A fraction equivalent to $-\frac{1}{2}$ with $2$ in the numerator is $-\frac{2}{4}$.
Therefore, $\frac{C}{A} = -\frac{2}{4}$ and $\frac{C}{B} = \frac{2}{1}$. Thus $C=2$, $A=-4$, and $B=1$. Since $A$ must be positive, change the sign of the other two to get $C=-2$, $A=4$, and $B=-1$.
These numbers meet all of the requirements. Therefore, the equation in standard form 4x-y=-2.
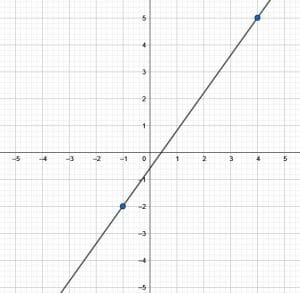
Example 3
A graph passes through the points $(5, 6)$ and $(11, 17)$.
Use these two points to make a graph and then find the equation for the line in slope intercept form and in standard form.
Solution
First, make the linear graph. To do this, first plot the points $(5, 6)$ and $(11, 17)$ on the coordinate plane. The first point is five units to the right of the origin and two units up. The second is eleven units to the right of the origin and seventeen units up.
Now, draw a line connecting these two points. This is the linear graph because two points uniquely identify it.
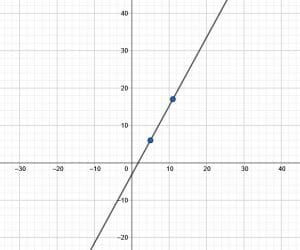
Next, use this information to find the equations for the line.
To find the slope, find the difference between the $y$ values of the two given points and divide that by the difference between the $x$ values of the two given points. This is $m = \frac{17-6}{11-5} = \frac{11}{6}$.
Now write an equation in slope-intercept form by first writing an equation in point-slope form. Either of the given points will work, but the point $(5, 6)$ has smaller values. The point-slope equation is therefore:
$y-6=\frac{11}{6}(x-5)$.
This simplifies to $y=\frac{11}{6}x-\frac{55}{6}+6$.
Simplifying further yields $y=\frac{11}{6}x-\frac{19}{6}$, which is the equation in slope-intercept form.
Now, there are a couple ways to convert this equation into standard form. Note that it is possible to use the intercept method from Example 2, but it is also possible to get $x$ and $y$ on one side of the equation and everything else on the other side. This is the method used here.
Next, moving all the variables to one side yields $y-\frac{11}{6}x=\frac{-19}{6}$.
Then, use multiplication to make $A, B,$ and $C$ co-prime numbers and $A$ positive.
First, multiply by $-1$ to get:
$\frac{11}{6}x-y = -\frac{19}{6}$.
Now, multiply by $6$ to get rid of the denominators:
$11x-6y = -19$.
Since there are no common factors for these three numbers, this is the standard equation of the linear graph.
Example 4
A line with a slope of $-\frac{5}{2}$ passes through the point $(9, -4)$. Make a linear graph corresponding to this line and find the equation for the line in slope-intercept and standard forms.
Solution
To graph this function using only the information given, find the point $(9, -4)$ on the graph. This is the point that is $9$ units to the right of the origin and $4$ units below it.
Then, use the slope to find a second point. Since the slope is $-\frac{5}{2}$, find a point that is $5$ units down and $2$ units to the right of the given point. This is the point $(9+2, -4-5)$ or $(11, -9)$.
Now, since there are two points, connect the two points with a line and extend it beyond the two points in each direction. Include arrows to show that the line goes to infinity. This is the linear graph of the line.
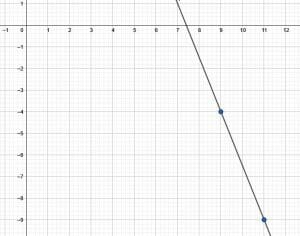
Next, find the two equations. Since neither intercept is easily visible, use the point-slope formula to derive the other two.
Now, point-slope using the original, given point is:
$y+4=-\frac{5}{2}(x-9)$.
This simplifies to:
$y=-\frac{5}{2}x+\frac{45}{2}-4$.
Next, combining terms gives:
$y=-\frac{5}{2}x+\frac{37}{2}$.
This is slope intercept form. To convert this to standard form, move both of the variable terms to the left side. This is:
$\frac{5}{2}x+y=\frac{37}{2}$.
Since all of the terms must be whole numbers, multiply each side by $2$. This yields:
$5x+2y=37$.
Thus, this is the standard form of the equation.
Example 5
The slope-intercept form of equation for a linear equation is $y=\frac{4}{3}x-1$.
First create the linear graph for this line, and then find the standard form of the equation from the given slope-intercept form.
Solution
Recall that the slope-intercept form of the equation gives one point, namely the $y$-intercept and the slope, which can be used to find a second point.
In this case, the $y$-intercept is $-1$, which means that the point is $(0, -1)$.
Since the slope is $\frac{4}{3}$, finding another point on the line means finding a point that is four units up and three units to the right of the intercept. This point is $(4, -1+3)$ or $(4, 2)$.
To create the linear graph, first connect these two points, extend the line segment in both directions, and draw arrows on the end to show that it extends to infinity.
Next, find the standard form of the equation using the given slope-intercept form. First, move all the variables to the same side of the equation to get:
$-\frac{4}{3}x+y=-1$.
Since $A$ must be a positive whole number, multiply each side by $-3$ to get:
$4-3y=3$.
Thus, this is the standard form of the equation.
Practice Problems
- In the given linear graph, what are the $x$ and $y$ intercepts of the line?

- What is the equation of the given linear graph given in question one in slope-intercept form and in standard form?
- A line passes through the points $(-1, -2)$ and $(4, 5)$. Graph the linear function and find the equation of the line in slope-intercept and standard forms.
- A line with a slope of $\frac{2}{3}$ passes through the point $(5, 1)$. Find the linear graph and then find its equations in slope-intercept and standard form.
- A linear graph has the equation $7x-5y=2$. Find the linear graph and the equation for it in slope-intercept form.
Answer Key
- The $x$ intercept of the line is $5$, and the $y$ intercept of the line is $-4$.
- This equation in slope-intercept form is $y = \frac{4}{5}x-4$. In standard form, it is $4x-5y=20$.
- This line is:
 . It’s slope-intercept equation is $y = \frac{7}{5}x – \frac{3}{5}$. Similarly, standard form of the equation for this line is $7x-5y = 3$.
 - This is the line described:
 . This line’s slope-intercept equation is $y = \frac{2}{3}x-\frac{7}{3}$. On the other hand, it’s standard form equation is $2x-3y = 7$.
 - This graph has intercepts of $\frac{2}{7}$ and $\frac{2}{5}. It’s graph looks like this:
 . In slope-intercept form, it’s equation is $y = \frac{7}{5}x-\frac{2}{5}$.
 . It’s slope-intercept equation is $y = \frac{7}{5}x – \frac{3}{5}$. Similarly, standard form of the equation for this line is $7x-5y = 3$.
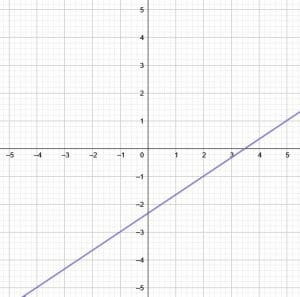 . This line’s slope-intercept equation is $y = \frac{2}{3}x-\frac{7}{3}$. On the other hand, it’s standard form equation is $2x-3y = 7$.
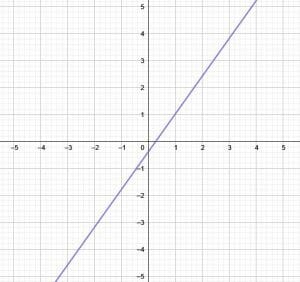 . In slope-intercept form, it’s equation is $y = \frac{7}{5}x-\frac{2}{5}$.
Images/mathematical drawings are created with GeoGebra.