JUMP TO TOPIC
The shape of distribution helps us understand the spread and behavior of a given distribution. With visual representations such as the distribution’s shapes, we can easily represent important data components and help others understand how our data behave visually.
The shape of distribution provides helpful insights about the distribution. This includes the distribution’s peaks, symmetry, uniformity, as well as its tendency to lean towards the left or right corner.
Thanks to the shape of the distribution, identifying the descriptive statistics of the distribution will be much easier. This also means that the distribution’s shape will come in handy when reporting and observing distributions.
In this article, we’ll show you the fundamental features of a distribution’s curve and how to use these factors to describe the shape of a given distribution.
What Is the Shape of the Distribution?
The shape of the distribution is a helpful feature that easily reflects the frequency of values within given intervals. When given a distribution and its shape, here are other helpful details we can learn about a data set from the shape of its distribution:
- Represents how spread out the data is across the range
- Helps identify which range the mean of the data set lies
- Highlights the range of a given data set
As we have learned in the past, we can visualize distributions such as the frequency or probability distribution using histograms. The shape formed by the histogram represents the shape of the distribution.
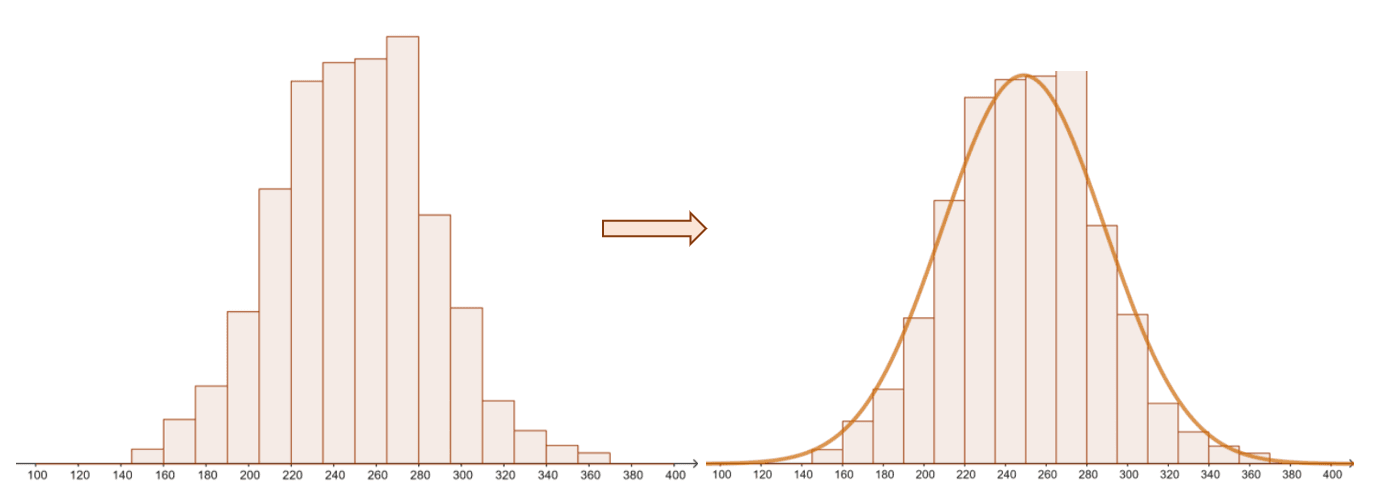
Here’s an example of a distribution and its shape. By inspecting its shape, we’ll have an idea of the peaks of the data set. The distribution’s shape also allows us to identify whether the distribution is skewed or symmetric, unimodal or bimodal, and more.
The shape of the distribution will depend on many factors, so let’s break down these factors and understand what they represent.
Factors Affecting the Shape of a Distribution
There are different factors that affect the shape of a distribution as discussed in the previous section. These factors also help us identify key measures of the distribution.
These are the factors that affect the shape of a distribution:
1. The number of peaks present in the distribution affects its shape.
- The peaks of a distribution’s shape often represent its mode/s.
- This means that when there is only one peak, the distribution is unimodal.
- Similarly, when the distribution has two peaks, we call it bimodal.
- When the shape shows three or more peaks, the distribution is multimodal.
2. As with a function’s curve, distributions and their shapes may or may not exhibit symmetry.
- When the distribution’s shape is folded and the left and right folds are each other’s mirror images, the distribution is symmetrical.
- When the shape of the distribution return folds that are not mirror images, the distribution is asymmetrical.
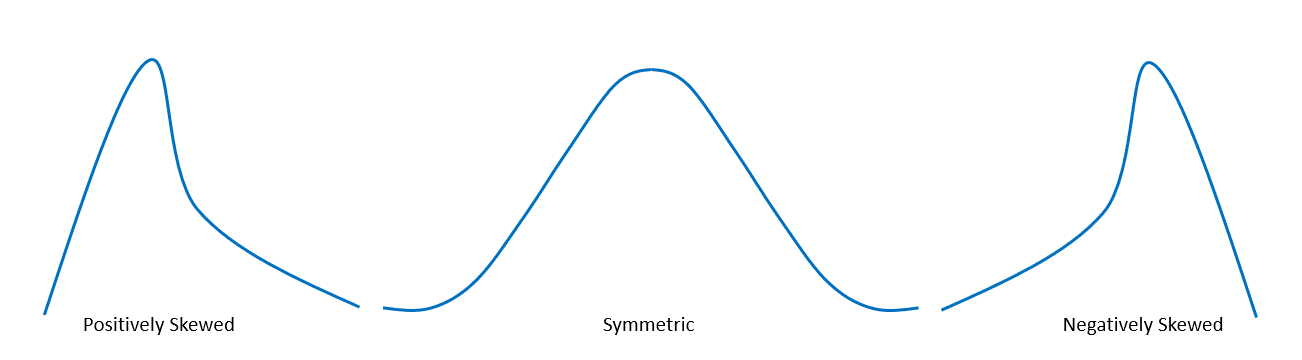
3. When the shape of the distribution is asymmetric, we can also see whether the distribution is positively or negatively skewed.
- When the shape of the distribution is leaning towards the right corner, the distribution is positively skewed.
- Meanwhile, when the shape of the distribution is leaning towards the left corner, the distribution is negatively skewed.
These are the properties needed for us to describe the shape of a given distribution. By being aware of these factors, we also immediately know the important components and behavior of the distribution. In the next section, we’ll explore different distributions and shapes to help you master the process of describing the shape of a distribution.
How To Describe the Shape of a Distribution?
Describe the shape of distribution by using the different factors affecting its shape: its peaks, symmetry, skewness, and at times, uniformity.
When given a table of distribution, use the steps below as a guide:
- Visualize the distribution using histograms or distribution.
- Apply appropriate techniques to construct the required distribution.
- Observe the curve’s shape – this represents the shape of the distribution.
- Use the features we’ve discussed to thoroughly describe the shape of a distribution.
After determining whether the shape or curve has one or more peaks, study the curve’s symmetry or lack thereof. When the distribution, such as the normal distribution, is symmetric, its mean, mode, and median will have the same values.
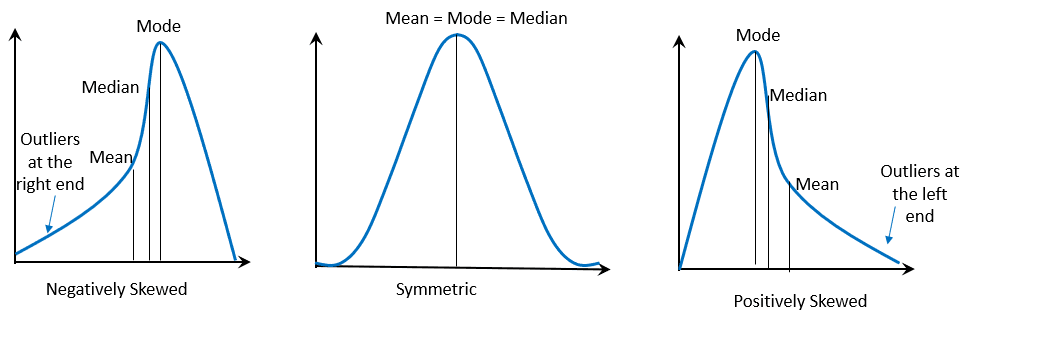
Now, how do we interpret curves that are positively or negatively skewed?
When the curve is negatively skewed, we expect that the mode has the largest value followed by the median and then the mean. Similarly, when the shape of the distribution is positively skewed, the mean has the highest value followed by the median and then the mode.
Here’s a table summarizing this interpretation:
Symmetry/ Skewness | Interpretation |
Negatively Skewed | Mean < Median < Mode |
Symmetric | Mean = Median = Mode |
Positively Skewed | Mean > Median > Mode |
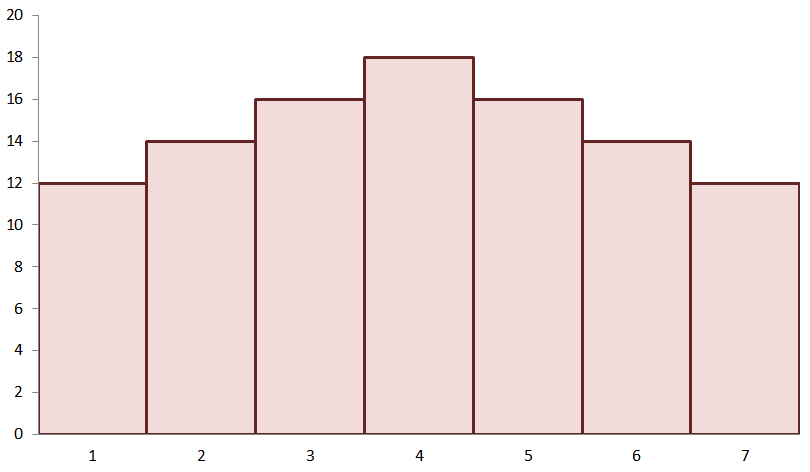
Suppose that we have the data of the test results from an online quiz of a virtual math class. The histogram of the frequency distribution is as shown below.
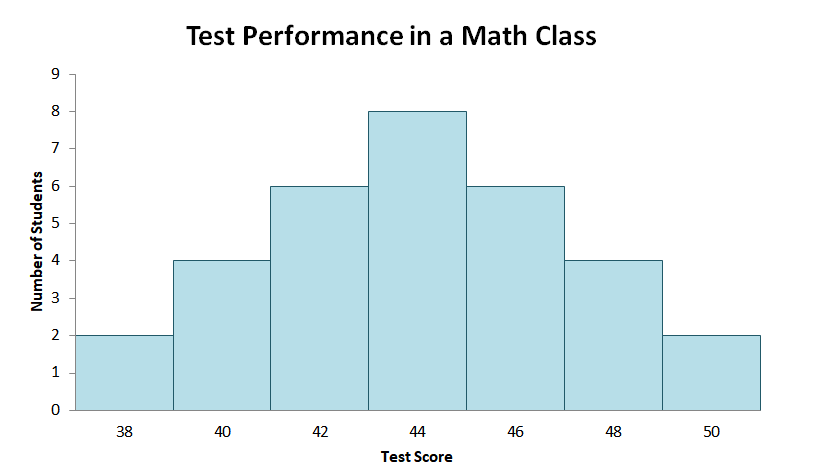
By observing the chart alone, we can see that the histogram is symmetric. This means that when we fold this chart, its left half will be the mirror image of its right. As we expect from a symmetric distribution, the chart only has one peak and consequently, one mode.
The peak occurs at $44$. Since the distribution is symmetric, we also expect the mean and the median to occur at the peak. This means that the average score of the students from the virtual math class is $44$.
When the line of symmetry lies on the peak of the distribution, we can also call the curve a bell-shaped curve. When it’s the reverse, where the line of symmetry lies at its minimum, we call the distribution a U-shaped curve.
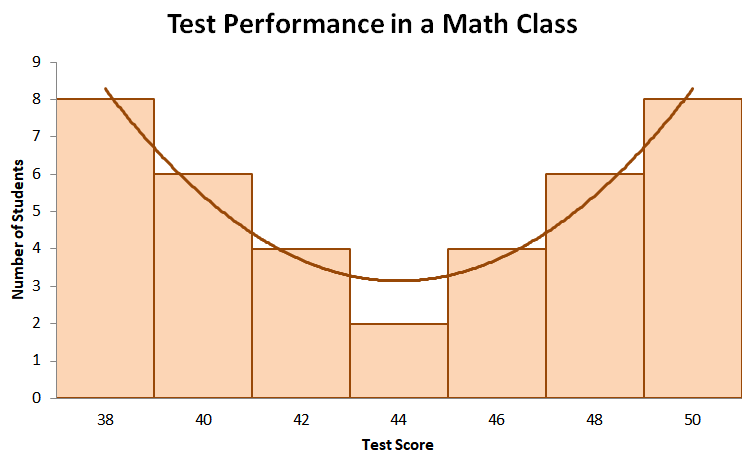
Suppose that we have the test results represented by the distribution shown above. From inspection, we can see that the distribution is also symmetric. However, the line of symmetry is at the test score, $44$, with the lowest peak.
Taking a look at its peaks, we can see that the mode occurs twice: when the test score is $38$ and when the test score is $50$. This means that the distribution is bimodal.
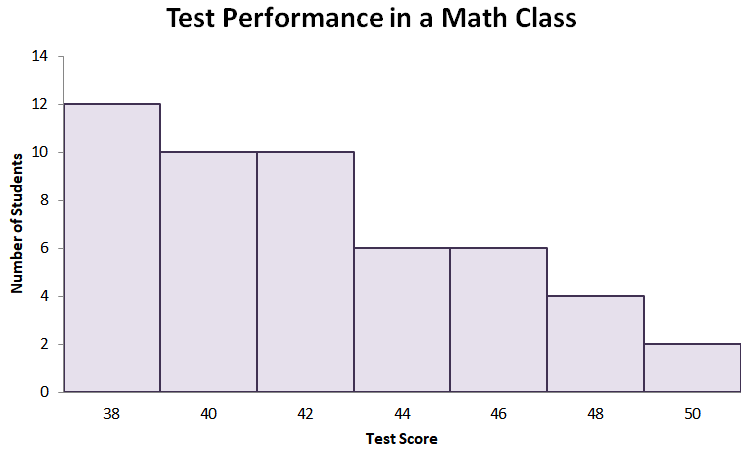
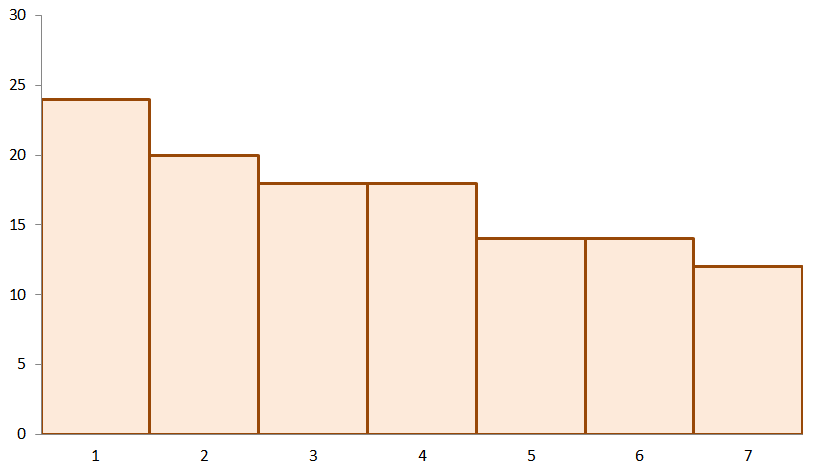
Let’s now take a look at the third distribution – a histogram that’s heavily skewed to the right. As we have expected, the distribution’s peak (or its mode) will lie within the lower end of the range. When the distribution is positively skewed, we also expect that the mode has the least value among the three central measures.
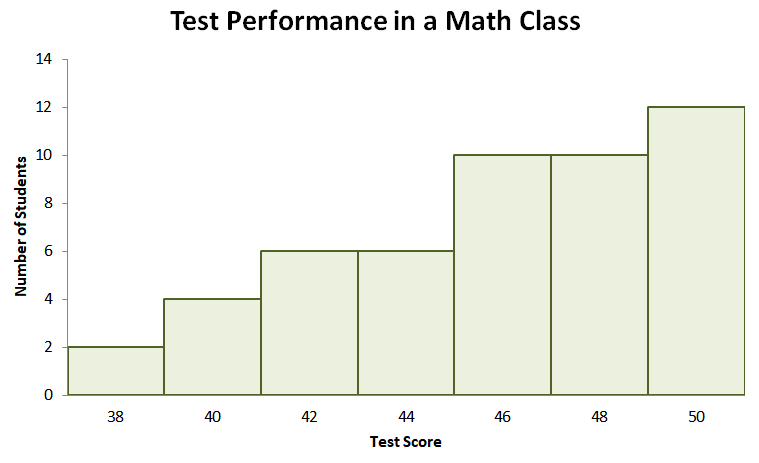
Last but not the least, what if we’re given a distribution such as the one shown above?
We can see that the distribution is skewed to the left where the peak lies at the higher end. As we have learned of the negatively skewed distribution, the mode will have the highest value.
These are just four examples of different distributions with different shapes. Don’t worry, we‘ve prepared more practice questions for you to work on. When you’re ready, head on over to the section below!
Example 1
Harry runs a convenience store with his partner. On Monday, he did a quick survey to understand his customers’ coffee size preferences. The convenience store currently offers four sizes: Small ($\$1.00$), Medium ($\$1.20$), Large ($\$1.40$), and XL ($\$1.60$). After one whole day of asking their customers who ordered coffee, Harry tallied the chart shown below.
Coffee Size | Number of Customers |
Small ($\$1.00$) | 24 |
Medium ($\$1.20$) | 12 |
Large ($\$1.40$) | 12 |
XL ($\$1.60$) | 24 |
What is the shape of the distribution that represents the chart shown above?
Solution
Sketching the data’s distribution, we’ll see that the histogram is symmetric with its lowest value found at the line of symmetry.
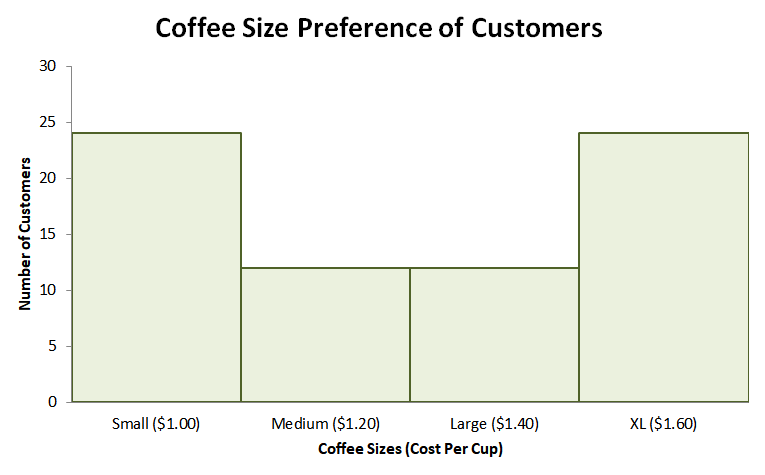
This means that we’re looking at a U-shaped curve. Aside from the distribution being symmetric, there is the same number of customers who ordered coffee in small and extra-large cups. From this, we can see that the distribution is also bimodal.
Practice Questions
1. Which of the following best describes the shape of the distribution shown below?
A. The distribution is unimodal and is symmetric.
B. The distribution is bimodal and is symmetric.
C. The distribution is unimodal and is skewed to the right.
D. The distribution is bimodal and is skewed to the left.
2. True or False: Using the same distribution, we can conclude that the mean and mode will have identical values.
3. By inspection alone, which of the following shows the correct statement about the distribution’s mean, mode, and median?
A. The mean, mode, and median of the distribution are all the same.
B. The mode has the smallest value while its mean has the largest value.
C. The mode has the smallest value while its median has the largest value.
D. The mean has the smallest value while its mode has the largest value.
4. Using the same graph from the previous problem, which of the following best describes the shape of the distribution?
A. The distribution is unimodal and is symmetric.
B. The distribution is bimodal and is symmetric.
C. The distribution is positively skewed.
D. The distribution is negatively skewed.
5. Jennifer asked her students the total number of hours they spend studying each day after attending their online classes. The distribution below is the result of her survey.
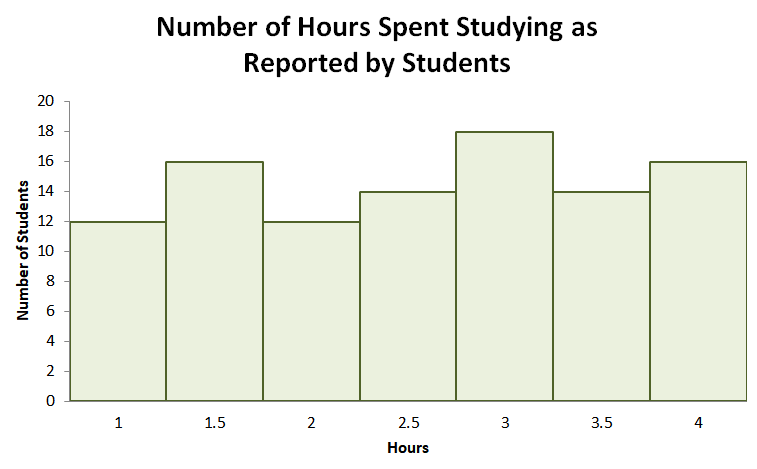
Which of the following best describes the distribution shown below?
A. The distribution is symmetric and has a bell-shaped curve.
B. The distribution is negatively skewed.
C. The distribution is positively skewed.
D. The distribution is symmetric and has a U-shaped curve.
6. True or False: From the same distribution, we can conclude that the mean number of hours spent studying is $3$.
Answer Key
1. A
2. True
3. D
4. D
5. B
6. False