Graphing Exponential Functions – Explanation and Examples
 Graphing exponential functions allows us to model functions of the form ax on the Cartesian plane when a is a real number greater than 0.
Common examples of exponential functions include 2x, ex, and 10x. Graphing exponential functions is sometimes more involved than graphing quadratic or cubic functions because there are infinitely many parent functions to work with.
Before learning to graph exponential functions, it is a good idea to review coordinate geometry and exponents generally.
This topic will include information about:
- How to Graph Exponential Functions
- The y-intercept
- Horizontal Asymptote
- Horizontal and Vertical Shifts
- Reflections
- Stretch and Compression
- Graphing with Tables
- Euler’s Number
How to Graph Exponential Functions
Graphing functions of the form ax, where the base, a, is a real number greater than 0, is similar to graphing other functions. In particular, it is important to learn the shape of the parent function. From this, we can make various transformations, including shifting the graph to the left and the right, reflecting it, and stretching it.
The y-intercept
Consider any function ax. No matter what real number we use for a, a0 will always be equal to 1. This means that, unless the graph has a vertical or horizontal shift, the y-intercept of an exponential function is 1.
Horizontal Asymptote
For what x-value does the function 2x=0?
This is, of course a trick question. Functions of the form ax are always strictly positive. Therefore, any exponential function will have a horizontal asymptote at 0 as x goes to negative infinity.
This is just a fancy way of saying that, as our x values get smaller and smaller, our y-values get closer and closer to zero. But, importantly, they will never quite reach it. An asymptote, then, is a line that the function gets infinitely close to but never actually touches or crosses. In this case, we can see that the x-axis is the asymptote of any exponential function (assuming no vertical shift).
As x goes to positive infinity, the function will get bigger and bigger. In fact, exponential functions grow faster than any other type of function! This is why if we say that something is growing “exponentially,” it means it is adding up quickly.
Vertical and Horizontal Shifts
As with other functions, we can shift exponential functions up, down, left, and right by adding and subtracting numbers to x in the parent function ax.
In particular, we can shift the function horizontally by adding numbers to a directly in the form of ax+b. In particular, if b is positive, the function will shift b units to the left. If b is negative, the function will shift |b| units to the right. Remember that you can think of numbers added directly to x as being in a kind of “mirror world” where things are the opposite of what you expect. Therefore, negative numbers cause a right shift and positive numbers cause a left shift, the opposite of most things in mathematics.
If we add a number, c, directly to the exponential function ax as ax+c this will cause a vertical shift. If c is positive, the function will move upwards c units. Likewise, if c is negative, the graph will shift |c| units downwards.
Note that the horizontal asymptote of the function will move up and down with the vertical shift. For example, if the function moves upwards two units, the horizontal asymptote will move up two units to y=2.
Reflections
We can also reflect an exponential function over the y-axis or x-axis.
To reflect the function over the y-axis, we simply multiply the base, a, by -1 after raising it to the x power to get -ax. Note that the function (-a)x will not reflect the function but will change the function entirely because (-a)x changes depending on whether x is even or odd.
We can also reflect the function over the x-axis by multiply x by -1. That is, the function a-x is the reflection of ax over the x-axis.
Stretch and Compression
Multiplying f(x)=ax by any positive number other than one will stretch it or compress it. Specifically, numbers less than one will flatten the graph, while numbers greater than one will make it steeper.
Any of these graph transformations can be combined with others to create different kinds of exponential graphs.
Graphing with Tables
Although all exponential functions have the same general shape, we can create more accurate functions by using a table.
Generally, it is a good idea to find at least three points to five points. Including the y-intercept, one negative point, and one positive point can help us get the best idea of the shape of the graph. That is, finding the y-values of the function when x=-1, x=0, and x=1 will give us a good idea of how the graph of the function should look.
Euler’s Number
Euler’s number, e, is an irrational number. Approximated to the first three decimal places, it is 2.718. This number has a lot of unique properties and characteristics, including being useful for calculating compound interest, and it is almost always seen in the form ex.
The number e is also of special interest in calculus because the function ex has the derivative ex. This means that a tangent line drawn on the function ex at any point has a slope equal to ex! Pretty cool!
Euler’s number is also the base of the natural logarithm, ln. Logarithms are the inverses of exponential functions in the same way that subtraction is the inverse of addition or division is the inverse of multiplication.
Examples
In this section, we will go over common examples involving exponential functions and their step-by-step solutions.
Example 1
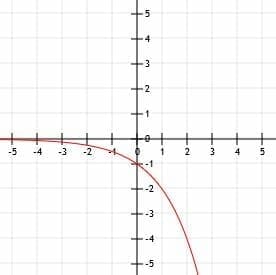
Graph the function y=2x. Use a table to help.
Example 1 Solution
The most important things to identify when graphing an exponential function are the y-intercept and the horizontal asymptote.
We know that for any function ax, the horizontal asymptote is the x-axis, y=0. Since there is not vertical shift in this function (that is, no numbers have been added to the end of it), the asymptote has not changed. Therefore, this function will go to 0 as x goes to negative infinity. It will also quickly grow to positive infinity as x goes to positive infinity.
Since this function has not moved left, right, up, or down, the y-intercept will not move either. Like all other exponential functions, then, y=2x will have a y-intercept at the point (0, 1).
Now, we can use a table to find a few more points and graph the function more accurately. Let’s find the values for -2, -1, 0, 1, 2, 3, and 4.
When x=-2, we have y=2-2=1/4.
When x=-1, we have y=2-1=1/2.
We already know that when x=0, y=1.
When x=1, 2, 3, and 4, we have y=21, y=22, y=23, and y=24. These functions simplify to 2, 4, 8, and 16 respectively.
Now, we can plot these points on a Cartesian plane and draw a smooth curve connecting them. Finally, to finish our graph, we can extend the left part of the curve along the asymptote y=0 as x gets smaller and smaller and extend it toward infinity as x gets larger and larger.
Example 2
Graph the function y=10x-1+3. Use a table to help you.
Example 2 Solution
This exponential function has more going on than the one we considered in example 1. As before, however, we will start by finding the horizontal asymptote and the y-intercept.
Looking at our function, we see that the base is 10 and that is raised to the power x-1. That is, the function is one unit to the right from the function 10x. Likewise, we add 3 to the entire function. This means that the function is three units above the parent function 10x. Thus, in total, the function is one unit to the right and three units above the original function.
Therefore, our horizontal asymptote will shift upwards 3 units as well to the horizontal line y=3. We can now use a table to find the y-intercept and other points. Let’s consider x=-1, x=0, x=1, x=2, and x=3.
When x=-1, we have y=10-2+3. This is equal to 1/100+3 or 3.01.
At the y-intercept, x=0, we have 10-1+3. This is the same as 1/10+3 or 3.1.
When x=1, we raise 10 to the power 0, which is 1. Therefore, y=1+3=4.
Similarly, when x=2 we have 101+3=13. When x=3, we have 102+3=103.
This function clearly grows very fast! From x=-1 to x=3, there is a difference of almost 100!
To finish graphing this function, we just draw the horizontal asymptote at 3 as x goes to minus infinity and draw an arrow pointing towards infinity as x gets larger and larger.
Example 3
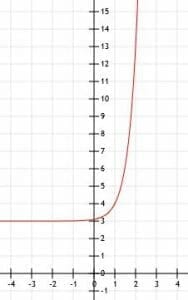
Compare the graphs of the functions f(x)=(1/5)5x and g(x)=5x. Use a table to help you.
Example 3 Solution
Let’s start with g(x)=5x since it is the simpler function. Like all basic exponential functions, it has a horizontal asymptote at y=0 and crosses the y-axis at the point (0, 1).
All of the y-values in the function f(x) will be 1/5 of the values of the corresponding values in g(x). This means that the function will cross the y-axis at a point (0, 1/5) instead of (0, 1). Its horizontal asymptote will not change, however, because there has not been any kind of vertical shift. Therefore, like g(x), f(x) has a horizontal asymptote at the line y=0.
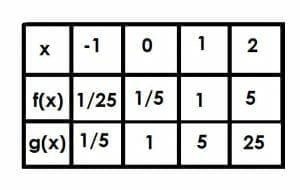
Now, let’s compare the two functions at the points x=-1, x=0, x=1, and x=2.
At x=-1, g(x) is 5-1, which is equal to 1/5. Therefore, f(x) will be 1/5 of this at 1/25.
We’ve already discussed x=0 since this is the y-intercept. The function f(x)=1/5, while g(x)=1.
When x=1, g(x)=51, which is just 5. Therefore, f(x)=1.
Finally, when x=2, g(x)=52=25. The function f(x) will be equal to 1/5 of g(x), and therefore f(x)=5.
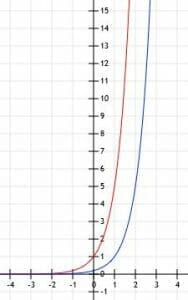
In this case, f(x)=g(x-1). This makes sense because if we consider the function 5x-1, we have 5x×51=1/5(5)x.
The graph of the functions looks like the one shown below.
Example 4
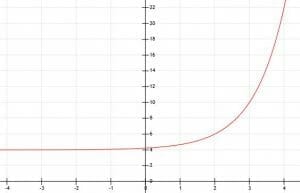
Graph the function y=2(3)x-2+4. Use a table to help you.
Example 4 Solution
The base of this function is 3. It is raised to the power x-2, which indicates a horizontal shift of 2. Likewise, since we add 4 to the whole function, there is a vertical shift of four units upward. Unlike example 2, however, we also have to account for a stretch by a factor of 2 indicated by the 2 in front of 3x-2.
The vertical shift tells us that the asymptote will also shift upwards 4 units. Therefore, as x goes to minus infinity, the values of y will go to positive 4 along the line y=4.
Now, we can use a table to find the values of 1, 2, 3, and 4. We use these numbers instead of -1, 0, 1, 2 because they will give us exponents of -1, 0, 1, and 2. For most numbers, these are the easiest powers to raise the number to, which means these are the easiest calculations to deal with. They are also some of the most important numbers on the graph because they are all around the y-intercept.
When x=1, we have 2(3)-1+4. 3-1 is 1/3, so our answer is 4+2/3, which is approximately 4.66.
When x=2, we have 2(3)0+4=2(1)+4=6.
Now, when x=3 we have 2(3)1+4=2(3)+4=10.
Finally, when x=4, we have 2(3)2+4=22.
Like some of the other examples, this function grows very quickly and gets large very fast. The graph below models this.
Example 5
Determine the algebraic expression of the exponential graph shown below:
Example 5 Solution
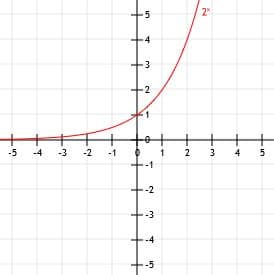
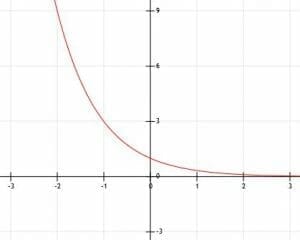
The prompt tells us that this function is exponential, but the shape indicates that as well. The only difference between what we see and a normal exponential function is that this one has been reflected over the x-axis. This means that there will be a -1 in front of a.
As the function gets smaller and smaller, the y-values go to zero but never quite get there. As the function gets larger and larger, the y-values get smaller and smaller. Therefore, there is a horizontal asymptote at the line y=0, the x-axis.
This function also crosses the y-axis at the point (0, -1). This means that there is no shift in the function apart from the reflection.
We need to find some other points, however, to determine the base, a, of the function.
It is pretty hard to determine numbers that do not lie on grid lines with much accuracy. Therefore, we will focus on positive x-values. We can see that this line also intersects the points (1, -3) and (2, -9). This means that, before we multiply the x-values by -1 and reflect them over the y-axis, a1=3 and a2=9. Thus, a must be equal to 3.
We can therefore conclude that the function is y=3-x.
Example 6
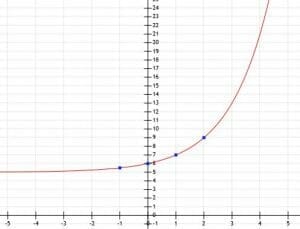
Determine the exponential function’s algebraic representation and its graph given the following points: (-1, 5.5), (0, 6), (1, 7), and (2, 9).
Example 6 Solution
Since this function crosses the y-axis at the point (0, 6), there has been a vertical shift. Specifically, the function has moved from (0, 1) to (0, 6), representing a shift upwards by 5 units.
The horizontal asymptote will also move up 5 units from y=0 to y=5.
Now, we know the function is of the form ax+5. To find ax, we should subtract 5 from each of the y-values given. In this case, we get (-1, 0.5), (0, 1), (1, 2), and (2, 4). The base is therefore a number such that a1=2 and a2=4. From this, it is clear that a=2.
Now, we have enough information to graph the function.
Example 7
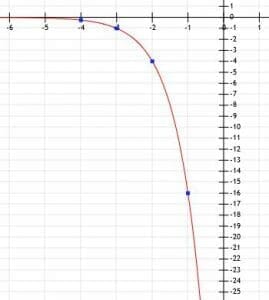
Let f(x)=(4)x. Let g(x) be the reflection of f(x) over the x-axis and shifted left three units. What is the graph and the algebraic representation based on a verbal description. Use a table to help.
Example 7 Solution
In this case, it is probably easiest to start by finding the algebraic representation of g(x) based on f(x) and the verbal description.
A reflection over the y-axis means that the whole function is multiplied by -1. Thus, so far, we have -4x. Remember that this is not the same as (-4)x.
Since the function also moves three units left, we need to add three to x directly. This gives us g(x)=-4x+3.
Now, we can use a table to find points on this graph. Let’s consider what happens when x=-4, x=-3, x=-2, and x=-1. Again, we pick these points because they raise the function to the powers -1, 0, 1, and 2, which are easy to work with.
When x=-4, we have g(x)=-4-1=-1/4.
At the point x=-3, we get g(x)=-40=-1.
Then, at x=-2 and x=-1, we get g(x)=-41=-4 and g(x)=-42=-16 respectively.
Therefore, our graph looks like this.
Example 8
What happens when a is less than 1? Let’s consider this by graphing y=(1/2)x. We will use a graph to help.
Example 8 Solution
We can probably guess that, since the function does not have any horizontal or vertical shift, that it crosses the y-axis at the point (0, 1). Quickly solving for x=0 gives us y=(1/2)0=1. Therefore, our intuition is correct.
Likewise, since there has not been any kind of shift, we can guess that the horizontal asymptote is y=0, the x-axis.
Let’s consider some of the other points, including x=-2, x=-1, x=1, and x=2.
At x=-2, we have y=(1/2)-2. This is the same as y=22=4.
Likewise, x=-1 is y=(1/2)1, which is the same as y=21=2.
We already know that the y-intercept is 0.
Now, when x=1, y=(1/2)1=1/2.
Similarly, when x=2, y=(1/2)2=1/4.
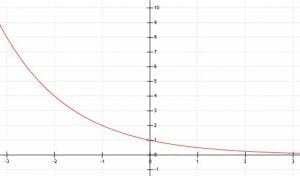
We can see that this function is the same as the function y=2x flipped over the y-axis! As x goes to positive infinity in this case, the function will get closer and closer to 0. Therefore, we were right that the horizontal asymptote is y=0, but it exists as the x values get infinitely large instead of infinitely small.
Why is this the case?
Recall that (1/2)=2-1. Therefore, y=(1/2)x is the same as y=2-x. Recall from earlier that multiplying x by -1 reflects this function (or any function, for that matter) over the x-axis. Therefore, it makes sense that these two functions are related!