JUMP TO TOPIC
Graphing Quadratic Functions
 Graphing quadratic functions models an x2 function in two-dimensional space. These functions will generally form a parabola.
The parabolic shape is often likened to a smiley face or a frowning face. Mathematically, such functions are called concave and convex or “concave up” and “concave down.”
Graphing quadratics requires a solid understanding of coordinate geometry and graphing. Make sure to review these concepts before moving forward.
This topic will cover:
- How to Graph a Quadratic Function
- How to Solve Quadratic Equations
How to Graph a Quadratic Function
Recall that quadratic functions have the form ax2+bx+c, where a, b, and c are real numbers. If the value of a is 0, then we simply have a linear function and can graph it like any other linear function.
When a is not equal to 0, however, we need to use the values of a, b, and c to tell us about the graph. In particular, we are interested in the vertex, the y-intercept, the x-intercept(s), and the general shape of the graph.
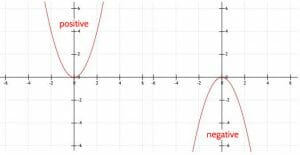
Shape
Every parabola will turn upwards like a smiley face or turn downwards like a frown. We call parabolas that curve upwards “concave” and parabolas that curve downward convex. Solutions of the former will extend to positive infinity as x goes towards positive or negative infinity. On the other hand, the y-values of the latter will extend to negative infinity as x goes towards positive or negative infinity.
Note that concave parabolas may also be known as concave up and convex parabolas may also be known as concave down.
We know whether the parabola of our quadratic function will turn upwards or downwards based on the value of a. If a is positive, the parabola turns upwards. If a is negative, the parabola points downwards. This makes sense because we reflect functions over the x-axis by multiplying them by a negative.
The Axis of Symmetry
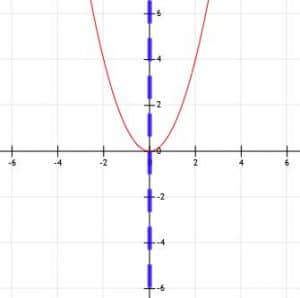
The function x2 is an even function. This means that the function has the same value for x and -x. This makes sense because (-x)2=x2.
Even functions have a line of symmetry equal to x=0, the y-axis. This means the graph of the function on one side is the mirror image of the graph of the function on the other side.
Not every quadratic function is even because some have an x term, but every quadratic function does have a line of symmetry. This line goes right through the vertex of the function. Therefore, since the vertex has coordinates (-b/2a, f(-b/2a)). Thus, the line of symmetry is x=-b/2a.
The y-intercept
The y-intercept of a parabola or any function is the point where x=0. This means we can find the y-intercept of a quadratic function by evaluating the function when x=0.
For a quadratic function of the form ax2+bx+c, we get a(0)2+b(0)+c=0+0+c.
Therefore, the y-intercept is (0, c).
Vertex
The vertex of a parabola is the lowest point of an upward pointing parabola and the highest point of a downward pointing parabola.
The vertex of a parabola is the point (-b/2a, f(-b/2a)). Note that, when we just have the function x2, the vertex is the origin, (0, 0).
This formula for finding the vertex may seem complicated, but it is actually related to certain points on the parabola. In order to find these, however, we have to know how to solve quadratic equations.
How to Solve Quadratic Equations
The “solution” of a quadratic equation is an x-value for which f(x)=0. That is, if we plug the value of x into the equation for the quadratic, it simplifies to 0. These will in turn be the x-values of the x-intercepts of the parabolas modeling f(x).
Note that not every parabolic function has an x-intercept. For example, if the vertex of the function is above the x-axis and the function points upwards or the vertex is below the x-axis and the function points downwards, the parabola will not cross the x-axis. Likewise, if the vertex of the function lies on the x-axis, the function will only have one x-intercept. Otherwise, the function will have two x-intercepts.
There are several ways to find these x-values. The simplest method is factoring, but we can also use the quadratic formula for x-intercepts that are not whole numbers.
Factoring
Some quadratic formulae of the form f(x)=ax2+bx+c are reducible to the form (x+d)(x+f), where d and f are whole numbers. If a quadratic equation can be so reduced, the graph of f(x) will cross the x-axis at the points (-d, 0) and (-f, 0).
This makes sense because if two numbers, a and b, are such that ab=0, the either a=0, b=0 or both.
Likewise, if (x+d)(x+f)=0, then x+d=0 (and x=-d) or x+f=0 (and x=-f).
To find d and f, we need to analyze the original equation. This is easiest when a=1, and f(x)=x2+bx+c.
Expanding (x+d)(x+f)=x^2+(d+f)x+df. Therefore, we are looking for two number, d and f, such that d+f=b and df=c.
We can find these two numbers by listing out factors of c and finding two that add to get b. If this is not obvious after a few trials or two such whole numbers do not exist, we can instead use the quadratic formula.
Quadratic Formula
The quadratic formula gives us the solution to the problem f(x)=0 for f(x)=ax2+bx+c. This is especially useful when a is not equal to 1, c has a lot of factors, or numbers d and f fitting the above requirements are not immediately obvious.
In some cases it is actually impossible to factor a function. For example, consider the quadratic function x2+10x+1. 1 only has two factors: 1, 1 and -1, -1. Clearly, neither of these add to 10.
This is where the quadratic formula can come in handy. The quadratic formula is x=(-b±√(b²-4ac))/2a. Yes, it is a little bit long, but committing it to memory can save a lot of time and frustration!
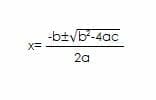
There are two answers to this formula: one for x=(-b+√(b²-4ac))/2aa and one for x=(-b-√(b²-4ac))/2a. The two x-intercepts of the equation are, therefore, ((-b+√(b²-4ac))/2a, 0) and ((-b-√(b²-4ac))/2a, 0).
Note that there are still situations when the quadratic formula does not yield any x-intercept(s). For example, if x2-4(3)(2) is negative, we have to take the square root of a negative number to find the x-intercept. Thus, the only solutions are in situations like these are in the complex number system, not the real number system.
Line of Symmetry
We can use these two x-intercepts to find the line of symmetry of a parabola. This is an imaginary vertical line that divides a parabola in half. This means it will go through the vertex of the parabola, so it will include the x-intercept of the vertex. We can then determine the y-intercept by finding f(x).
The line of symmetry will be exactly between the two x-intercepts. Therefore, the line of symmetry will also include the midpoint of the two x-intercepts.
We recall that the midpoint of the two points will be ((x1+x2)/2 0). We can therefore derive the line of symmetry as follows:
((-b+√(b²-4ac))/2a+(-b+√(b²-4ac))/2a)/2
This simplifies to –(2b/2a)/2=-b/a/2=-b/2a.
Thus, we conclude that the line of symmetry is x=-b/2a, and the vertex is (-b/2a, f(-b/2a)).
Using Graph Transformations to Graph Quadratics
We can also think about graphing a quadratic function by considering its parent function and how graph transformations affect this parent function.
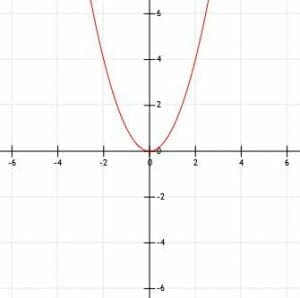
The simplest form of a quadratic equation is the function f(x)=x2, which looks like the graph below.
Multiplying this function by a negative reflects the function over the x-axis, turning the parabola upside down.
Shifting the Vertex
We can add numbers to the squared part of the function to shift the vertex left and right. Positive numbers will shift it to the left while negative numbers will shift it to the right. For example, the function (x-1)2 has a vertex one unit to the right of the parent function at (0, 1).
Likewise, we can move the vertex up and down by adding or subtracting numbers after the squared part. In this case, positive numbers will shift the vertex up while negative numbers will shift them down. For example, x2+1 has a vertex at (0, 1).
Compression and Dilation
We can also change how wide or skinny the graph is. To stretch the function and make it wider, we multiply the value of x by a number greater than 1. To compress the function, we multiply it by a number between 0 and 1.
Examples
In this section, we will go over common examples of questions involving graphs of quadratic functions and their step-by-step solutions.
Example 1
What are the x-intercepts of the graph of the quadratic equation f(x)=x2-12x+27?
Example 1 Solution
An x-intercept is a point where a function crosses the x-axis. These are the points (x1, 0) and (x2, 0). Remember that not every quadratic function has two x-intercepts. Some have one when the vertex lies on the x-axis. Other functions do not have any real x-intercepts. For example, if a function points upwards and its vertex lies above the x-axis, this function will not have an x-intercept.
The simplest way to find these points are to find two points d and f such that f(x)=(x+d)(x+f). In this case, we need two numbers such that d+f=-12 and df=27.
Fortunately, there are very few factors of 27:
1×27
-1×-27
3×9
-3×-9.
Since the b value is negative, we only need to consider the factors which are both negative.
Of these two, -1×-27 and -3×-9, -3+-9=-12=b. Therefore, d=-3 and f=-9.
Now, we know that we can factor this function into the two terms (x-3) and (x-9).
Therefore, when either of these terms is equal to 0, the whole function will equal 0. The first term is equal to 0 when x=-3, and the second is equal to 0 when x=9.
Thus, the solutions (that is, when f(x)=0) are 3 and 9, so the x-intercepts are (3, 0) and (9, 0). These are the x-intercepts of the parabola that models this function.
Example 2
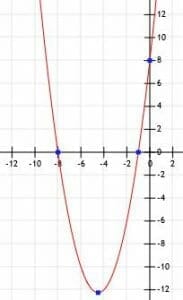
Find the vertex, y-intercept, and x-intercepts of the function f(x)=x2+9x+8. Then, graph the function.
Example 2 Solution
We can first find the y-intercept of the function by finding f(0)=c. In this case, c=8, so the y-intercept is the point (0, 8).
Now, we can find the x-intercepts, if they exist. First, let’s see if we can easily factor the expression x2+9x+8 into (x+d)(x+f) where d+f=b and f=c. The simplest way to do this requires that we find the factors of 8.
-1, -8
1, 8
-2, -4
2, 4.
Finding the sum of each of these pairs tells us that 1+8=9, so these two numbers satisfy the conditions for d and f. The x-intercepts are therefore -d=-1 and -f=-8. This means the x-intercepts are the points (-1, 0) and (-8, 0).
Finally, we need to find the vertex of this parabola. We recall that the x-coordinate of the vertex is -b/2a. Plugging in these values gives us:
-9/2.
The corresponding y-intercept is
f(-9/2)=(81/4)-81/2+8.
This simplifies to -49/4.
Therefore, the vertex is at (-9/2, -49/4)=(-4.5, -12.25).
Since the value of a is positive, the parabola will point upwards.
Thus, we know this parabola has vertex (-4.5, -12.25) and passes through the points (-1, 0), (-8, 0), and (0, 8). Therefore, we have enough information to graph the function, and the graph is shown below.
Example 3
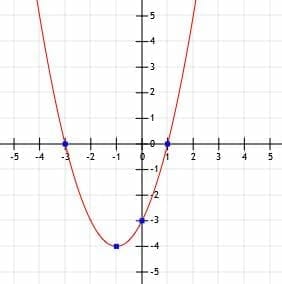
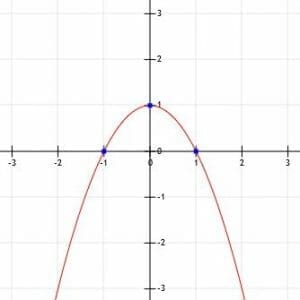
Identify the y-intercept, x-intercepts, and vertex of the function shown below.
Example 3 Solution
As before, we should start by identifying the y-intercept, (0, c). In this case, the graph crosses the y-axis at a point three units above the origin. Therefore, the y-intercept is at (0, 3).
Next, we should identify the x-intercepts of this function. It is clear that the graph crosses the x-axis at points -3 and +1. Therefore, the x-intercepts are (-3, 0) and (1, 0). This means that if we put -3 or 1 in for x in the algebraic expression for the function, it will simplify to 0.
Finally, we need to identify the vertex of this function. It might be easiest to do this by finding the midpoint between the two x-intercepts. This will be a point that runs through the axis of symmetry, a vertical line that cuts the parabola in half and also intersects the vertex. Here, the midpoint between (-3, 0) and (1, 0) is (-1, 0).
Therefore, the axis of symmetry is x=-1, and the vertex has an x-coordinate of -1.
Now, we can see what the lowest point on the graph is -4. Thus, this point is the vertex, (-1, -4).
We refer to these points (the vertex, the x-intercepts if they exist, and the y-intercept) as the key points of the graph.
In the following examples, we will use this same strategy to develop an algebraic expression for the parabolic function.
Example 4
Graph the function with vertex (0, 1) and x-intercepts 1 and -1 and identify the corresponding algebraic expression.
Example 4 Solution
First, let’s identify the y-intercept of this function. The function crosses the x-axis at (0, 1).
Interestingly, this is also the vertex of this function. This means that the axis of symmetry is also the y-axis, and the x-intercepts will be opposites of each other.
Looking at the x-axis, it appears that the function crosses the axis at the points x=1 and x=-1.
It’s also worth noting that the parabola points downwards. This means that the value of a is negative.
Now, we need to use this information to find the algebraic representation of this graph.
We know that the vertex of a function is (-b/2a, f(-b/2a)). Here, we know that -b/2a=0. Therefore, b=0.
Likewise, we know that f(0)=1. This means c=1.
We can use the x-intercepts to find the value of a. Note, however, that if this function did not have x-intercepts, we would have to find other points on the graph to do this.
We have f(1)=0. We know that the function has the form ax+1. Therefore, a(1)+1=0. Solving for a tells us that a=-1.
Thus, the algebraic form of this function is -x2+1.
Example 5
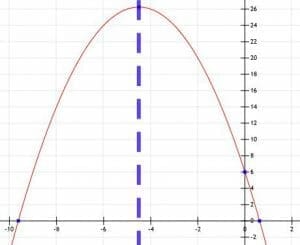
Graph the function -x2-9x+6 and the line of symmetry.
Example 5 Solution
Again, we need to find the y-intercept, x-intercept(s) should they exist, and the vertex.
We begin by noting that a is negative. Therefore, we will need to construct a parabola that points downwards.
Next, we find the y-intercept, which has the form (0, c). In this case, c=6, and the y-intercept is (0, 6).
To find the x-intercepts, we start by figuring out whether or not the function can be factored into two binomials. In this case, the factors of 6 are
1, 6
-1, -6
2, 3
-2, -3.
None of these add to -9. Therefore, we will have to use the quadratic formula to find the x-intercept(s).
The quadratic formula tells us that
x=(-b±√(b²-4ac))/2a.
Substituting the values gives us:
(9±√(81+24))/-2
(9±√(105))/-2
Thus, our two intercepts are:
(-4.5+√(105))/2 and (-4.5-√(105))/2.
These numbers approximate to -9.62 and 0.62. The line of symmetry runs through the point halfway between -9.62 and 0.62. That is, it runs through x=(-9.62+0.62)/2=-9/2=4.5.
Thus, the graph and line of symmetry are as shown.
Example 6
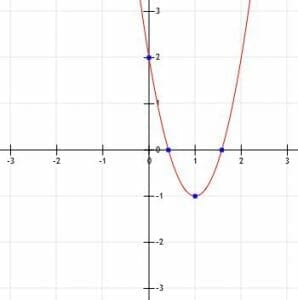
Graph the function 3x2-6x+2.
Example 6 Solution
Again, we start by finding the key points, including the y-intercept, x-intercept(s) if they exist, and the vertex. We also note that, since a is positive, the parabola will point upwards.
In this function, c=2. Therefore, the y-intercept is at the point (0, 2).
Now, we need to find the x-intercepts. Since the value of a in this function is greater than 1, it is probably easiest to find them by using the quadratic formula.
In this case, we have:
x=(6±√(36-4(3)(2)))/6
x=(-1±√(12))/6.
Separating the two, we get:
x=1+1/(3√3) or x=1-1/(3√3).
The decimal approximations of these two numbers are 1.58 and 0.42.
Finally, the vertex of this function is going to be at the point x=-b/2a In this case, the vertex will have the x-coordinate 6/((2)(3))=1. The y-value will be at f(1)=3-6+2=-1.
Thus, the vertex is (1, -1).
Therefore, the graph of the function is as follows.