The horizontal shift occurs when a graph is shifted along the $\boldsymbol{x}$-axis by $\boldsymbol{h}$ units — either to the left or to the right.
Along with other transformations, it is important to know how to identify and apply horizontals on different functions — including trigonometric functions. This article covers all key concepts needed to master this topic!
What Is a Horizontal Shift?
A horizontal shift is a translation that shifts the function’s graph along the $x$-axis. It describes how it is shifted from one function to the right or to the left to find the position of the new function’s graph. In a horizontal shift, the function $f(x)$ is shifted $h$ units horizontally and results to translating the function to $f(x \pm h)$.
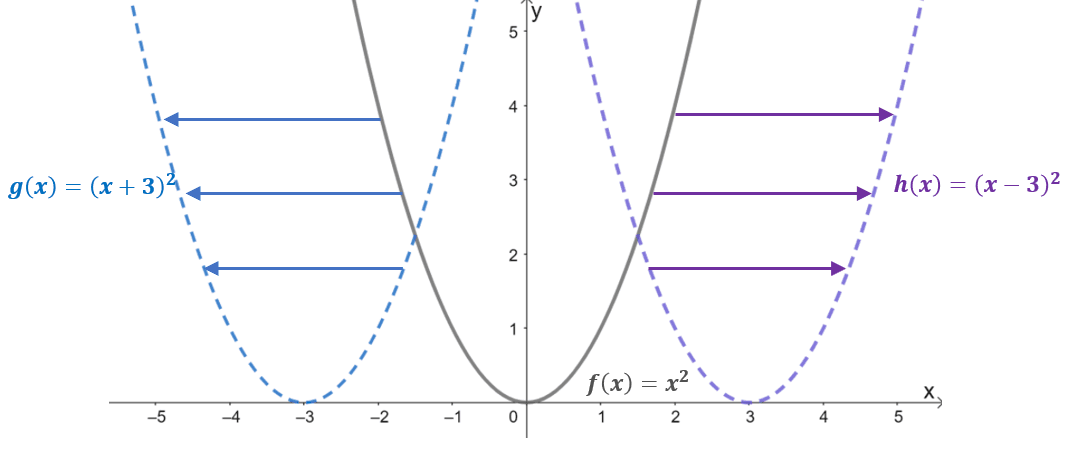
Take a look at the graphs of the three functions: $f(x) = x^2$, $g(x) = (x + 3)^2$, and $h(x) = (x – 3)^2$. With $f(x)$ as the parent function or the basic function of quadratic functions, the two remaining functions are the result of horizontally shifting $f(x)$.
- When $f(x) =x^2$ is shifted $3$ units to the left, this results to its input value being shifted $+3$ units along the $x$-axis. Hence, the translated function is equal to $g(x) = (x- 3)^2$.
- Similarly, when the parent function is shifted $3$ units to the right, the input value will shift $-3$ units horizontally. This results to the translated function $h(x) = (x -3)^2$.
This behavior is true for all horizontal shifts, so it’s best to establish a general rule on what to expect when the function $f(x)$ is shifted $h$ units to the right or $h$ units to the left.
Rules for the Horizontal ShiftSuppose that $h$ is greater than zero and when $f(x)$ is shifted $h$ units along the $x$-axis, it results in the following functions: 1. $\boldsymbol{y = f(x – h)}$ : a horizontal shift of $h$ units to the right. 2. $\boldsymbol{y = f(x + h)}$ : a horizontal shift of $h$ units to the left. When horizontally shifting a function or its graph, the size and shape of the function remain the same. |
To better understand how the coordinates of the function are affected after a horizontal shift, construct a table of values for $f(x) = x^2$, $g(x) = (x + 1)^2$, and $h(x) = (x – 1)^2$.
The table of values confirm that for $y = (x -1)^2$, the values of the function shift $1$ unit to the right. Similarly, the function’s values shift $1$ unit to the left for $y = (x + 1)^2$ compared to $y =x^2.
Understanding Horizontal Shift in Trigonometry
The horizontal shift is a helpful technique when graphing and studying trigonometric functions. In trigonometry, the horizontal shift is sometimes called a phase shift. The process remains the same: when the input value of a trigonometric function is shifted along the $x$-axis, its graph does the same.
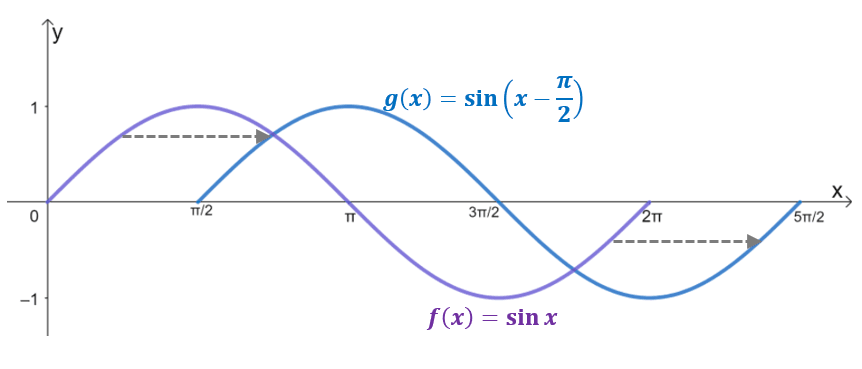
Take a look at the two graphs, $g(x)$ is the result of horizontally shifting $y= \sin x$ by $\dfrac{\pi}{2}$ units to the right. In fact, if the domain is limited up to $2\pi$, $g(x)$ reflects the graph of $y = \cos x$, confirming that $\cos x = \sin \left(x – \dfrac{\pi}{2} \right)$.
Graphing the trigonometric functions is much easier when transformations such as horizontal or phase shifts are applied. Since the graphs of fundamental trigonometric functions are studied and well-established, graphing them first then applying the shifts will be much easier.
Horizontal Shift for TrigonometryGiven trigonometric functions like the general form for sine shown below: \begin{aligned}y = A\sin [B(x – C)] + D \end{aligned} The horizontal shift is equal to $C$ units to the right. Similarly, for: \begin{aligned}y = A\sin [B(x – C)] + D, \end{aligned} the horizontal shift is equal to $C$ units to the left. |
This section has covered all the fundamentals of horizontal shift, so it’s time to learn how to apply horizontal translations. The next two sections will establish the process as well as cover examples of horizontal shifts.
How To Find the Horizontal Shift?
To find the horizontal shift applied on a graph or a function, determine the changes with respect to the $x$-axis.
- When given the graph, observe the key points from the original graph then determine how far the new graph has shifted to the left or to the right.
- When given the function, rewrite the expression to highlight $(x – h)$ and the value of $h$ to determine the horizontal shift applied to the function.
Use the rules and conditions established in the earlier section to solve problems involving horizontal shifts.
Finding the Horizontal Shift From a Graph
When given a graph, observe how far from the pre-image (normally the corresponding parent function) is the resulting image after being horizontally shifted by $h$ units.
- Case 1: If the resulting graph is $h$ units to the right of the graph, this means that from $f(x)$, the expression of the translated function is now $f(x – h)$.
- Case 2: If the resulting graph is $h$ units to the left of the graph $f(x)$, the expression of the translated function is now $f(x + h)$.
Use this guide to describe the horizontal shift that has occurred on a given graph. For example, to know the horizontal shift applied on the parent function of the function shown below, observe the movement on the translated graph from $y = x$ with respect to the $x$-axis.
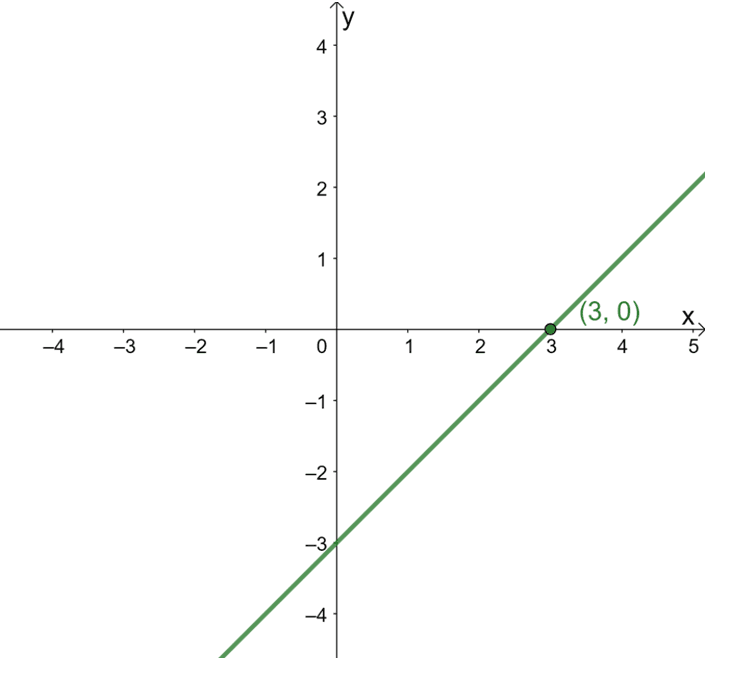
When describing the horizontal shift, focus on how the points and the curve of the function behave along the $x$-axis. Construct the graph of its parent function, $y =x$, to see how the point $(3, 0)$ has shifted.
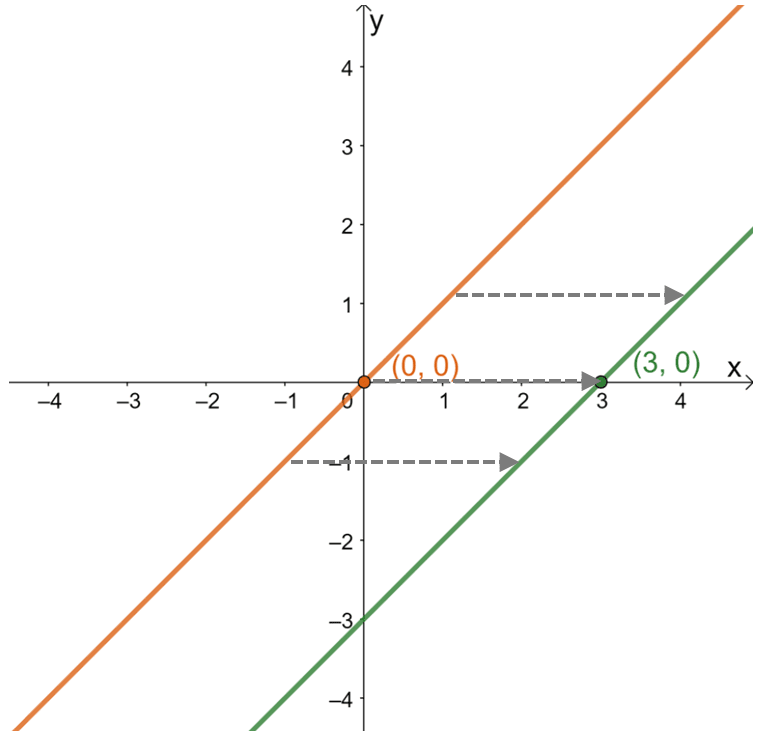
From this, it can be seen that from $(0, 0)$, the point has shifted to $(3, 0)$ or $3$ units to the right. This observation remains true for other points lying on the graph. This means that the parent function is shifted $3$ units to the right in order. From this information, it is also possible to find the function’s expression.
\begin{aligned}(0, 0) &\rightarrow (3, 0)\\ x &\rightarrow x – 3\\y=x &\rightarrow y=x – 3\end{aligned}
This means that by finding the horizontal shift, it has been shown that the function shown has an expression of $y = x – 3$.
Finding the Horizontal Shift From a Function
When given the function and its expression, find the horizontal shift by rewriting its expression to highlight the difference of the current function from its parent function.
\begin{aligned}f(x) \rightarrow f(x – h)\end{aligned}
Suppose that $f(x)$ represents the parent function and $f(x –h)$ is the translated function, the horizontal shift will depend on $h$. This is straightforward when working with simpler functions like $y = x -3$.
There are instances, however, when it’s challenging to identify the horizontal shift right away. Use the guide below to rewrite the function where it’s easy to identify the horizontal shift.
\begin{aligned}f(cx \pm d) &= f \left(c\left(x \pm \dfrac{d}{c}\right)\right)\end{aligned}
This means that when identifying the horizontal shift in $(3x + 6)^2$, rewrite it by factoring out the factors as shown below.
\begin{aligned}(3x + 6)^2 &= [3(x + 2)]^2\end{aligned}
This highlights the presence of horizontal shift and other transformations present in the function with respect to its parent function.
Example 1
Graph the functions $f(x) = x^3$ and $g(x) = (x + 1)^3$. Using the graph, describe $g(x)$ in terms of $f(x)$.
Solution
Construct a table of values for both functions to help construct their graphs. The table of values will also give a hint on the horizontal shift applied on $f(x)$ to get $g(x)$.
| \begin{aligned}\boldsymbol{x}\end{aligned} | \begin{aligned}-2\end{aligned} | \begin{aligned}-1\end{aligned} | \begin{aligned}0\end{aligned} | \begin{aligned}1\end{aligned} | \begin{aligned}2\end{aligned} |
| \begin{aligned}\boldsymbol{f(x)}\end{aligned} | \begin{aligned}-8\end{aligned} | \begin{aligned}-1\end{aligned} | \begin{aligned}0\end{aligned} | \begin{aligned}1\end{aligned} | \begin{aligned}8\end{aligned} |
| \begin{aligned}\boldsymbol{g(x)}\end{aligned} | \begin{aligned}-1\end{aligned} | \begin{aligned}0\end{aligned} | \begin{aligned}1\end{aligned} | \begin{aligned}8\end{aligned} | \begin{aligned}27\end{aligned} |
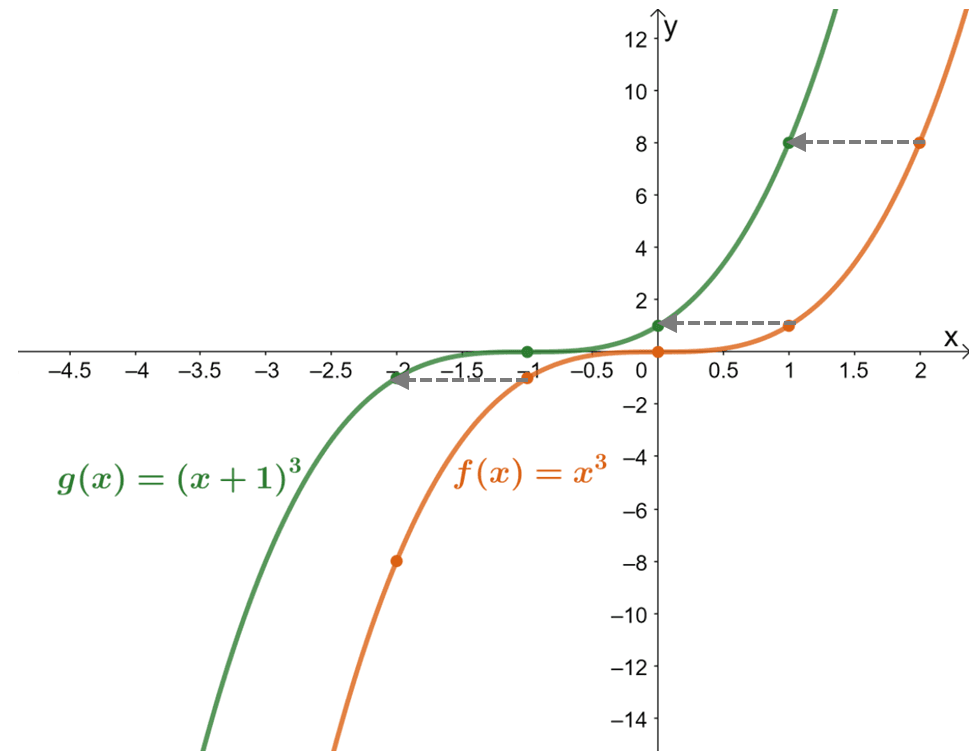
The table of values shows that the values of the function have been shifted one unit to the left. Now, double-checking this with the resulting graphs for the two functions, $g(x)$ is the result of shifting $f(x)$ $1$ unit to the right.
Example 2
Use horizontal shifting to show that $\cos \left(x- \dfrac{\pi}{2}\right)= \sin x$.
Solution
In one $xy$-plane, graph the curves of $\sin x$ and $\cos x$. Use the table of values when needed. Use the resulting graphs to observe how $\cos x$ is shifted to get to the curve of $\sin x$.
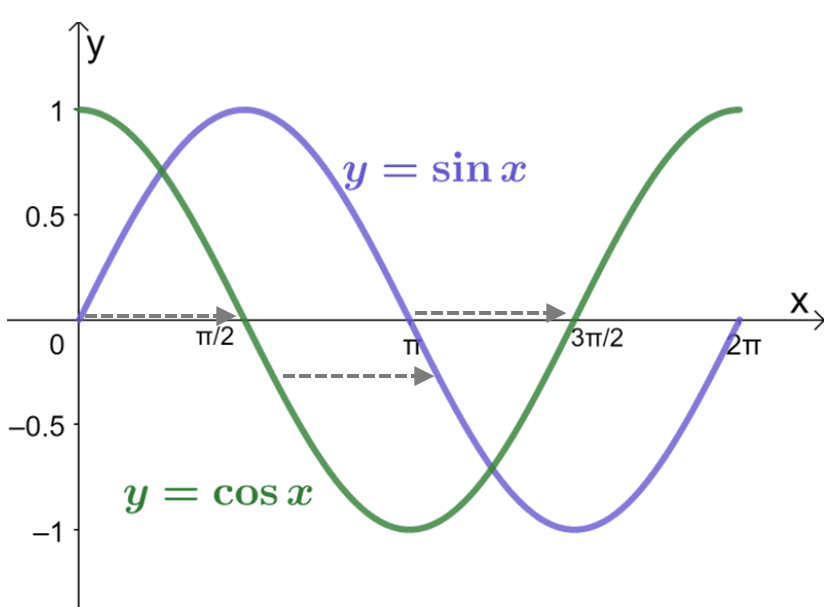
This shows that the curve of $\sin x$ is simply the result of shifting $\cos x$’s curve $\dfrac{\pi}{2}$ units to the right. This means that in terms of $\sin x$, $\cos x$ is equivalent to shifting the input value of $y =\sin x$ by $- \dfrac{\pi}{2}$.
\begin{aligned}\cos x = \sin \left(x – \dfrac{\pi}{2}\right)\end{aligned}
Practice Questions
1. Observe the graphs of $f(x)$ and $g(x)$ as shown below. Which of the following statements is true?
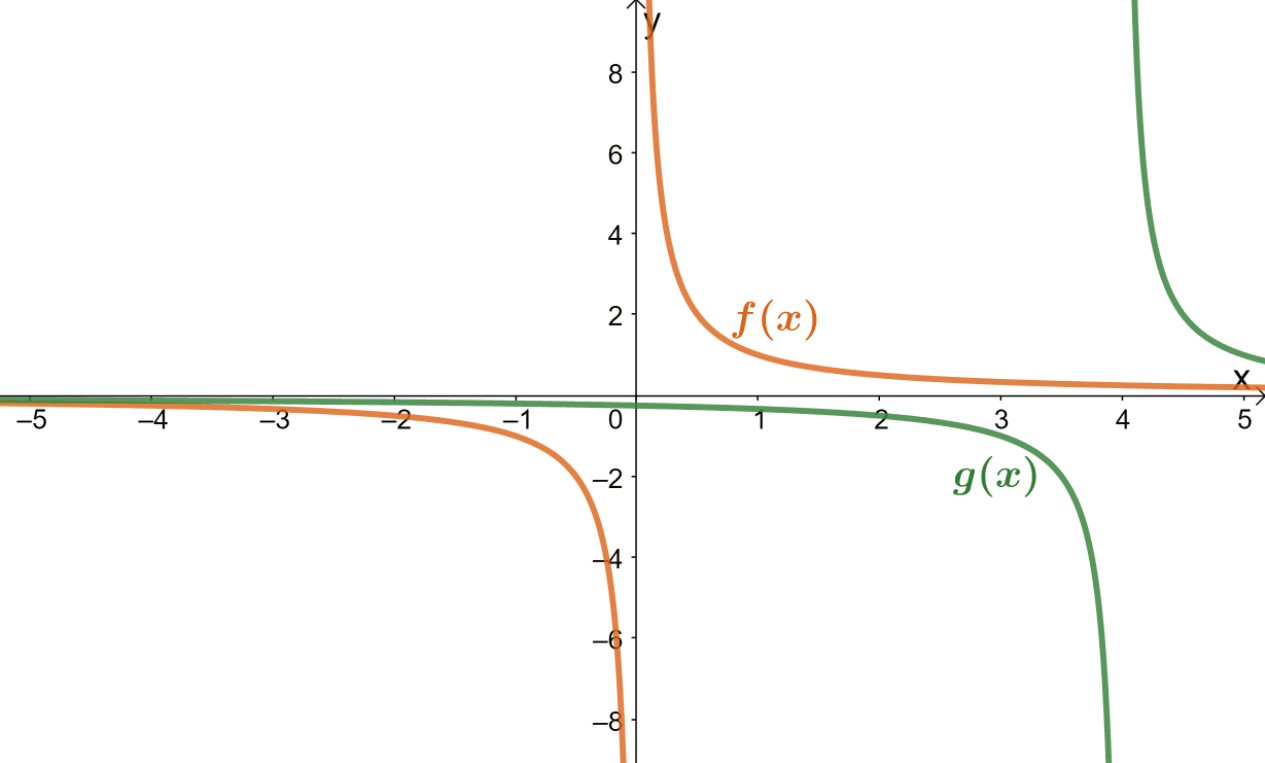
A. $f(x)$ is the result when $g(x)$ is translated $4$ units to the right.
B. $g(x)$ is the result when $f(x)$ is translated $4$ units to the left.
C. $g(x)$ is the result when $f(x)$ is translated $8$ units to the right.
D. $f(x)$ is the result when $g(x)$ is translated $8$ units to the right.
2. Suppose that $y = \sqrt{x}$ is shifted $15$ units to the left, which of the following shows the expression for the shifted function?
A. $y = \sqrt{x} – 15$
B. $y = \sqrt{x + 15}$
C. $y = \sqrt{15 -x}$
D. $y = \sqrt{x – 15}$
Answer Key
1. B
2. B
Images/mathematical drawings are created with GeoGebra.