JUMP TO TOPIC
Graphing Trig Functions – Explanation and Examples
Graphing trig functions requires finding the functions’ values at quadrantal angles and their periods.
It is also important to find the trigonometric functions’ values at major angles, determine whether they are odd, even, or neither, and find the intervals over which they are positive and negative.
The graphs of trig functions have important uses in many areas of science, including the study of electromagnetic waves and electronics.
Make sure to review trigonometric functions before graphing them. It may also help to take a more in-depth look at the graph of sine, cosine, and tangent.
How To Graph Trig Functions
In order to graph trig functions, you should know base graphs, know how to shift vertical and horizontal, know how to change period, and know the effect of vertical dilation. To graph trig functions, begin with the base graph for each of the six trig functions.
Sine and cosine have a wave shape.
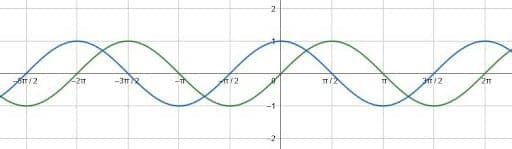
In the graph above, sine is green and cosine is blue.
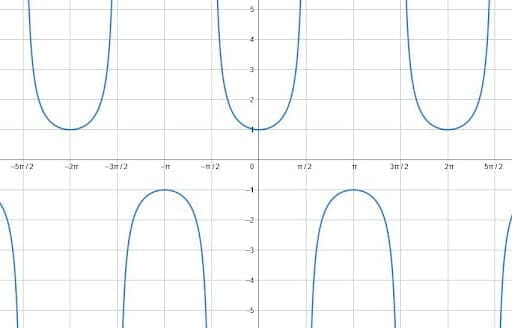
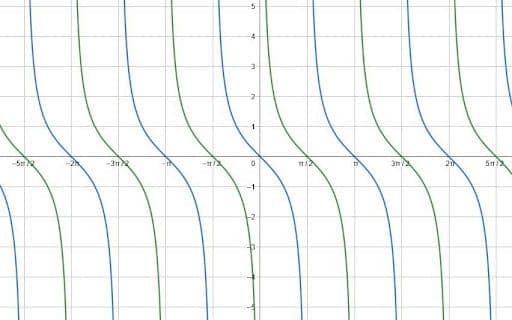
Cosecant and secant have alternating positive and negative periodic, parabolic graphs.
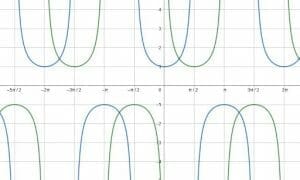
In the graph above, cosecant is the green graph and secant is the blue graph.
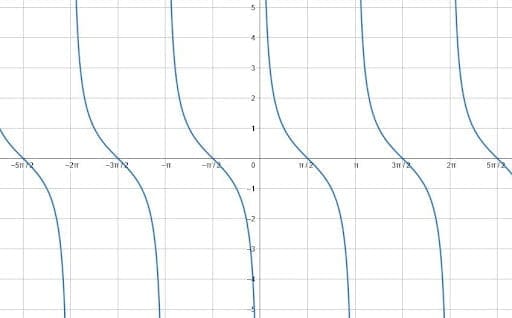
Tangent and cotangent have a periodic shape similar to an $x^3$ graph.

In the graph above, the tangent graph is green and the cotangent graph is blue. After these shapes become familiar, graphing transformations of these functions follows.
Each function has a midline at the x-axis and a fixed y-intercept. Each is also either $2\pi$ or $\pi$ periodic, meaning the graph repeats every $2\pi$ or $\pi$ radians.
Adding a vertical or horizontal shift changes the midline and y-intercept, respectively. Adding a coefficient to the function stretches or compresses the function vertically. Finally, adding a coefficient to the variable stretches the function horizontally, changing the period.
Vertical and Horizontal Shifts
Vertical and horizontal shifts change the midline and y-intercept of a trig function.
Each of the trigonometric functions has a midline. This is a horizontal line over which one can reflect the function. Then, reflecting the function over a vertical line halfway through a period maps the function back to itself.
This is easier to see.
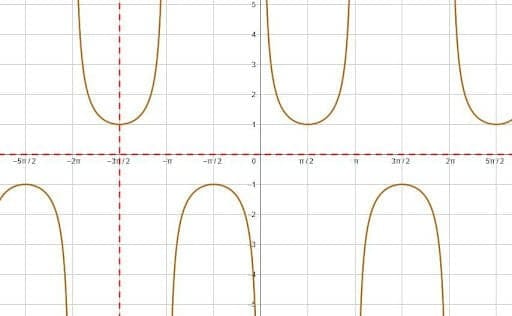
In this case, the function is cosecant. The midline is the x-axis, and the second picture shows a reflection over that. Then, the third picture shows the reflection over $\frac{3\pi}{2}$. There are, of course, other vertical lines that would have produced the same result.
Like cosecant, each of the trig functions has a base midline of $y=0$, the x-axis. Changing the midline requires adding a value, $d$, after the function. The new midline will be $y=d$.
These functions also have a y-intercept. It is easiest just to memorize these. For sine and tangent, this is $0$. For cosine and secant, it is $1$. Then, the y-intercept for cosecant and tangent is undefined. The limit from the right is positive infinity for both, and the limit from the left is negative infinity for both.
Adding a number, $c$, to $x$ inside the parenthesis shifts the function $c$ units to the left when there is no coefficient in front of the variable. The horizontal shift becomes more complicated, however, when there is a coefficient.
How To Find the Period of a Trig Function
To find the period of any given trig function, first find the period of the base function. The period of sine, cosine, cosecant, and secant is $2\pi$. For tangent and cotangent, the period is $\pi$. Then locate the coefficient of the variable. Call this number $b$.
The period of the function is its period divided by $b$. That is, for sine, cosine, cosecant, and secant, the period is $\frac{2\pi}{b}$, and for tangent and cotangent, it is $\frac{\pi}{b}$.
Examples
This section goes over common examples of problems involving graphing trig functions and their step-by-step solutions.
Example 1
Graph cosecant and secant, then compare the two graphs.
Solution
The secant and cosecant graphs have the same general shape. Each period consists of one positive and one negative parabolic shape right next to each other. Their vertices are $1$ (for the positive parabolic part) and $-1$ (for the negative parabolic part) in the base functions because the range for the two functions is $(-\inf, -1]$ and $[1, \inf)$. The “midline” is the horizontal line exactly between these vertices, which is the line $y=0$ for the base functions.
Like sine and cosine, secant and cosecant have periods of $2\pi$. Despite having the same period and same overall shape, however, the two functions are horizontally displaced from each other.
To graph these base functions, it is important to graph the y-intercept, which is the value the function takes at $0$ radians, and the values at other quadrantal angles. These include $\frac{\pi}{2}$, $\pi$, $\frac{3\pi}{2}$, and $2\pi$.
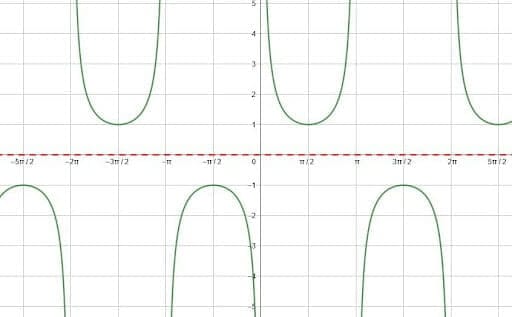
Cosecant
The values of sine at the quadrantal angles are $0, 1, 0, -1$ and $0$ for $0, \frac{\pi}{2}, \pi, \frac{3\pi}{2},$ and $2\pi$. Therefore, the values of cosecant at the quadrantal angles from $0$ to $2\pi$ are undefined, $1$, undefined, $-1$, and undefined.
To find out what is happening to the cosecant in the undefined segments, consider what sine is doing right before and right after. The sine is increasing on the interval $(-\frac{\pi}{2}, \frac{\pi}{2})$, the sine has very small values right after zero. Since cosecant is the reciprocal of sine, the cosecant will be one divided by a very small number, which will get closer to infinity as the numbers get closer to zero. That is, the limit as cosecant approaches zero from the left is positive infinity.
Similarly, as cosecant approaches pi radians from the left, the cosecant approaches infinity. From the left, however, it approaches negative infinity since the cosecant will be equal to one divided by very small negative numbers. Then, at $2\pi$ radians is negative infinity as cosecant approaches from the left.
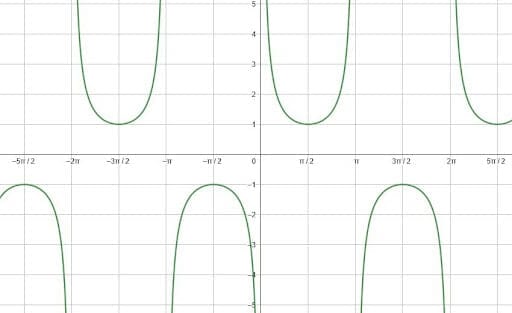
This represents one period for cosecant. Thus, the function looks like this.
Secant
Use a similar procedure to graph the secant.
At the quadrantal angles $0, \frac{\pi}{2}, \pi, \frac{3\pi}{2},$ and $2\pi$, cosine is equal to $1, 0, -1, 0,$ and $1$, respectively. Therefore, the secant, which is the reciprocal of cosine, will be equal to $1$, undefined, $-1$, undefined, and $1$.
At the undefined spots, find the limits by considering what is happening to cosine on either side of the x-intercepts. Cosine is decreasing at the points $(\frac{\pi}{2}, 0)$ and $(2\pi, 0)$, but it is increasing at the point $(\frac{3\pi}(2}, 0)$.
Therefore, the limit as secant approaches $\frac{\pi}{2}$ and $2\pi$ from the left will be positive infinity since it will be one divided by a very small positive number. As it approaches these two angles from the right, however, the secant will be one divided by a very small negative number. Thus, the limit will be negative infinity.
The opposite is true for the angle $\frac{3\pi}{2}$. As cosine approaches this angle from the left, it is negative, so the secant will have a limit of negative infinity. As it approaches from the right, however, its limit will be positive infinity since cosine values are positive here.
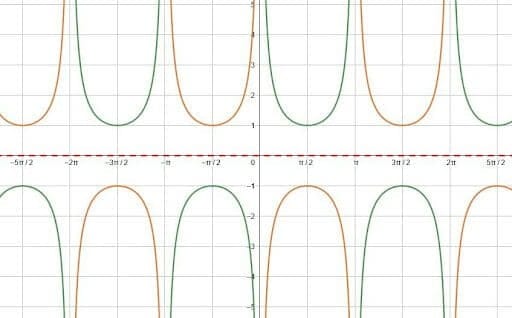
These points and limits represent one period of the secant. Thus, the graph will look like this.
Example 2
Graph a tangent function that maps to the cotangent function.
Solution
To do this, look at the two functions on the same graph.
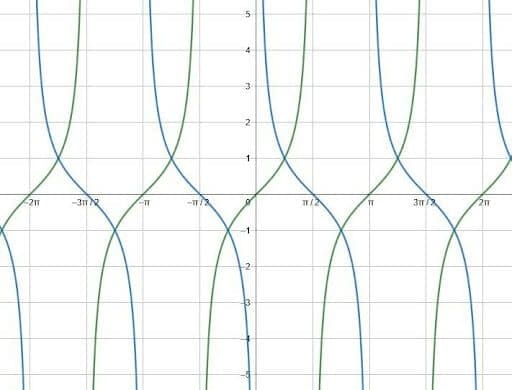
Here, the blue curve is tangent and the green curve is cotangent.
Note that the two have the same general shape, but they face different directions and have different y-intercepts.
To change the direction of the tangent, multiply the function by negative one. The resulting graphs look like this.
Now, the only difference between the two curves is a horizontal shift. Specifically, the negative tangent curves lie $\frac{\pi}{2}$ units to the left and right of the cotangent function. This is easiest to see at the x-intercepts.
Therefore, shifting the function $\frac{\pi}{2}$ units left or right maps the negative tangent to the cotangent. These functions are $-tan(x+\frac{\pi}{2})$ and $-tan(x-\frac{\pi}{2}$.
This all makes sense because it is a graphical version of one of the trigonometric cofunction identities. Specifically, the identity says that $cotx=tan(\frac{\pi}{2}-x)$. Since tangent is odd, this can be rewritten as $(-1)(-tan(\frac{\pi}{2}-x)) = -tan(x-\frac{\pi}{2})$.
Likewise, since tangent is pi-periodic, the function $-tan(x-\frac{\pi}{2})$ is the same as the function $-tan(x-\frac{\pi}{2}+\pi) = -tan(x-\frac{3\pi}{2}) = -tan(x-(-\frac{\pi}{2})) = -tan(x+\frac{\pi}{2})$.
Example 3
Find a sine and cosine equation for the function shown.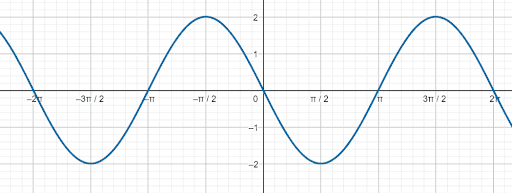
Solution
First, find a sine equation.
Although the y-intercept of the function is $0$, the function is decreasing instead of increasing. This means that it is $\pi$ units to the right, and there is a horizontal shift of $-\pi$.
Additionally, the amplitude of the function is $2$ instead of $1$. Therefore, there is a coefficient of $2$ in front of the function.
Thus, since there are no other changes, the sine equation for this wave is $2sin(x-\pi)$.
Now find a cosine equation for this graph.
Again, the amplitude of the function is $2$, so the entire function is multiplied by $2$.
Recall that the y-intercept of a cosine function is normally $1$. Here, the y-intercept is $0$, and the closest place where the function is $1$ is at $-\frac{\pi}{2}$ radians. Therefore, the function has been shifted left $\frac{\pi}{2}$ units.
Therefore, the cosine equation is $2cos(x+\frac{\pi}{2})$.
Example 4
What are the periods of the functions $cot(9x)$ and $sec(9x)$?
Solution
Begin with $cot(9x)$.
Recall that the period of tangent and cotangent is $\pi$ radians. Therefore, for any function $acot(bx+c)+d$, the period is $\frac{\pi}{b}$. In this case, this is $\frac{\pi}{9}$ since $b=9$.
Then, since secant is the reciprocal of the cosine, its period is $2\pi$. To find the period of a transformed secant function $asec(bx+c)+d$, divide $2\pi$ by $b$. In this case, $b=9$, so the period is $\frac{2\pi}{9}$.
Example 5
Find an equation that represents a cosecant function that has a period of $8\pi$ and a midline of $y=2$.
Solution
This cosecant function will have the form $acsc(bx+c)+d$.
Since its period is $8\pi$ and the period of the basic cosecant function is $2\pi$, it is possible to solve for $b$ using the equation $\frac{2\pi}{b} = 8\pi$. In this case, $b = \frac{1}{4}$.
Then recall that the midline is normally at the x-axis, the line $y=0$. Since the midline of this function is the line $y=2$, there is a vertical shift of $2$. Thus, $d=2$.
Since there are no other changes, the transformed function has the equation $y=csc(\frac{1}{4}x)+2$.
Practice Questions
Images/mathematical drawings are created using Geogebra.