JUMP TO TOPIC
Mode statistics – Explanation & Examples
 The definition of mode is: “Mode is the most frequent value in a set of data values”
In this topic, we will discuss the mode from the following aspects:
- What is the mode in statistics?
- The role of mode value in statistics
- How to find the mode of a set of numbers?
- How to find the mode of a set of strings or characters?
- Exercises
- Answers
What is the mode in statistics?
The mode is the value that appears most frequently in a set of data values.
If these data values are a set of numbers so the mode, in that case, is the number that has the highest number of occurrences. For example, if we have a set of numbers, 1,1,2,2,3,3,4,4,4,5,6,7,8,9,9,10, the mode will be 4 because 4 has the highest number of occurrences which is 3 times.
This can be easily shown if we plot a simple dot plot of this data.
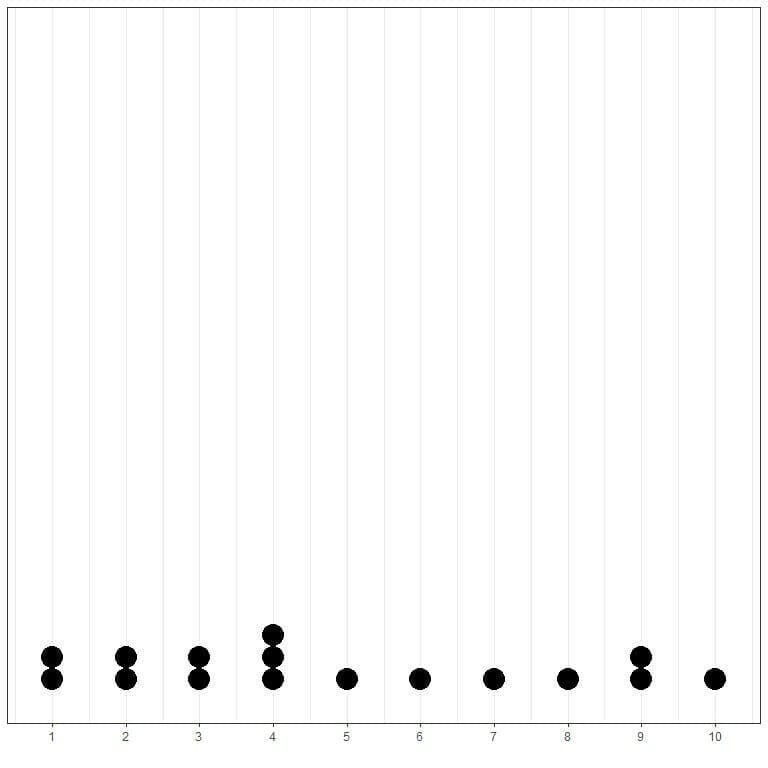
Here, we see that 4 has occurred 3 times, 1,2,3, and 9 have occurred 2 times, and all other values have occurred only 1 time. Therefore, the mode of this data is 4.
Let’s look at another example, if we have a data set of salaries for a number of managers in USA, in $1,000, these salaries are:
100,200,300,150,200,250,300,350,400,400,500,550,600,100,150,300,300
By plotting the data as a dotplot, we could easily see that the mode is 300.
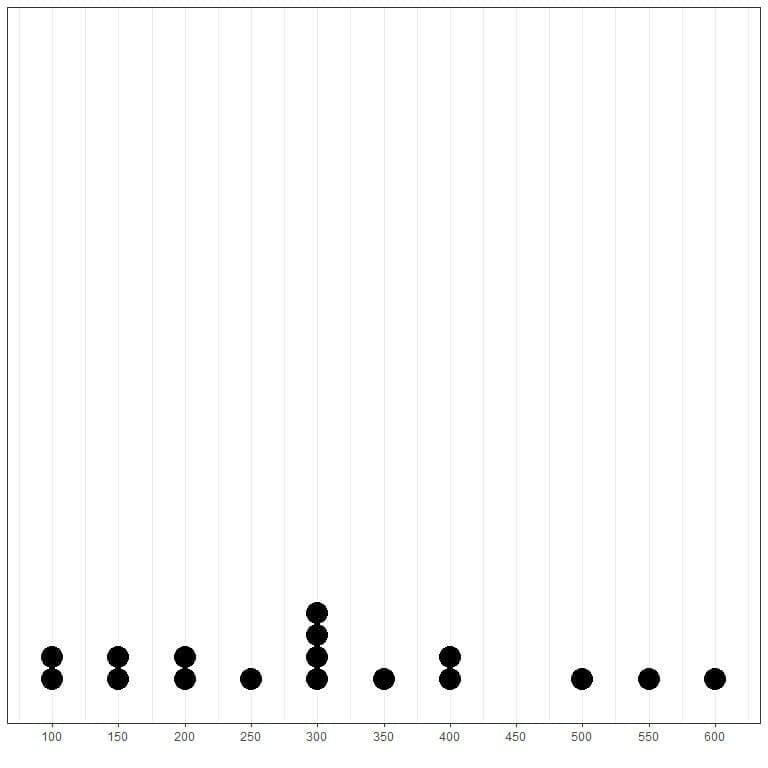
Here we see that the most frequent number is 300 (or $300,000) as it has occurred 4 times in this data.
But what about strings, categories, or character data sets? The same rule applies. In that case, the string or category with the highest number of occurrences will be the mode of that data.
For example, we have a set of student names in a certain statistical class. These names are: “John”, “Jan”, “Sam”, “Ali”, “Alice”, “Emmy”, “Ann”, “John”, “Ali”, “John”.
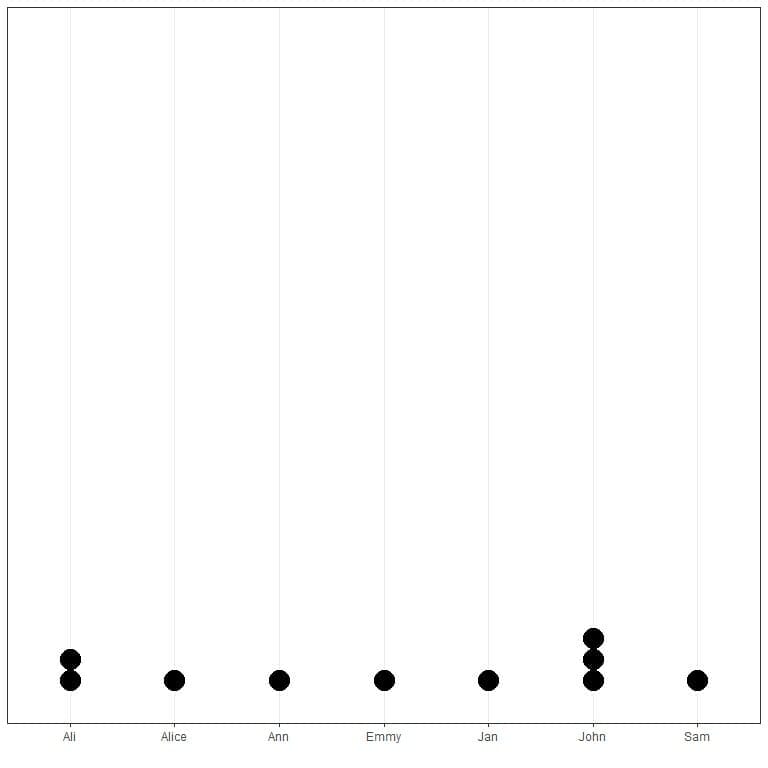
Here, we see that the mode of this data is the name “John” as it has occurred 3 times which is the maximum number of occurrences in this data.
The role of mode value in statistics
The mode is a type of summary statistics used to give important information about a certain data or population.
For the example of the data set of salaries, the mode is 300,000, so we know that $300,000 is the most frequent salary for these managers. In the other example of student names, by knowing that the mode is “John”, so we know that “John” is the most frequent name in this class.
The mode is not necessarily unique to a given data, since certain numbers or categories may occur the same maximum value. In that case, the data is called multimodal data as opposed to unimodal data with only one unique mode.
A common example of multimodal data when you have a mixed population. For example, if you have data of individual heights from a certain school, the data obtained, mostly, will be bimodal with one mode for students and the other mode for teachers.
How to find the mode of a set of numbers?
The mode of a certain set of numbers can be found graphically, using a frequency table, or by mlv (most likely value) function from the modeest package of R programming language.
Example 1
The following is the age (in years) of 100 different individuals from a certain survey in Spain:
70 56 37 69 70 40 66 53 43 70 54 42 54 48 68 48 42 35 72 70 70 48 56 74 57
52 58 62 56 68 70 46 35 56 50 48 47 60 63 71 43 65 38 64 73 54 67 58 62 70
58 49 67 52 47 44 59 67 47 70 35 43 66 68 59 61 35 73 58 36 50 67 58 67 72
52 68 38 61 50 59 35 39 43 61 43 68 47 63 65 59 72 74 70 48 40 37 53 57 38
What is the mode of this data?
1.Graphical method
Where we plot the data values on a certain axis against their frequency on the other axis.
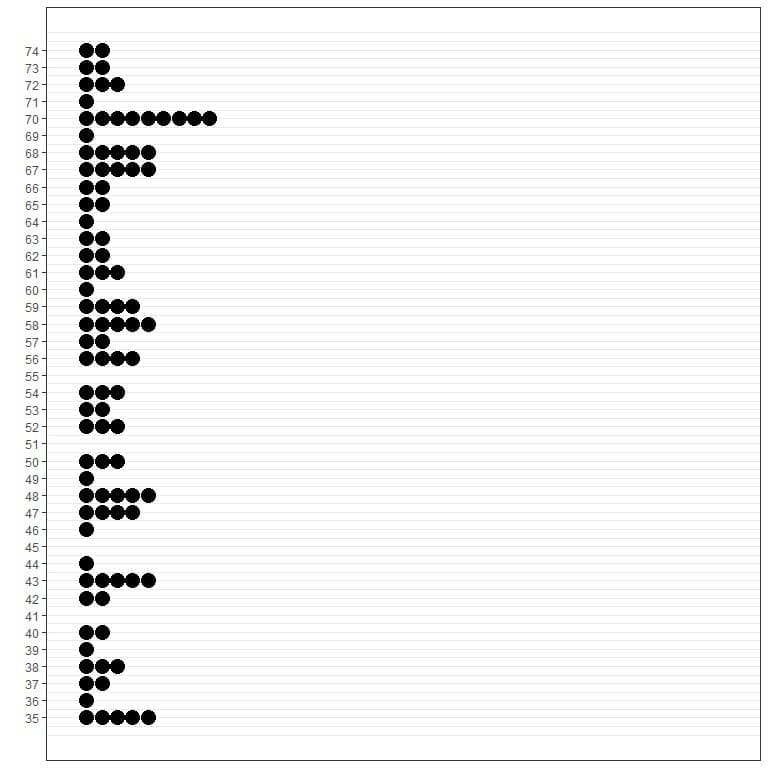
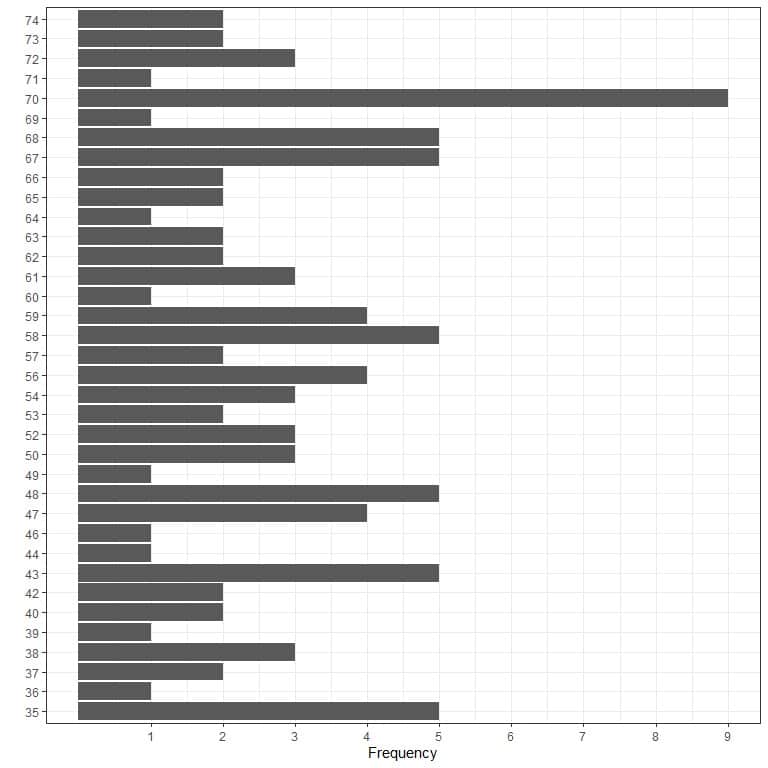
The different plots show that the mode is 70 because it has the maximum occurrences in this data (9 times).
2.Frequency table
Where we tabulate the data values in one column and their frequency in another column.
Age | Frequency |
35 | 5 |
36 | 1 |
37 | 2 |
38 | 3 |
39 | 1 |
40 | 2 |
42 | 2 |
43 | 5 |
44 | 1 |
46 | 1 |
47 | 4 |
48 | 5 |
49 | 1 |
50 | 3 |
52 | 3 |
53 | 2 |
54 | 3 |
56 | 4 |
57 | 2 |
58 | 5 |
59 | 4 |
60 | 1 |
61 | 3 |
62 | 2 |
63 | 2 |
64 | 1 |
65 | 2 |
66 | 2 |
67 | 5 |
68 | 5 |
69 | 1 |
70 | 9 |
71 | 1 |
72 | 3 |
73 | 2 |
74 | 2 |
The frequency table shows, also, that the mode is 70 because it has the maximum occurrences in this data (9 times).
3.mlv function of R
Both graphical and tabular methods can be problematic when we have a large number of unique data values. The mlv function, from the modeest package, solves this by giving the mode of large data using only one line of code.
These 100 numbers were the first 100 age numbers of the R built-in regicor dataset from the compareGroups package.
We begin our R session by activating the modeest and compareGroups packages. Then, we use the data function to import the regicor data into our session.
Finally, we create a vector called x that will hold the first 100 values of the age column (using the head function) from the regicor data and then using the mlv function to obtain the mode of these 100 numbers which is 70.
# activating the modeest and compareGroups packages
library(modeest)
library(compareGroups)
data(“regicor”)
# reading the data into R by creating a vector that holds these values
x<- head(regicor$age,100)
x
## [1] 70 56 37 69 70 40 66 53 43 70 54 42 54 48 68 48 42 35 72 70 70 48 56 74 57
## [26] 52 58 62 56 68 70 46 35 56 50 48 47 60 63 71 43 65 38 64 73 54 67 58 62 70
## [51] 58 49 67 52 47 44 59 67 47 70 35 43 66 68 59 61 35 73 58 36 50 67 58 67 72
## [76] 52 68 38 61 50 59 35 39 43 61 43 68 47 63 65 59 72 74 70 48 40 37 53 57 38
mlv(x)
## [1] 70
Example 2
The following is the first 100 systolic blood pressures (sbp) (in mmHg) from regicor data
138 139 132 168 NA 108 120 132 95 142 130 99 117 105 158 114 128 111 155
195 132 112 124 164 146 158 139 94 129 132 160 104 110 118 110 114 147 119
184 132 106 147 118 126 140 152 145 116 139 142 150 121 130 158 108 116 135
147 110 146 100 132 138 142 136 98 122 164 112 122 126 131 113 120 132 111
142 132 148 158 134 122 132 129 134 110 126 133 182 108 150 150 114 138 150
126 107 145 142 140
- NA holds for not available
What is the mode of this data?
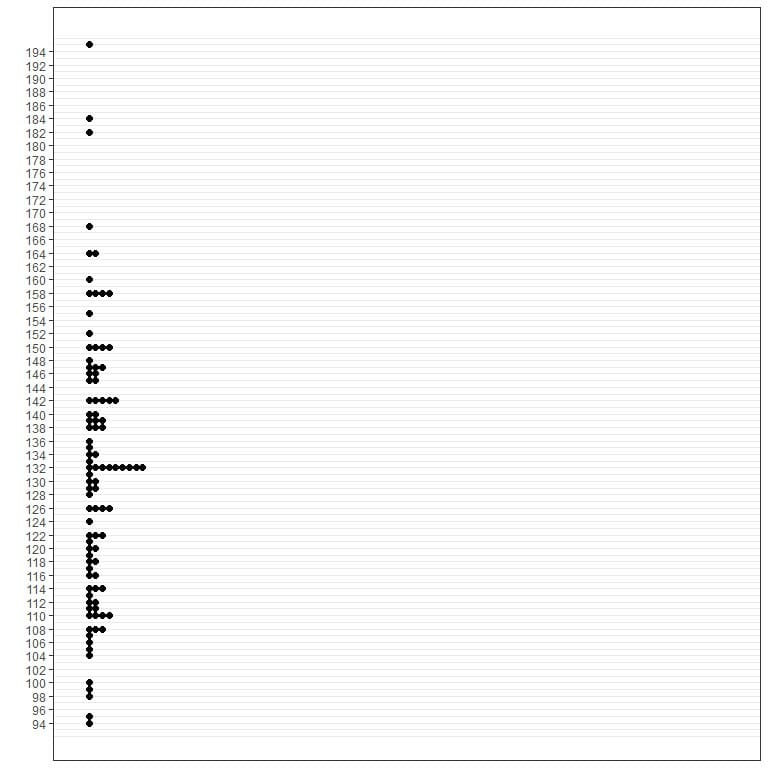
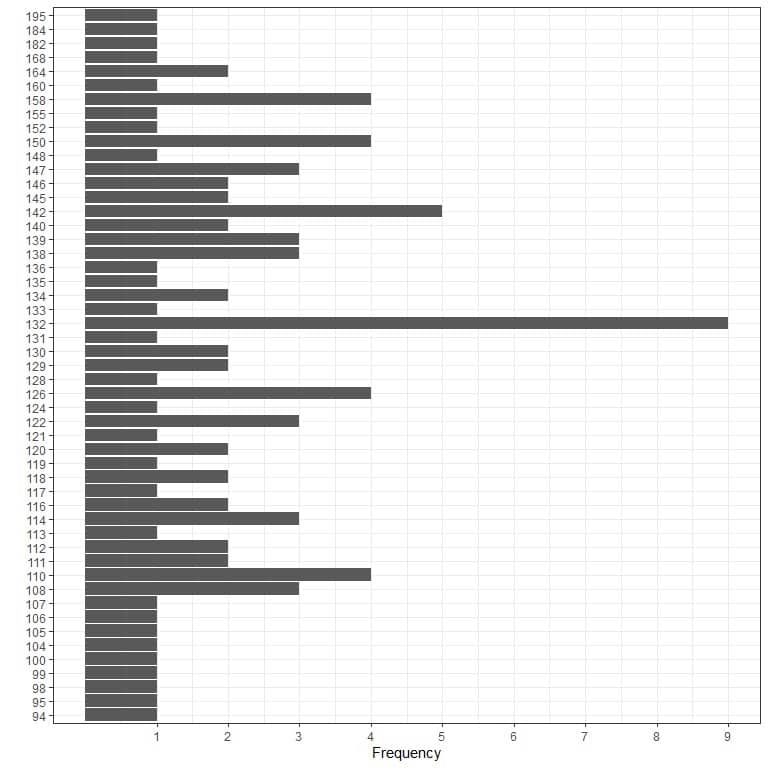
1.Graphical method
2.Frequency table
Blood pressure | Frequency |
94 | 1 |
95 | 1 |
98 | 1 |
99 | 1 |
100 | 1 |
104 | 1 |
105 | 1 |
106 | 1 |
107 | 1 |
108 | 3 |
110 | 4 |
111 | 2 |
112 | 2 |
113 | 1 |
114 | 3 |
116 | 2 |
117 | 1 |
118 | 2 |
119 | 1 |
120 | 2 |
121 | 1 |
122 | 3 |
124 | 1 |
126 | 4 |
128 | 1 |
129 | 2 |
130 | 2 |
131 | 1 |
132 | 9 |
133 | 1 |
134 | 2 |
135 | 1 |
136 | 1 |
138 | 3 |
139 | 3 |
140 | 2 |
142 | 5 |
145 | 2 |
146 | 2 |
147 | 3 |
148 | 1 |
150 | 4 |
152 | 1 |
155 | 1 |
158 | 4 |
160 | 1 |
164 | 2 |
168 | 1 |
182 | 1 |
184 | 1 |
195 | 1 |
3.mlv function of R
# reading the data into R by creating a vector that holds these values
x<- head(regicor$sbp,100)
x
## [1] 138 139 132 168 NA 108 120 132 95 142 130 99 117 105 158 114 128 111
## [19] 155 195 132 112 124 164 146 158 139 94 129 132 160 104 110 118 110 114
## [37] 147 119 184 132 106 147 118 126 140 152 145 116 139 142 150 121 130 158
## [55] 108 116 135 147 110 146 100 132 138 142 136 98 122 164 112 122 126 131
## [73] 113 120 132 111 142 132 148 158 134 122 132 129 134 110 126 133 182 108
## [91] 150 150 114 138 150 126 107 145 142 140
mlv(x)
## [1] 132
From three methods, the mode is 132 mmHg.
How to find the mode of a set of strings or characters?
Similarly, the mode of a certain set of characters can be found graphically, using a frequency table, or by the mlv (most likely value) function from the modeest package of R programming language.
Example 1:
You have some baby names
“Linda” “Linda” “James” “Robert” “Robert” “James” “John” “James”
“James” “James” “James” “Robert” “Robert” “James” “Robert” “David”
“James” “Robert” “James” “David” “Robert” “James” “David” “James”
“James” “Robert” “David” “Robert” “Robert” “Robert” “Robert” “John”
“John” “David” “John”
What is the mode of this data?
1.Graphical methods
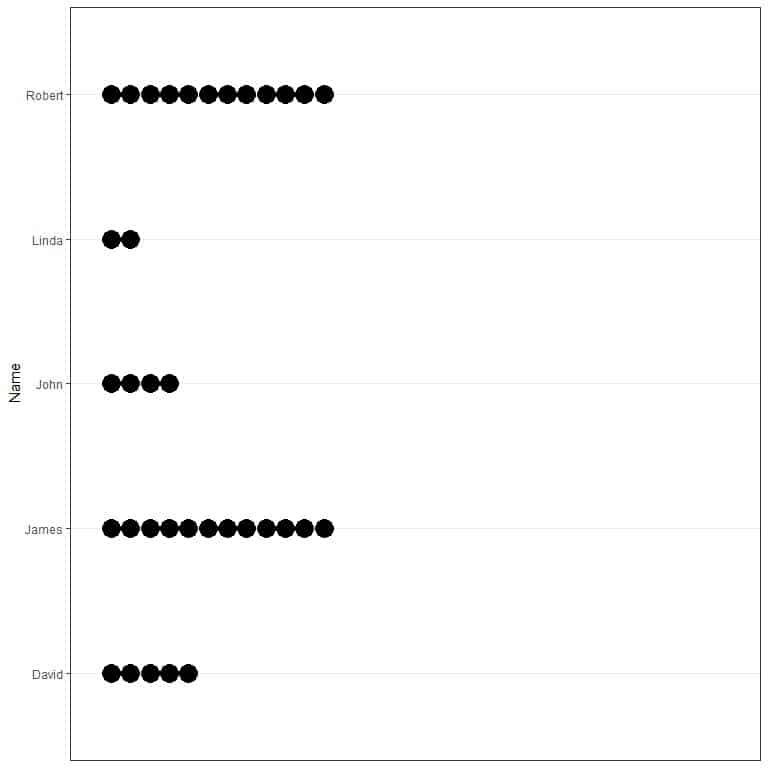
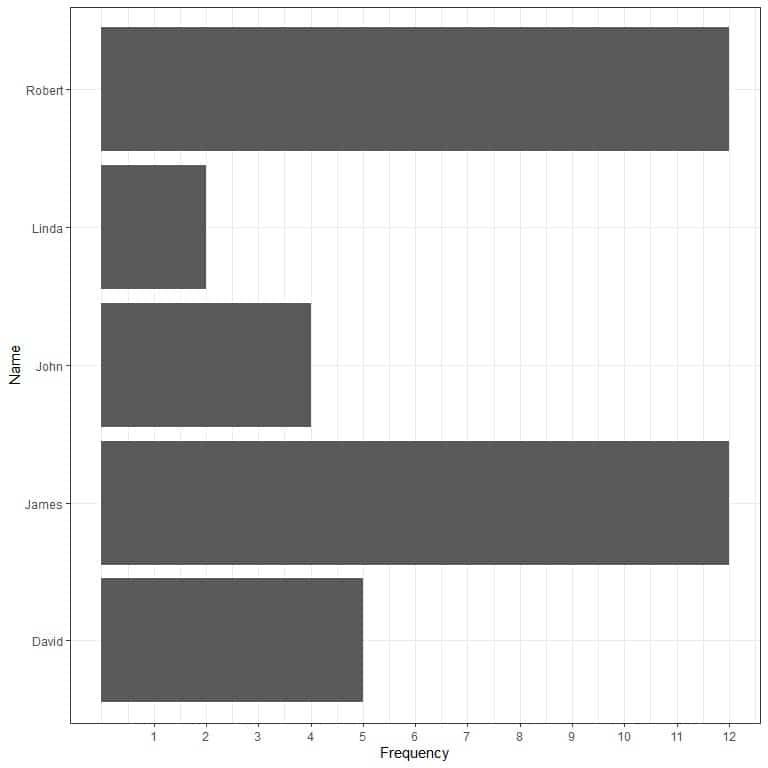
2.Frequency table
Name | Frequency |
David | 5 |
James | 12 |
John | 4 |
Linda | 2 |
Robert | 12 |
3.mlv function of R
# reading the data into R by creating a vector that holds these values
x<- c(“Linda”, “Linda”, “James”, “Robert”, “Robert”, “James”, “John”,
“James”, “James”, “James”, “James”, “Robert”, “Robert”, “James”,
“Robert”, “David”, “James”, “Robert”, “James”, “David”, “Robert”,
“James”, “David”, “James”, “James”, “Robert”, “David”, “Robert”,
“Robert”, “Robert”, “Robert”, “John” ,”John” ,”David”, “John”)
x
## [1] “Linda” “Linda” “James” “Robert” “Robert” “James” “John” “James”
## [9] “James” “James” “James” “Robert” “Robert” “James” “Robert” “David”
## [17] “James” “Robert” “James” “David” “Robert” “James” “David” “James”
## [25] “James” “Robert” “David” “Robert” “Robert” “Robert” “Robert” “John”
## [33] “John” “David” “John”
mlv(x)
## [1] “James” “Robert”
The mode of this data is “James” and “Robert” as they both have occurred 12 times and this is the maximum number of occurrences. This is an example of multimodal or bimodal data.
Exercises
1.The air quality data contains some daily measurements of Ozone (ppb) in New York on certain days of 1977, what is the mode of these measurements?
2.The air quality data contains also some daily measurements of Solar radiation (lang), what is the mode of these measurements?
3.These air quality measurements were made in specific months. What is the mode of the month values?
4.Which of these examples (1,2, or 3) are an example of unimodal or multimodal data?
5.The regicor data contains some age values (in years) from certain Spanish individuals, what is the mode of these values
Answers
1.The air quality data is a built-in data in R. So we import the data using the data function the create a vector to hold the ozone measurements and then use the mlv function. Here, we add another argument to the function, na.rm, to remove NA values from this data and give us the mode value
data(“airquality”)
x<-airquality$Ozone
mlv(x, na.rm = TRUE)
## [1] 23
So the mode is 23 ppb.
2.The same steps apply
x<-airquality$Solar.R
mlv(x, na.rm = TRUE)
## [1] 238 259
So the mode is 238 and 259 lang.
3.The same steps apply
x<-airquality$Month
mlv(x,na.rm = TRUE)
## [1] 5 7 8
So the mode is 5,7,8 or May, July, and August.
4.Ozone is an example of unimodal data as it has only 1 mode. Solar radiation and month data are examples of multimodal data as they have 2 modes and 3 modes respectively.
5.The same steps apply
x<-regicor$age
mlv(x, na.rm = TRUE)
## [1] 58
So the mode is 58 years