JUMP TO TOPIC
The Percentile – Explanation & Examples
 The definition of percentile is:
“The percentile is the value below which a certain percent of numerical data falls.”
In this topic, we will discuss the percentile from the following aspects:
- What does percentile mean in statistics?
- How to find the percentile?
- Percentile formula.
- Practical questions.
- Answers.
What does percentile mean in statistics?
The percentile is the value below which a certain percent of numerical data falls.
For example, if you score 90 out of 100 on a certain test. That score has no meaning unless you know what percentile you fall into.
If your score (90 out of 100) is the 90th percentile. This means that you score better than 90% of the test takers.
If your score (90 out of 100) is the 60th percentile. This means that you score better than only 60% of the test takers.
The 25th percentile is the first quartile or Q1.
The 50th percentile is the second quartile or Q2.
The 75th percentile is the third quartile or Q3.
How to find the percentile?
We will go through several examples.
– Example 1
For the 10 numbers,10,20,30,40,50,60,70,80,90,100. Find the 30th, 40th, 50th and 100th percentiles.
1. Order the numbers from smallest to largest number.
The data is already ordered, 10,20,30,40,50,60,70,80,90,100.
2. Assign a rank to each value of your data.
values | rank |
10 | 1 |
20 | 2 |
30 | 3 |
40 | 4 |
50 | 5 |
60 | 6 |
70 | 7 |
80 | 8 |
90 | 9 |
100 | 10 |
3. Calculate the ordinal rank for each required percentile. Round the obtained number to the next integer.
Ordinal rank = (percentile/100) X total number of data points.
4. The value with the next rank to the ordinal rank is the required percentile.
The ordinal rank for the 30th percentile = (30/100) X 10 = 3. The next rank is 4 with 40 data value, so 40 is the 30th percentile.
We note that 40 is higher than 10,20,30 or 3 data values/10 data values = 0.3 or 30% of the data.
The ordinal rank for the 40th percentile = (40/100) X 10 = 4. The next rank is 5 with 50 data value, so 50 is the 40th percentile.
We note that 50 is higher than 10,20,30,40 or 4/10 = 0.4 or 40% of the data.
The ordinal rank for the 50th percentile = (50/100) X 10 = 5. The next rank is 6 with 60 data value, so 60 is the 50th percentile.
We note that 60 is higher than 10,20,30,40,50 or 5/10 = 0.5 or 50% of the data.
The ordinal rank for the 100th percentile = (100/100) X 10 = 10. The next rank is 11 with no data value.
In that case, we assume that 100 is the 100th percentile, although it is also the 90th percentile.
It is always that the 100th percentile is the maximum value and the 0th percentile is the minimum value.
– Example 2
The following is the age in years for 20 participants from a certain survey.
26 48 67 39 25 25 36 44 44 47 53 52 52 51 52 40 77 44 40 45.
Find the 10th, 30th, 60th, 80th percentiles.
1. Order the numbers from smallest to largest number.
25 25 26 36 39 40 40 44 44 44 45 47 48 51 52 52 52 53 67 77.
2. Assign a rank to each value of your data.
values | rank |
25 | 1 |
25 | 2 |
26 | 3 |
36 | 4 |
39 | 5 |
40 | 6 |
40 | 7 |
44 | 8 |
44 | 9 |
44 | 10 |
45 | 11 |
47 | 12 |
48 | 13 |
51 | 14 |
52 | 15 |
52 | 16 |
52 | 17 |
53 | 18 |
67 | 19 |
77 | 20 |
Note that repeated values or ties are ranked sequentially as usual.
3. Calculate the ordinal rank for each required percentile. Round the obtained number to the next integer.
Ordinal rank = (percentile/100) X total number of data points.
4. The value with the next rank to the ordinal rank is the required percentile.
The ordinal rank for the 10th percentile = (10/100) X 20 = 2. The next rank is 3 with 26 data value, so 26 is the 10th percentile.
We note that 26 is higher than 25,25 or 2 data values/20 data values = 0.1 or 10% of the data.
The ordinal rank for the 30th percentile = (30/100) X 20 = 6. The next rank is 7 with 40 data value, so 40 is the 30th percentile.
We note that 40 is higher than 25,25,26,36,39,40 or 6 data values/20 data values = 0.3 or 30% of the data.
The ordinal rank for the 60th percentile = (60/100) X 20 = 12. The next rank is 13 with 48 data value, so 48 is the 60th percentile.
We note that 48 is higher than 25,25,26,36,39,40,40,44,44,44,45,47 or 12 data values/20 data values = 0.6 or 60% of the data.
The ordinal rank for the 80th percentile = (80/100) X 20 = 16. The next rank is 17 with 52 data value, so 52 is the 80th percentile.
We note that 52 is higher (in rank) than 25,25,26,36,39,40,40,44,44,44,45,47,48,51,52,52 or 16 data values/20 data values = 0.8 or 80% of the data.
– Example 2
The following is the daily temperature measurements for 50 days in New York, May to September 1973.
67 72 74 62 56 66 65 59 61 69 74 69 66 68 58 64 66 57 68 62 59 73 61 61 57 58 57 67 81 79 76 78 74 67 84 85 79 82 87 90 87 93 92 82 80 79 77 72 65 73.
Find the 10th, 20th, 30th, 40th, 50th, 60th, 70th, 80th, 90th percentiles.
1. Order the numbers from smallest to largest number.
56 57 57 57 58 58 59 59 61 61 61 62 62 64 65 65 66 66 66 67 67 67 68 68 69 69 72 72 73 73 74 74 74 76 77 78 79 79 79 80 81 82 82 84 85 87 87 90 92 93.
2. Assign a rank to each value of your data.
values | rank |
56 | 1 |
57 | 2 |
57 | 3 |
57 | 4 |
58 | 5 |
58 | 6 |
59 | 7 |
59 | 8 |
61 | 9 |
61 | 10 |
61 | 11 |
62 | 12 |
62 | 13 |
64 | 14 |
65 | 15 |
65 | 16 |
66 | 17 |
66 | 18 |
66 | 19 |
67 | 20 |
67 | 21 |
67 | 22 |
68 | 23 |
68 | 24 |
69 | 25 |
69 | 26 |
72 | 27 |
72 | 28 |
73 | 29 |
73 | 30 |
74 | 31 |
74 | 32 |
74 | 33 |
76 | 34 |
77 | 35 |
78 | 36 |
79 | 37 |
79 | 38 |
79 | 39 |
80 | 40 |
81 | 41 |
82 | 42 |
82 | 43 |
84 | 44 |
85 | 45 |
87 | 46 |
87 | 47 |
90 | 48 |
92 | 49 |
93 | 50 |
3. Calculate the ordinal rank for each required percentile. Round the obtained number to the next integer.
Ordinal rank = (percentile/100) X total number of data points.
4. The value with the next rank to the ordinal rank is the required percentile.
The ordinal rank for the 10th percentile = (10/100) X 50 = 5. The next rank is 6 with 58 data value, so 58 is the 10th percentile.
The ordinal rank for the 20th percentile = (20/100) X 50 = 10. The next rank is 11 with 61 data value, so 61 is the 20th percentile.
The ordinal rank for the 30th percentile = (30/100) X 50 = 15. The next rank is 16 with 65 data value, so 65 is the 30th percentile.
The ordinal rank for the 40th percentile = (40/100) X 50 = 40. The next rank is 21 with 67 data value, so 67 is the 40th percentile.
The ordinal rank for the 50th percentile = (50/100) X 50 = 25. The next rank is 26 with 69 data value, so 69 is the 50th percentile.
The ordinal rank for the 60th percentile = (60/100) X 50 = 30. The next rank is 31 with 74 data value, so 74 is the 60th percentile.
The ordinal rank for the 70th percentile = (70/100) X 50 = 35. The next rank is 36 with 78 data value, so 78 is the 70th percentile.
The ordinal rank for the 80th percentile = (80/100) X 50 = 40. The next rank is 41 with 81 data value, so 81 is the 80th percentile.
The ordinal rank for the 90th percentile = (90/100) X 50 = 45. The next rank is 46 with 87 data value, so 87 is the 90th percentile.
We can add this to the above table.
values | rank | percentile |
56 | 1 |
|
57 | 2 | |
57 | 3 |
|
57 | 4 | |
58 | 5 |
|
58 | 6 | 10th |
59 | 7 |
|
59 | 8 | |
61 | 9 | |
61 | 10 |
|
61 | 11 | 20th |
62 | 12 |
|
62 | 13 | |
64 | 14 |
|
65 | 15 | |
65 | 16 | 30th |
66 | 17 | |
66 | 18 |
|
66 | 19 | |
67 | 20 |
|
67 | 21 | 40th |
67 | 22 |
|
68 | 23 | |
68 | 24 |
|
69 | 25 | |
69 | 26 | 50th |
72 | 27 | |
72 | 28 |
|
73 | 29 | |
73 | 30 |
|
74 | 31 | 60th |
74 | 32 |
|
74 | 33 | |
76 | 34 |
|
77 | 35 | |
78 | 36 | 70th |
79 | 37 | |
79 | 38 |
|
79 | 39 | |
80 | 40 |
|
81 | 41 | 80th |
82 | 42 |
|
82 | 43 | |
84 | 44 |
|
85 | 45 | |
87 | 46 | 90th |
87 | 47 | |
90 | 48 |
|
92 | 49 | |
93 | 50 |
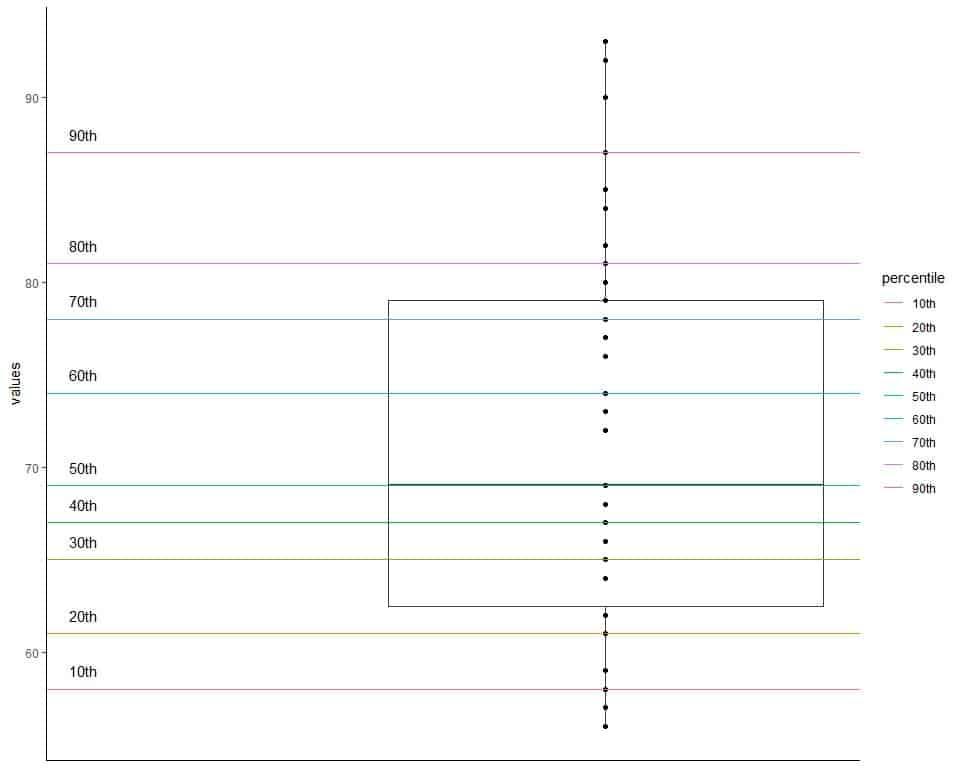
We can plot this data as a box plot with lines for different percentiles.

Percentile formula
To calculate the percentile for a certain number (x) in your data, use the formula:
percentile = (number of ranks below x/total number of ranks) X 100.
For example, in the table above, the number 58 with a rank = 6.
Number of ranks below 58 = 5, total number of ranks = 50.
The percentile for 58 = (5/50)X 100 = 10th.
Using that formula, we can calculate the percentiles for all numbers in our data.
Generally speaking, the 0th percentile is the minimum value and the 100th percentile is the maximum value.
values | rank | percentile |
56 | 1 | 0th |
57 | 2 | 2th |
57 | 3 | 4th |
57 | 4 | 6th |
58 | 5 | 8th |
58 | 6 | 10th |
59 | 7 | 12th |
59 | 8 | 14th |
61 | 9 | 16th |
61 | 10 | 18th |
61 | 11 | 20th |
62 | 12 | 22th |
62 | 13 | 24th |
64 | 14 | 26th |
65 | 15 | 28th |
65 | 16 | 30th |
66 | 17 | 32th |
66 | 18 | 34th |
66 | 19 | 36th |
67 | 20 | 38th |
67 | 21 | 40th |
67 | 22 | 42th |
68 | 23 | 44th |
68 | 24 | 46th |
69 | 25 | 48th |
69 | 26 | 50th |
72 | 27 | 52th |
72 | 28 | 54th |
73 | 29 | 56th |
73 | 30 | 58th |
74 | 31 | 60th |
74 | 32 | 62th |
74 | 33 | 64th |
76 | 34 | 66th |
77 | 35 | 68th |
78 | 36 | 70th |
79 | 37 | 72th |
79 | 38 | 74th |
79 | 39 | 76th |
80 | 40 | 78th |
81 | 41 | 80th |
82 | 42 | 82th |
82 | 43 | 84th |
84 | 44 | 86th |
85 | 45 | 88th |
87 | 46 | 90th |
87 | 47 | 92th |
90 | 48 | 94th |
92 | 49 | 96th |
93 | 50 | 98th |
Although 93 is the 98th percentile, it is also considered the 100th percentile as there is no value in our data that is larger than all our data values.
Practical questions
1. The following are some percentiles for some daily ozone measurements in New York, May to September 1973.
percentile | value |
10% | 11.00 |
30% | 20.00 |
70% | 49.50 |
75% | 63.25 |
What percentage of data is less than 20?
What is the third quartile of this data or Q3?
2. The following are daily solar radiation measurements for 20 days in New York, May to September 1973.
236 259 238 24 112 237 224 27 238 201 238 14 139 49 20 193 145 191 131 223.
Construct a table with the rank and percentile for each value.
3. The following are murder rates per 100,000 population for 50 states of the United States of America in 1976.
state | value |
Alabama | 15.1 |
Alaska | 11.3 |
Arizona | 7.8 |
Arkansas | 10.1 |
California | 10.3 |
Colorado | 6.8 |
Connecticut | 3.1 |
Delaware | 6.2 |
Florida | 10.7 |
Georgia | 13.9 |
Hawaii | 6.2 |
Idaho | 5.3 |
Illinois | 10.3 |
Indiana | 7.1 |
Iowa | 2.3 |
Kansas | 4.5 |
Kentucky | 10.6 |
Louisiana | 13.2 |
Maine | 2.7 |
Maryland | 8.5 |
Massachusetts | 3.3 |
Michigan | 11.1 |
Minnesota | 2.3 |
Mississippi | 12.5 |
Missouri | 9.3 |
Montana | 5.0 |
Nebraska | 2.9 |
Nevada | 11.5 |
New Hampshire | 3.3 |
New Jersey | 5.2 |
New Mexico | 9.7 |
New York | 10.9 |
North Carolina | 11.1 |
North Dakota | 1.4 |
Ohio | 7.4 |
Oklahoma | 6.4 |
Oregon | 4.2 |
Pennsylvania | 6.1 |
Rhode Island | 2.4 |
South Carolina | 11.6 |
South Dakota | 1.7 |
Tennessee | 11.0 |
Texas | 12.2 |
Utah | 4.5 |
Vermont | 5.5 |
Virginia | 9.5 |
Washington | 4.3 |
West Virginia | 6.7 |
Wisconsin | 3.0 |
Wyoming | 6.9 |
Construct a table with the rank and percentile for each value.
4. The following are some percentiles of temperature in certain months.
Month | 10th | 90th |
5 | 57.0 | 74.0 |
6 | 72.9 | 87.3 |
7 | 81.0 | 89.0 |
8 | 77.0 | 94.0 |
9 | 67.9 | 91.1 |
For August or Month 8, what percent of temperatures are less than 94?
Which month has the highest spread in its temperatures?
5. The following are some percentiles of per capita income in 1974 for the 4 regions of the US.
region | 10th | 90th |
Northeast | 3864.4 | 5259.2 |
South | 3461.5 | 4812.0 |
North Central | 4274.4 | 5053.4 |
West | 4041.4 | 5142.0 |
Which region has the highest 90th percentile?
Which region has the highest 10th percentile?
Answers
1. The percentage of data that is less than 20 is 30% because 20 is 30% percentile.
The third quartile of this data or Q3 is 75% percentile or 63.25.
2. Following the above steps, we can construct the following table:
values | rank | percentile |
14 | 1 | 0th |
20 | 2 | 5th |
24 | 3 | 10th |
27 | 4 | 15th |
49 | 5 | 20th |
112 | 6 | 25th |
131 | 7 | 30th |
139 | 8 | 35th |
145 | 9 | 40th |
191 | 10 | 45th |
193 | 11 | 50th |
201 | 12 | 55th |
223 | 13 | 60th |
224 | 14 | 65th |
236 | 15 | 70th |
237 | 16 | 75th |
238 | 17 | 80th |
238 | 18 | 85th |
238 | 19 | 90th |
259 | 20 | 95th |
3. Following the above steps, we can construct the following table:
state | value | rank | percentile |
North Dakota | 1.4 | 1 | 0th |
South Dakota | 1.7 | 2 | 2th |
Iowa | 2.3 | 3 | 4th |
Minnesota | 2.3 | 4 | 6th |
Rhode Island | 2.4 | 5 | 8th |
Maine | 2.7 | 6 | 10th |
Nebraska | 2.9 | 7 | 12th |
Wisconsin | 3.0 | 8 | 14th |
Connecticut | 3.1 | 9 | 16th |
Massachusetts | 3.3 | 10 | 18th |
New Hampshire | 3.3 | 11 | 20th |
Oregon | 4.2 | 12 | 22th |
Washington | 4.3 | 13 | 24th |
Kansas | 4.5 | 14 | 26th |
Utah | 4.5 | 15 | 28th |
Montana | 5.0 | 16 | 30th |
New Jersey | 5.2 | 17 | 32th |
Idaho | 5.3 | 18 | 34th |
Vermont | 5.5 | 19 | 36th |
Pennsylvania | 6.1 | 20 | 38th |
Delaware | 6.2 | 21 | 40th |
Hawaii | 6.2 | 22 | 42th |
Oklahoma | 6.4 | 23 | 44th |
West Virginia | 6.7 | 24 | 46th |
Colorado | 6.8 | 25 | 48th |
Wyoming | 6.9 | 26 | 50th |
Indiana | 7.1 | 27 | 52th |
Ohio | 7.4 | 28 | 54th |
Arizona | 7.8 | 29 | 56th |
Maryland | 8.5 | 30 | 58th |
Missouri | 9.3 | 31 | 60th |
Virginia | 9.5 | 32 | 62th |
New Mexico | 9.7 | 33 | 64th |
Arkansas | 10.1 | 34 | 66th |
California | 10.3 | 35 | 68th |
Illinois | 10.3 | 36 | 70th |
Kentucky | 10.6 | 37 | 72th |
Florida | 10.7 | 38 | 74th |
New York | 10.9 | 39 | 76th |
Tennessee | 11.0 | 40 | 78th |
Michigan | 11.1 | 41 | 80th |
North Carolina | 11.1 | 42 | 82th |
Alaska | 11.3 | 43 | 84th |
Nevada | 11.5 | 44 | 86th |
South Carolina | 11.6 | 45 | 88th |
Texas | 12.2 | 46 | 90th |
Mississippi | 12.5 | 47 | 92th |
Louisiana | 13.2 | 48 | 94th |
Georgia | 13.9 | 49 | 96th |
Alabama | 15.1 | 50 | 98th |
4. For August or Month 8, the percent of temperatures that are less than 94 is 90% since 94 is the 90th percentile.
To see the spread of temperatures for each month, we can see the difference between 90th and 10th percentiles.
Month | 10th | 90th | difference |
5 | 57.0 | 74.0 | 17.0 |
6 | 72.9 | 87.3 | 14.4 |
7 | 81.0 | 89.0 | 8.0 |
8 | 77.0 | 94.0 | 17.0 |
9 | 67.9 | 91.1 | 23.2 |
The highest difference is for Month 9 or September, so September has the highest spread in its temperatures.
5. Northeast has the highest 90th percentile of 5259.2.
North Central has the highest 10th percentile of 4274.4.