JUMP TO TOPIC
Range Statistics – Explanation & Examples
 The definition of the range is:
“Range is the difference between the smallest and largest values of a set of numbers”
In this topic, we will discuss the range from the following aspects:
- What is the range in statistics?
- The role of range value in statistics
- How to find the range of a set of numbers?
- Exercises
- Answers
What is the range in statistics?
The range is the difference between the smallest (minimum) and the largest (maximum) values of a set of numbers.
It is calculated by subtracting the smallest value from the largest value.
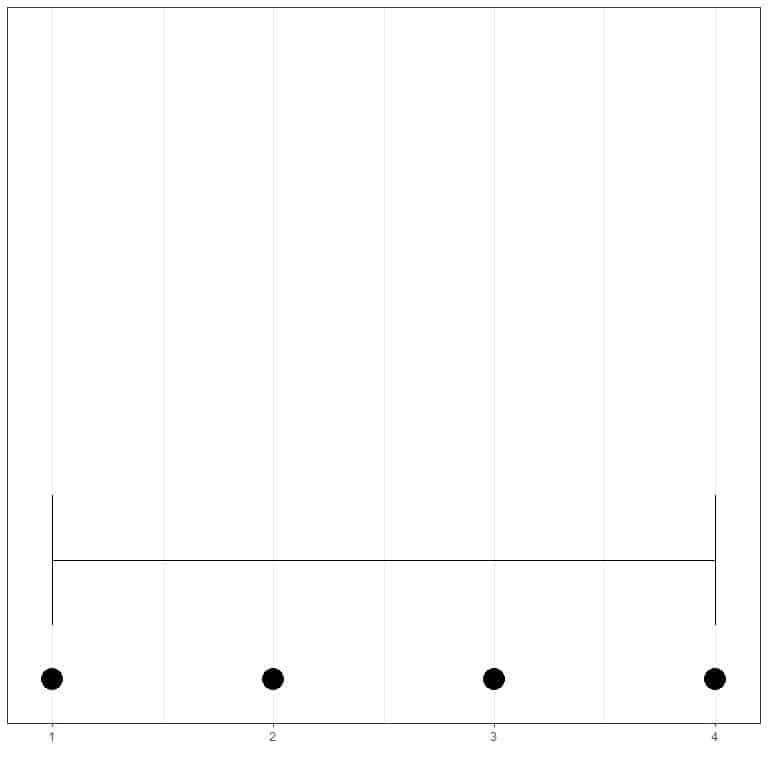
If we have a set of numbers, 1,2,3,4, the smallest value is 1 and the largest value is 4, so the range = 4-1 = 3.
We can see that from this dot plot with the range as a horizontal line.

If we have another set of 4 numbers, 10, 20, 30, 40, the smallest value is 10 and the largest value is 40, so the range = 40-10 = 30.
Let’s compare the range of these two sets of 4 numbers using horizontal or vertical lines.
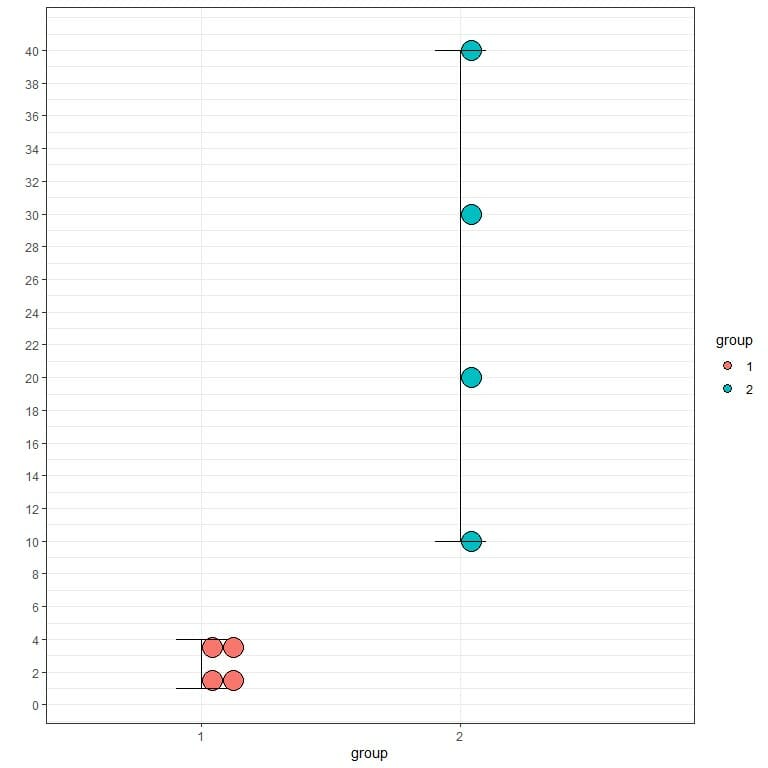
We see that the second group has a higher range than the first group.
Let’s look at another example. The air quality data contains daily air quality measurements in New York, May to September 1973. The following table summarizes the minimum and maximum ozone measurements for each month along with the range of ozone measurements for each month.
Month | max_ozone | min_ozone | range |
5 | 115 | 1 | 114 |
6 | 71 | 12 | 59 |
7 | 135 | 7 | 128 |
8 | 168 | 9 | 159 |
9 | 96 | 7 | 89 |
In the following plot, we plot the ozone measurements for each month as points and the range as vertical lines.
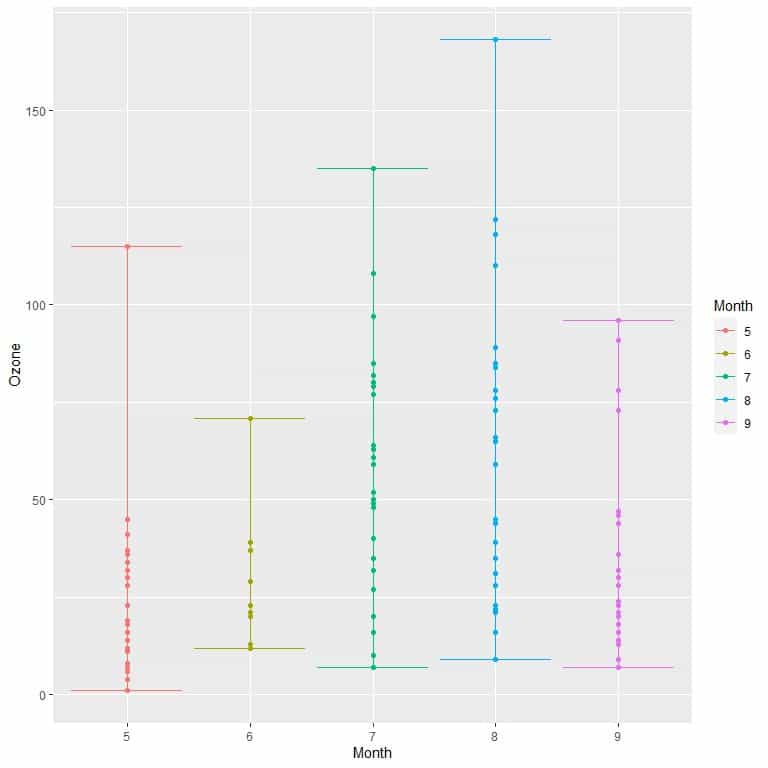
Here, we see that month 8 (August) had the highest range in Ozone measurements (159) and month 6 (June) has the lowest range (59).
The role of range value in statistics
The range is a type of summary statistics used to give important information about the dispersion or variability of a certain data or population.
In the example of ozone measurements, we see that the range for August was 159 so the ozone measurements in this month are highly dispersed or very different from each other.
However, one disadvantage of the range as a summary statistics is that it is sensitive to extreme values or outliers, and so the range is not a robust statistic. Robust statistics are measures of data properties that are not sensitive to outliers.
To show that the range is affected by outliers. Let’s consider this data of salaries of 5 managers in the USA, in $1000:
30,50,55,60,70
The minimum is 30 and the maximum is 70 so the range = 70-30 = 40 or $40,000.
If we have another set of 5 salaries with the same values except that the highest salary was $700,000:
30,50,55,60,700
The minimum is 30 and the maximum is 700 so the range = 700-30 = 670 or $670,000.
This can also be seen in the following figure.
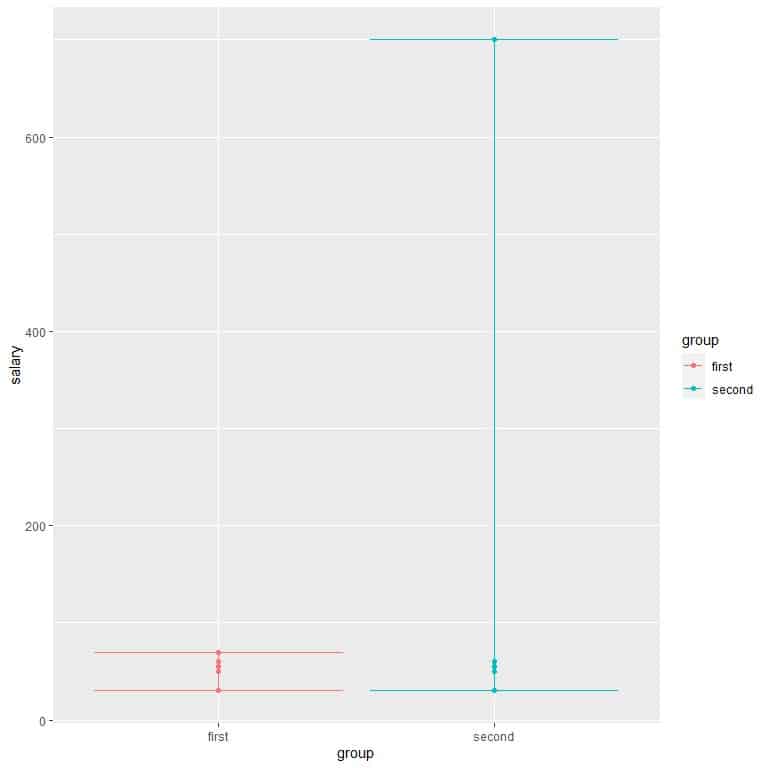
We see that the second group has a very high range, although most of the values are similar to each other. The presence of an outlier salary at 700 has dramatically increased the range to 670.
How to find the range of a set of numbers?
The range of a certain set of numbers can be found manually (by subtracting the minimum value from the maximum value) or by the range function from the base package of R programming language.
The range function of R does not give the range directly but gives the lowest and maximum values of the supplied data. From that, the range can be calculated.
Example 1: The following is the age (in years) of 51 different individuals from a certain survey in Spain:
70 56 37 69 70 40 66 53 43 70 54 42 54 48 68 48 42 35 72 70 70 48 56 74 57 52 58 62 56 68 70 46 35 56 50 48 47 60 63 71 43 65 38 64 73 54 67 58 62 70 58
What is the range of this data?
1.Manual method
- The lowest value (minimum) is 35 and the highest value (maximum) is 74
- The range = 74-35 = 39
2.range function of R
The manual method will be tedious when we have a large list of numbers. The range function, from the base package of R programming language, saves our time by giving us the minimum and maximum value of these large lists of numbers.
These 51 numbers were the first 51 age numbers of the R built-in regicor dataset from the compareGroups package.
We begin our R session by activating the compareGroups package. The base package needs no activation as it is activated when we open our R studio. Then, we use the data function to import the regicor data into our session.
Finally, we create a vector called x that will hold the first 51 values of the age column (using the head function) from the regicor data and then using the range function to obtain the minimum and maximum of these 51 numbers.
# activating the compareGroups packages
library(compareGroups)
data(“regicor”)
# reading the data into R by creating a vector that holds these values
x<- head(regicor$age,51)
x
## [1] 70 56 37 69 70 40 66 53 43 70 54 42 54 48 68 48 42 35 72 70 70 48 56 74 57
## [26] 52 58 62 56 68 70 46 35 56 50 48 47 60 63 71 43 65 38 64 73 54 67 58 62 70
## [51] 58
range(x)
## [1] 35 74
So the range = 74 – 35 = 39
Example 2: The following is the first 20 air pressure values (in millibars) from the storms data of the dplyr package
1013 1013 1013 1013 1012 1012 1011 1006 1004 1002 1000 998 998 998 987 987 984 984 984 984
What is the range of this data?
1.Manual method
- The minimum is 984 and the maximum is 1013
- Range = 1013-984 = 29
2.range function of R
These 20 numbers were the first 20 air pressure values (in millibars) from the storms data of the dplyr package. We apply the same steps discussed above.
# activating the dplyr package
library(dplyr)
data(“storms”)
# reading the data into R by creating a vector that holds these values
x<- head(storms$pressure,20)
x
## [1] 1013 1013 1013 1013 1012 1012 1011 1006 1004 1002 1000 998 998 998 987
## [16] 987 984 984 984 984
range(x)
## [1] 984 1013
The range = 1013-984 = 29.
Example 3: The following is the heights of 10 males (in cm)
170 164 160 163 167 156 180 156 162 155
and the following is the heights of 10 females (in cm)
160.0 163.0 147.0 158.0 154.5 160.0 160.0 150.0 157.0 163.0
Which group has a higher range?
1.Manual method
- For the males, lowest value = 155 and highest value = 180
- The range for males = 180-155 = 25
- For the females, lowest value = 147 and highest value = 163
- The range for females = 163-147 = 16
- Males have a higher range than females. In other words, the males’ height is more dispersed than females.
2.range function of R
We create a vector called x that will hold the male heights and another vector called y to hold the female heights
# creating a vector that holds the male heights
x<- c(170, 164, 160, 163, 167, 156, 180, 156, 162, 155)
x
## [1] 170 164 160 163 167 156 180 156 162 155
range(x)
## [1] 155 180
# creating a vector that holds the female heights
y<- c(160.0, 163.0, 147.0, 158.0, 154.5, 160.0, 160.0, 150.0, 157.0, 163.0)
y
## [1] 160.0 163.0 147.0 158.0 154.5 160.0 160.0 150.0 157.0 163.0
range(y)
## [1] 147 163
The range for males = 180-155 = 25, while the range for females = 163-147 = 16 so males have higher range than females.
Exercises
1. The USArrests data contains statistics, in arrests per 100,000 residents for assault, murder, and rape in each of the 50 US states in 1973, what is the range of the murder arrests (Murder column)?
2. For the same USArrests data, what is the range of the Rape arrests (Rape column)?
3. The regicor data contains different information about individuals representative of the population from a north-west Spanish province (Girona). What is the range of the physical activity column (phyact)?
4. For the same regicor data, what is the range of the body mass index (bmi)?
5. The following plot shows the wind speed for three storms, Katrina, Kate, and Keith, in different years.
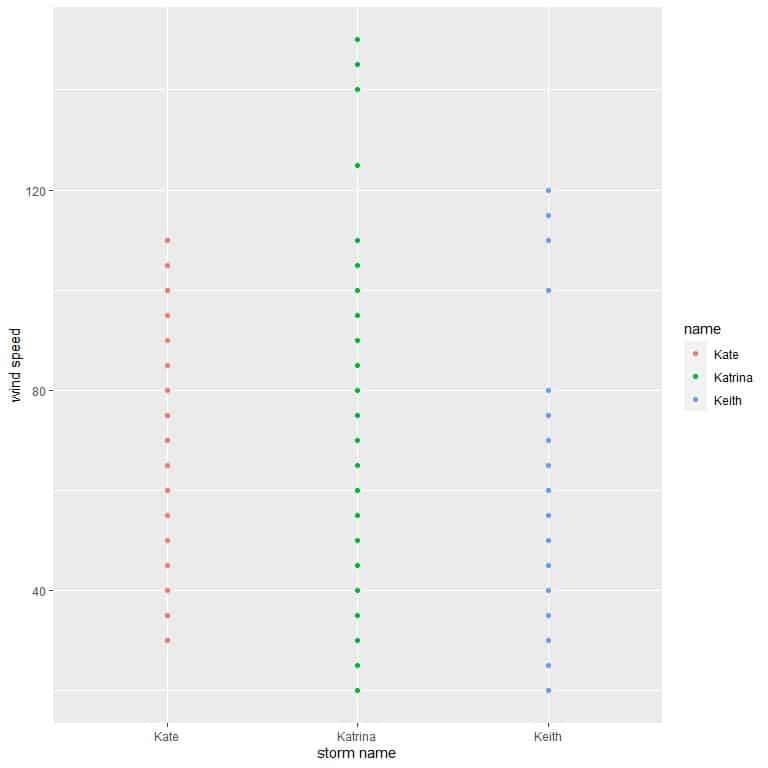
Without knowing the minimum and maximum value for each storm, Which storm has the smallest range and which has the highest range?
Answers
1. The USArrests data is a built-in data in R. So we import the data using the data function, create a vector to hold the murder arrests values and use the range function.
data(“USArrests”)
x<-USArrests$Murder
range(x)
## [1] 0.8 17.4
The range = 17.4 – 0.8 = 16.6
2. The same steps apply
data(“USArrests”)
x<-USArrests$Rape
range(x)
## [1] 7.3 46.0
The range = 46.0 – 7.3 = 38.7
3. The regicor data is part of the compareGroups package in R, so we load the package (using library function) then load the data using data function.
We add the argument, na.rm = TRUE, to the range function to exclude the missing values.
# load package
library(compareGroups)
# load the data
data(“regicor”)
x<-regicor$phyact
range(x, na.rm = TRUE)
## [1] 0.000 5083.187
So the range = 5083.187-0 = 5083.187. Note the very high range.
4. The same steps apply
# load package
library(compareGroups)
# load the data
data(“regicor”)
x<-regicor$bmi
range(x, na.rm = TRUE)
## [1] 17.14678 48.24129
So the range = 48.24129-17.14678 = 31.09451
5. From the plot, Katrina storm (green dots) has the highest range (more dispersed points), and Kate storm (red dots) has the lowest range (less dispersed points).