JUMP TO TOPIC
Exponential Function – Properties, Graphs, & Applications
 You may have encountered expressions where $x$ or any other variable is an exponent in your Algebra class. If this is true, then you may have your first encounters with exponential functions. These functions help construct real-world models such as bacterial growth, compound interest rates, and exponential decay.
This is why learning about exponential functions, knowing how to manipulate them, and graphing exponential functions is essential. Here’s a quick definition of exponential functions to get us started.
Exponential functions are functions that contain a constant base and algebraic expressions (or variables) on their exponents.
Make sure to take notes while going through this article as we’ll discuss the following elements of exponential functions:
- Identifying exponential functions and learning their definition.
- Learning the components of exponential functions’ graphs.
- Studying real-world examples that can be modeled through exponential functions.
Let’s begin with a more thorough understanding of what makes up an exponential function.
What is an exponential function?
As we have mentioned in the earlier section, exponential functions contain variables in their exponents. This section will show why we have the general form of the exponential function as shown below.
\begin{aligned}y &= {\color{green}b}^{\color{blue}x }\\ \color{green} b&: \color{green}\text{base }\\\color{blue} x&: \color{blue}\text{exponent }\end{aligned}
It’s important to keep in mind that $b$ must be a positive number except for $1$ (meaning, $b >0$ but $b \neq 1$).
Let’s go ahead and break down this general form and find examples of exponential functions using this definition.
Exponential functions definition and examples
From the general form of exponential functions, we can see that they are the functions that contain a base, $b$, such that it is any real and positive number other than one. This means $b$ can be $3$, $8$, and even $e$.
As for the exponent part, as long as the function contains variables and algebraic expressions in the exponent such as $x$, $x – 1$, and $4x – 2$, the exponential function will be valid.
Let’s use these bases and exponents to construct some examples of exponential functions.
- $y = 3^x$
- $y = 8^{x – 1}$
- $f(x) = e^{4x – 2}$
- $g(x) = 3^x – 2$
These four examples of exponential functions show expressions that satisfy the general form’s condition, $y = b^x$, where $b>0$ but $b \neq 1$.
How to graph exponential functions?
We can graph any form of exponential functions by creating a table of values and tracing the curve through the points. Here are some helpful steps to remember when graphing exponential functions:
- Assign some values of $x$ and $y$ that satisfy the given exponential function.
- Use the table of values to plot the different ordered pairs, $(x, y)$.
- Connect the points representing the ordered pairs with a curve to graph the function.
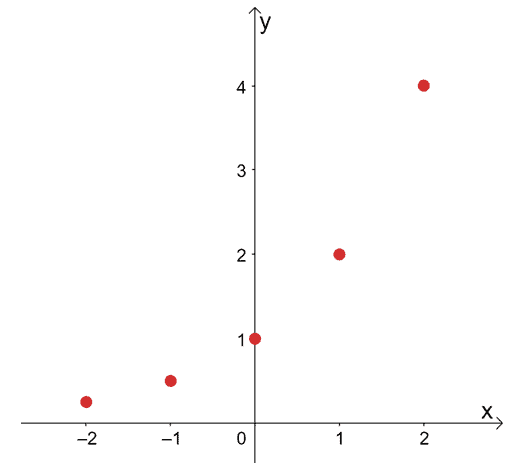
Why don’t we go ahead and apply these steps for $y = 2^x$?
Let’s assign some values for $x$ then determine the corresponding values of $y$.
$\boldsymbol{x}$ | $\boldsymbol{y}$ | $\boldsymbol{(x, y)}$ |
$-2$ | $2^{\color{blue}-2} = \dfrac{1}{4}$ | $\left(-2, \dfrac{1}{4}\right)$ |
$-1$ | $2^{\color{blue}-1} = \dfrac{1}{2}$ | $\left(-1, \dfrac{1}{2}\right)$ |
$0$ | $2^{\color{blue}0} = 1$ | $(0, 1)$ |
$1$ | $2^{\color{blue}1} = 2$ | $(1, 2)$ |
$2$ | $2^{\color{blue}2} = 4$ | $(2, 4)$ |
Now that we have some points to guide us in graphing $y = 2^x$, let’s first plot these points on an $xy$-coordinate system.
We can then graph the function, $y = 2^x$, by connecting the curve using the points as a guide.
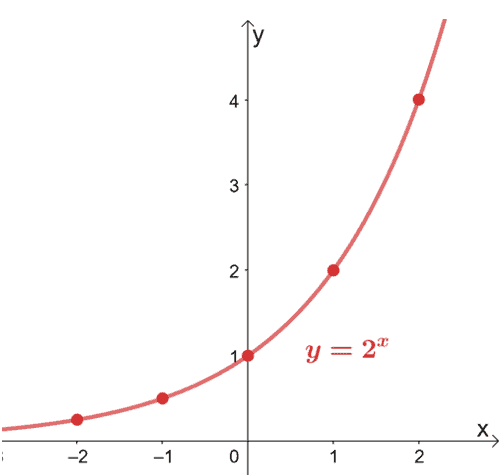
Hence, we have a graph of $y = 2^x$ as shown by the image above. Notice how the graph never crosses the $x$-axis? That’s because $2^x$ can never be equal to $0$. This means that $y = 2^x$ has a horizontal asymptote at $y = 0$.
We can apply the same process to graph $y = \dfrac{1}{2}^x$. Once we have the graph of $y = \dfrac{1}{2}^x$, let’s compare the graphs of $y = 2^x$ and $y = \dfrac{1}{2}^x$.
First, construct another set of table of values that satisfy the function, $y = \dfrac{1}{2}^x$.
$\boldsymbol{x}$ | $\boldsymbol{y}$ | $\boldsymbol{(x, y)}$ |
$-2$ | $\dfrac{1}{2}^{\color{blue}-2} = 4$ | $(-2, 4)$ |
$-1$ | $\dfrac{1}{2}^{\color{blue}-1} =2 $ | $(-1, 2)$ |
$0$ | $\dfrac{1}{2}^{\color{blue}0} = 1$ | $(0, 1)$ |
$1$ | $\dfrac{1}{2}^{\color{blue}1} = \dfrac{1}{2}$ | $\left(1, \dfrac{1}{2}\right)$ |
$2$ | $\dfrac{1}{2}^{\color{blue}2} = \dfrac{1}{4}$ | $\left(2, \dfrac{1}{4}\right)$ |
Plot the five points, then connect them with a curve representing $y = \dfrac{1}{2}^x$.
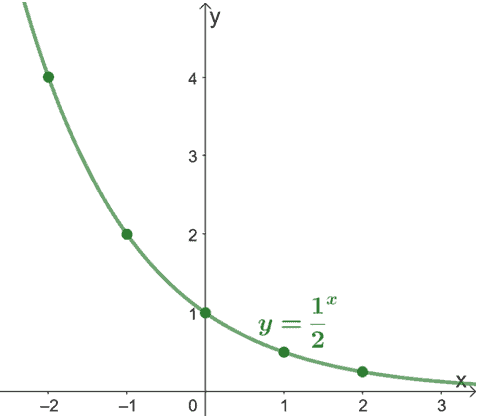
Hence, we have the graph of $y = \dfrac{1}{2}^x$, as shown above. For this graph, we can also see that the function has a horizontal asymptote at $y = 0$.
Why don’t we go ahead and compare the graphs of the two functions?
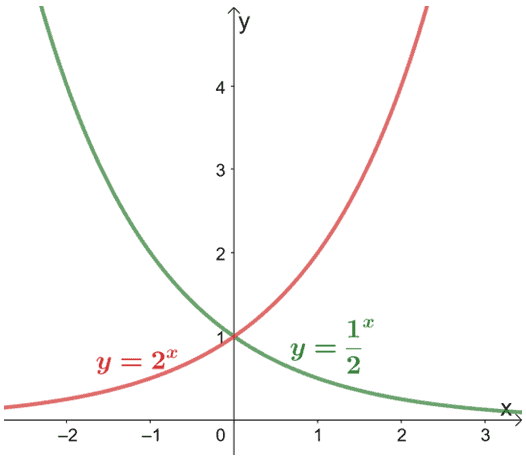
Let’s compare the two graphs – the two graphs are also symmetric along the $y$-axis. This is true for all functions of the form $y = k^x$ and $\dfrac{1}{k}^x$, where $k$ is a positive constant.
In addition, $y = 2^x$ is drastically increasing as $x$ increases while $y = \dfrac{1}{2}^x$’s value drastically decreases as $x$ increases. The behaviors of the two graphs are good examples of exponential growth and decay.
Exponential growth
Functions reflect them with a greater base than $1$, such as $y = 2^x$. When the graph is significantly increasing as $x$ is increasing, the exponential function is exhibiting exponential growth.
The direction of the graph should be similar to that of $y = 2^x$.
Exponential Decay
As you may have guessed, these are the functions that have values that are significantly decreasing as $x$ increases. When the base is less than $1$ or in short, there are fractions such as $y = \dfrac{1}{2}^x$.
The graph of $y = \dfrac{1}{2}^x$ exhibits exponential decay and graphs of functions that exhibit exponential decay.
Here are some other important properties to keep in mind when graphing exponential functions:
- If the function is of the form, $y = b^x$, the graph of the exponential function will always pass through $(0, 1)$ and $(1, b)$. It will also have a horizontal asymptote at $y=0$.
- If the function is of the form, $y = ab^x$, the exponential function graph will always pass through $(0, a)$ and $(1, ab)$. The graph will also have a horizontal asymptote at $y = 0$.
- If the function is of a more complex form, $y = ab^{x – c} + d$, the graph of the exponential function will pass through $(c, a +d)$. In addition, the graph will have a horizontal asymptote at $y = d$.
How to find an exponential function from a graph?
What if we need to do the reverse? When given the graph of an exponential function, we can also determine the graph’s expression by inspecting the points the curve passes through. Here are some important reminders when trying to find the exponential function:
- Inspect the $y$-coordinate of the exponential function. If it’s $y = 1$, the function is of the form $y = b^x$.
- If the $y$-coordinate is a constant or equal to $y = a$, then it may be of the form $y = ab^x$. Find the value of $b$ by observing the value of $y$ when $x =1$.
- When the function’s $y$-coordinate doesn’t pass through these, it’s best to slowly inspect the other values and see if they satisfy a more complex form.
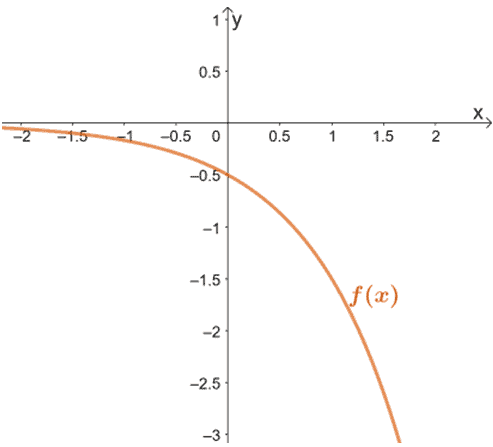
Since the curve of $f(x)$ passes through $\left(0, -\dfrac{1}{2}\right)$ and $\left(1, -\dfrac{3}{2}\right)$, we know that $f(x)$ is of the form, $y = ab^x$.
We can find the value of $a$ by using the $y$-coordinate of the graph, so $a = -\dfrac{1}{2}$. We can use the second ordered pair to calculate the value of $b$.
\begin{aligned}y &= ab^x\\-\dfrac{3}{2}&= -\dfrac{1}{2}(b)^1\\-\dfrac{3}{2}&=-\dfrac{b}{2}\\b&=3 \end{aligned}
Now that we have $a = -\dfrac{1}{2}$ and $b = 3$, the exponential function’s expression is $f(x) = -\dfrac{1}{2}\cdot 3^x$.
These are the concepts and topics that we need to learn for now about exponential functions. Let’s check our knowledge by trying out the problems below!
Example 1
Use the fact that $h(x) = \dfrac{1}{3}^x – 2$ and answer the following questions.
a. What is the value of $h(-3)$? What would the point on the graph be?
b. If $h(x) = -\dfrac{17}{9}$, what is the value of $x$? What would the point on the graph be?
c. Use these two points to make a quick sketch of the graph of $h(x)$.
d. Will $h(x)$ be increasing? At what value does it approach as $x$ approaches infinity?
Solution
To find $h(-3)$, we simply substitute $x = -3$ into the expression for $h(x)$.
\begin{aligned}h(x)&= \dfrac{1}{3}^x – 2\\h(-3)&= \dfrac{1}{3}^{-3} – 2\\&= 3^{-1 \cdot -3} – 2\\&=3^3 – 2\\&= 27 – 2\\&=25\end{aligned}
This means that $h(-3) = 25$ and the point that represents this on the graph will be $(-3, 25)$.
Now, we’re given the value of $h(x)$. To find the value of $x$, we equate the expression of $h(x)$ to $-\dfrac{17}{9}$.
\begin{aligned}h(x)&= -\dfrac{17}{9}\\\dfrac{1}{3}^x – 2 &= -\dfrac{17}{9}\end{aligned}
To isolate $x$, we add $2$ to both sides of the equation. Express the right-hand side as a power of $\dfrac{1}{3}$
\begin{aligned}h(x)&= -\dfrac{17}{9}\\\dfrac{1}{3}^{\displaystyle{x}}-2 &= -\dfrac{17}{9}\\\dfrac{1}{3}^{\displaystyle{x}} &= -\dfrac{17}{9}+2\\\dfrac{1}{3}^{\displaystyle{x}} &= \dfrac{1}{9}\\\dfrac{1}{3}^{\displaystyle{x}} &= \dfrac{1}{3}^{\displaystyle{2}}\\x &= 2\end{aligned}
Hence, $x$ is equal to $2$ when $h(x) = -\dfrac{17}{9}$. On the graph, this will be represented by $\left(2, -\dfrac{17}{9}\right)$.
Let’s use the two points, $(-3, 25)$ and $\left(2, -\dfrac{17}{9}\right)$, and plot these two on graph. Once we have the points on the graph, we can connect the two points with a curve to graph $h(x)$. Here are some helpful reminders when graphing $h(x)$:
- The graph will have a horizontal asymptote at $y = -2$.
- It will also pass through the $y$-intercept at $(0, -1)$.
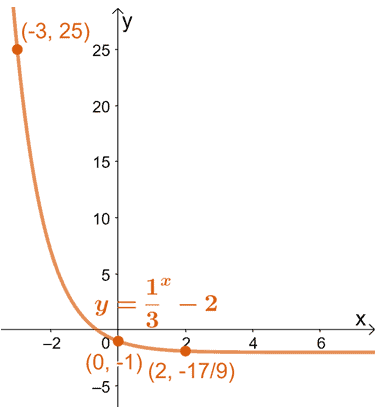
Hence, we have the graph of $h(x)$ as shown above.
From this, we can confirm that as $x$ increases, the value of $h(x)$ drastically decreases. This actually makes sense since the base is a fraction, and we’re expecting $h(x)$ to be exponentially decaying.
Since $h(x)$ has a horizontal asymptote at $y = -2$, the value of $h(x)$ approaches $-2$ as $x$ approaches infinity.
Example 2
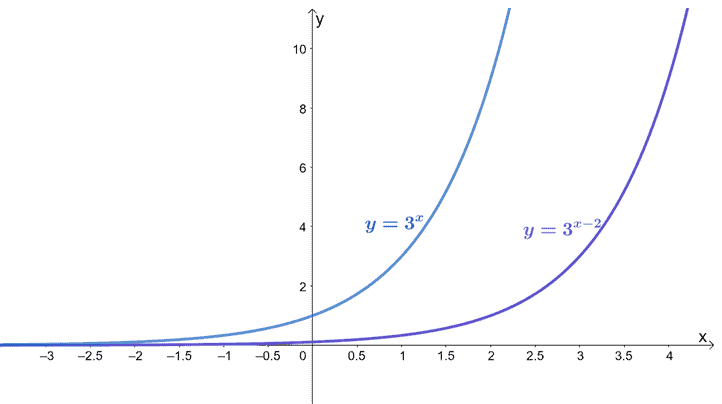
Graph the exponential function, $y = 3^x$, by first creating its table of values. Use the resulting graph of $y= 3^x$ to graph the following exponential functions.
- $y = 3^{x – 2}$
- $y = 3^x + 2$
- $y = \dfrac{1}{3}^x$
Solution
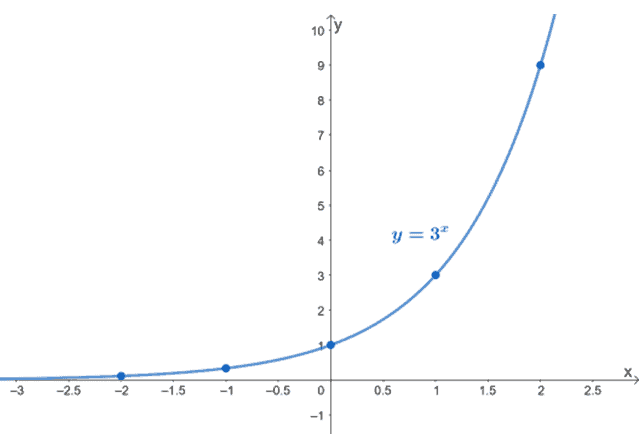
We can begin by constructing the table of values for the initial function, $y = 3^x$. We can do this by assigning appropriate values for $x$.
$\boldsymbol{x}$ | $\boldsymbol{y}$ | $\boldsymbol{(x, y)}$ |
$-2$ | $3^{\color{blue}-2} = \dfrac{1}{9}$ | $\left(-2, \dfrac{1}{9}\right)$ |
$-1$ | $3^{\color{blue}-1} = \dfrac{1}{3}$ | $\left(-1, \dfrac{1}{3}\right)$ |
$0$ | $3^{\color{blue}0} = 1$ | $(0, 1)$ |
$1$ | $3^{\color{blue}1} = 3$ | $(1, 3)$ |
$2$ | $3^{\color{blue}2} = 9$ | $(2, 9)$ |
Plot the five ordered pairs on the $xy$-coordinate system. Connect these points with a curve to graph $y = 3^x$.
To graph $y = 3^{x – 2}$ and $y = 3^x + 2$, we simply apply transformations we’ve learned in the past- in particular, horizontal and vertical translations.
This means that the graph of $y = 3^{x – 2}$ can be plotted by simply translating $y = 3^x$ two units to the right.
Similarly, we can graph $y = 3^x + 2$ by shifting $y = 3^x$ two units upward.
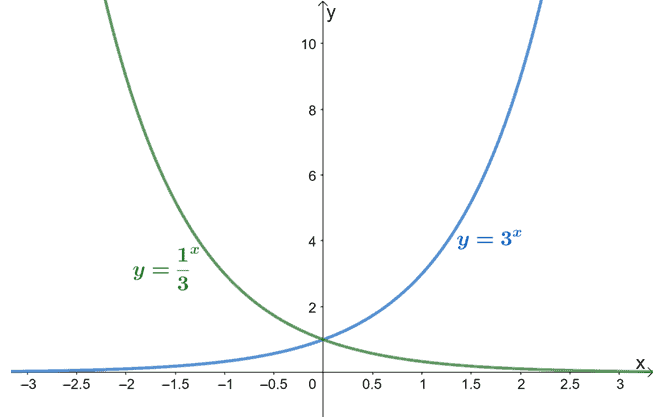
Recall that given two exponential functions, $y = k^x$ and $y = \dfrac{1}{k}^x$, their graphs will be symmetric along the $y$-axis. Hence, to graph $y = \dfrac{1}{3}^x$, we simply reflect $y = 3^x$ along the $y$-axis.
This problem shows that we can also graph exponential functions by transforming the graphs of simpler exponential functions.
Example 3
Find an exponential function of the form, $y = ab^x$, that passes through the points, $(-2, 1)$ and $(3, 32)$.
Solution
Since we’re given two ordered pairs, we can substitute the corresponding values of $x$ and $y$ into the exponential function’s general form.
$\boldsymbol{(x, y)}$ | $\boldsymbol{y = ab^x}$ |
$(-2, 1)$ | \begin{aligned}y &= ab^x\\1&= ab^{-2}\\a&=b^2 \end{aligned} |
$(3, 32)$ | \begin{aligned}y &= ab^x\\32&= ab^{3}\\a&= \dfrac{32}{b^3} \end{aligned} |
Let’s replace $a = b^2$ into the second equation, $a = \dfrac{32}{b^2}$, to find the values of $b$.
\begin{aligned}b^2 &= \dfrac{32}{b^3}\\b^5 &= 32\\b^5 &= 2^5\\b&= 2 \end{aligned}
Now that we have $b = 2$, we can find $a$ using either of the equations. We’ll use the first one since it’s simpler.
\begin{aligned}a &= b^2 \\&= 2^2\\&= 4 \end{aligned}
Substitute these values into the general form to find the exponential function that we need.
\begin{aligned}y &= ab^x\\y&= 4 \cdot 2^x\end{aligned}
This means that the exponential function we’re looking at is equal to $y = 4\cdot 2^x$.
Example 4
Determine the expressions for the exponential functions, $f(x)$, $g(x)$, and $h(x)$ using their graphs shown below.
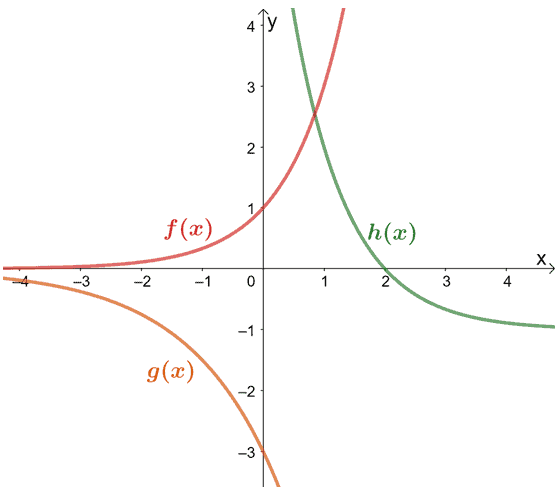
Take note that when extended, $g(x)$ passes through $(1, -6)$ and $h(x)$ passes through $(0, 8)$.
Solution
Let’s begin by finding the expression for $f(x)$. Since the graph passes through $(0, 1)$, we’re expecting it to be of the form, $f(x) = b^x$.
To find the value of $b$, let’s inspect the function’s value when $x = 1$. Since $x = 1$ when $f(x) = 3$, so $\boldsymbol{f(x) = 3^x}$.
As for the graph of $g(x)$, we can see that its $y$-coordinate passes through $(0, -3)$, so its general form must be of $y = ab^x$ and $a = -3$.
Since $g(x)$ also passes through $(1, -6)$, we can use this to find the value of $b$.
\begin{aligned}y &= (-3)b^x\\-6&=(-3)b^1\\-6&= -3b\\b&= 2\end{aligned}
This means that $\boldsymbol{g(x)}$ is equal to $\boldsymbol{-3\cdot 2^x}$.
Moving along with $h(x)$, we can see that it must be of a complex form, so we start by first taking note of the horizontal asymptote and making using of the exponential function’s general form, $y = ab^{x – c} + d$.
Since the horizontal asymptote is equal to $y = -1$, so $d$ must be equal to $-1$. Let’s also observe the values that the graph passes through: $(1, 2)$, $(2, 0)$, and $(0, 8)$.
Let’s substitute these values of $x$ and $y$ and see if we can the values of $a$, $b$, and $c$.
We can begin by seeing the result when we substitute $x = 0$ and $y = 8$.
\begin{aligned} y &= ab^{x – c} -1\\8&= ab^{0 – c} – 1\\9&=ab^{-c}\\9&=\dfrac{a}{b^c}\end{aligned}
Now, let’s move on to observing how the expressions behave when $x = 2$ and $y = 0$.
\begin{aligned} y &= ab^{x – c} -1\\0&= ab^{2 – c} – 1\\1&=ab^{2 -c}\end{aligned}
Manipulating $ab^{2 – c}$ and using $9 = \dfrac{a}{b^c}$, we have the following:
\begin{aligned} 1&=ab^{2 -c}\\ &= ab^2 b^{-c}\\&=b^2 \dfrac{a}{b^c}\\\\1&=b^2(9)\\b^2&= \dfrac{1}{9}\end{aligned}
Since $b$ can never be negative $b = \dfrac{1}{3}$. Since the graph does not stretch vertically, we’re expecting $a$ to be $1$.
We can now find the value of $c$ using the equations, $1=ab^{2 -c}$.
\begin{aligned}1&=ab^{2 -c}\\1&= 1\left(\dfrac{1}{3}\right)^{2 – c}\\1&= \left(\dfrac{1}{3}\right)^{2 – c}\end{aligned}
For this to be true, $2 – c$ must be equal to $0$, so $c = 2$.
Let’s now substitute the necessary values into the general expression, $y = ab^{x – c} + d$.
\begin{aligned}a &= 1\\b&= \dfrac{1}{3}\\c&= 2\\d &=-1\\\\y &= ab^{x – c} + d\\&=1\left(\dfrac{1}{3} \right )^{x-2} – 1\\&= \dfrac{1}{3}^{x – 2} – 1\end{aligned}
This means that $\boldsymbol{h(x) = \dfrac{1}{3}^{x – 2} – 1}$.
Practice Questions
Open Problem
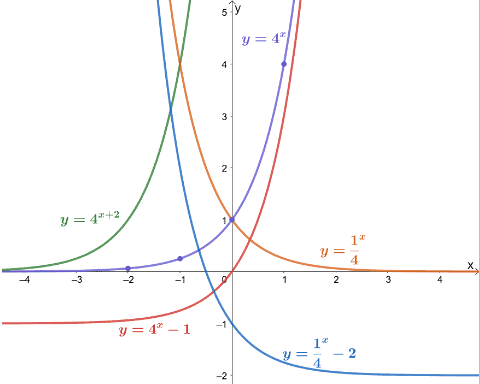
Graph the exponential function, $y = 4^x$, by first creating its table of values. Use the resulting graph of $y= 4^x$ to graph the following exponential functions.
- $y = 4^{x + 2}$
- $y = 4^x – 1$
- $y = \dfrac{1}{4}^x$
- $y = \dfrac{1}{4}^x – 2$
Open Problem Solution
Images/mathematical drawings are created with GeoGebra.