JUMP TO TOPIC
Graphing Cubic Function – Explanation and Examples
 Graphing cubic functions gives a two-dimensional model of functions where x is raised to the third power.
Graphing cubic functions is similar to graphing quadratic functions in some ways. In particular, we can use the basic shape of a cubic graph to help us create models of more complicated cubic functions.
Before learning to graph cubic functions, it is helpful to review graph transformations, coordinate geometry, and graphing quadratic functions. Graphing cubic functions will also require a decent amount of familiarity with algebra and algebraic manipulation of equations.
In this section, we will go over:
- How to Graph a Cubic Function
How to Graph a Cubic Function
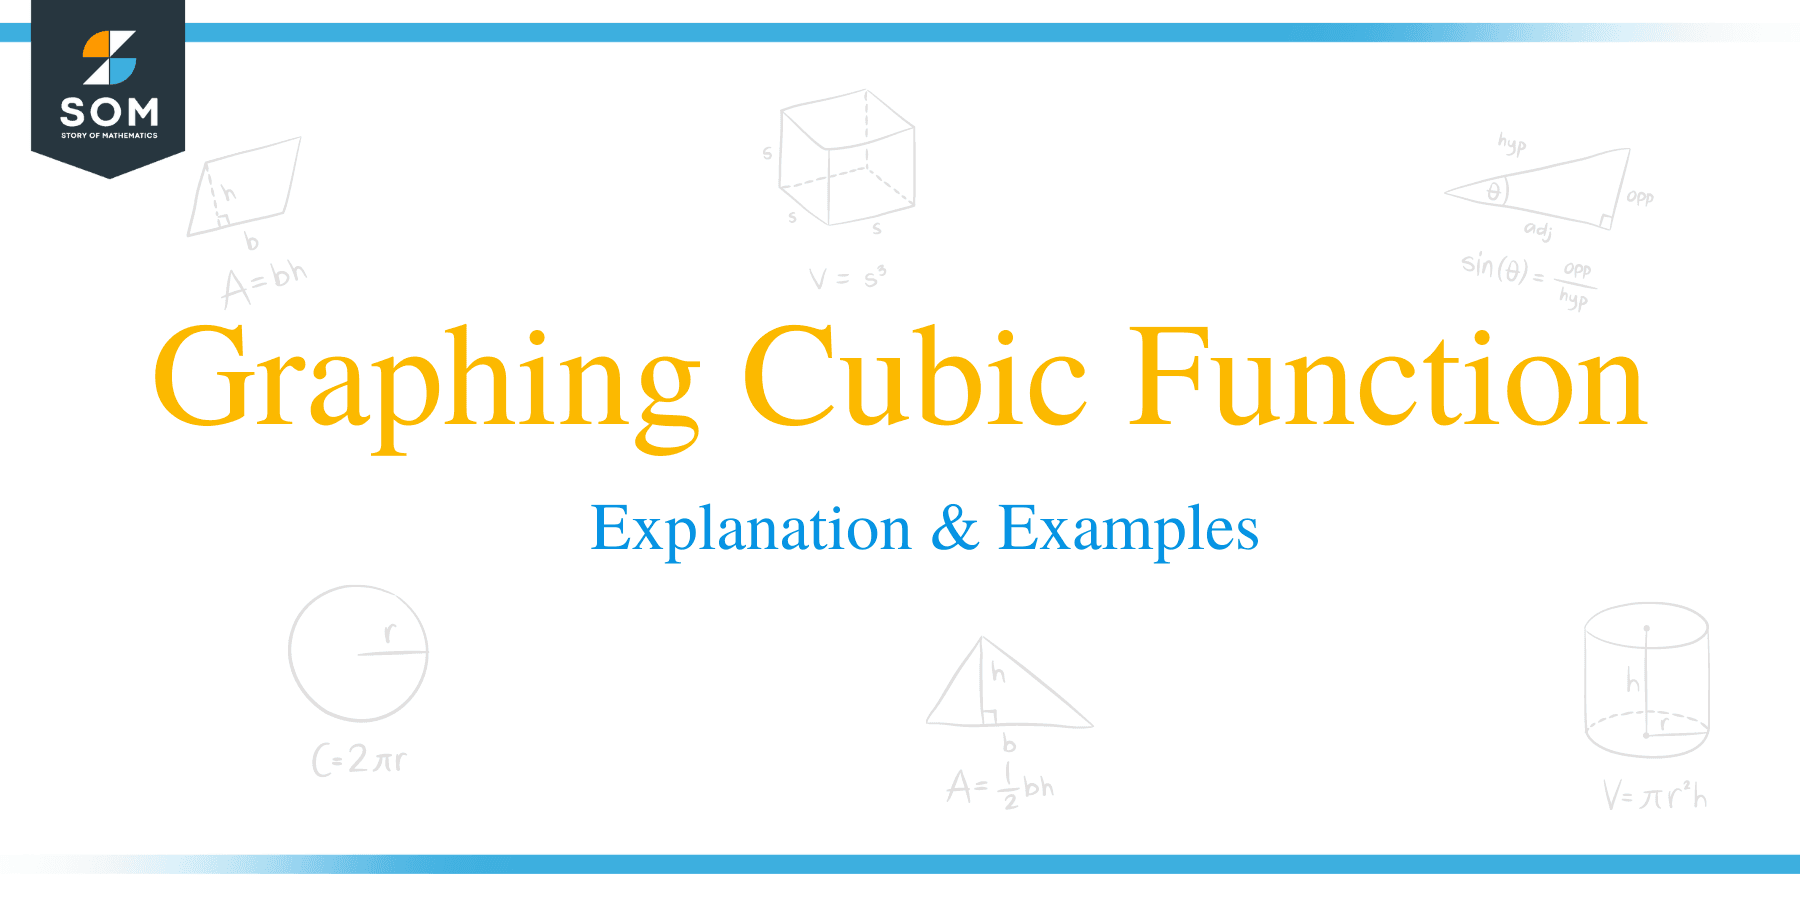
Before graphing a cubic function, it is important that we familiarize ourselves with the parent function, y=x3.
There are methods from calculus that make it easy to find the local extrema. In particular, we can find the derivative of the cubic function, which will be a quadratic function. Then, we can use the key points of this function to figure out where the key points of the cubic function are. This will be covered in greater depth, however, in calculus sections about using the derivative.
Here, we will focus on how we can use graph transformations to find the shape and key points of a cubic function.
Key Points of the Parent Function
The parent function, x3, goes through the origin. It has a shape that looks like two halves of parabolas that point in opposite directions have been pasted together.
Vertex
The vertex of the cubic function is the point where the function changes directions. In the parent function, this point is the origin.
To shift this vertex to the left or to the right, we can add or subtract numbers to the cubed part of the function. For example, the function (x-1)3 is the cubic function shifted one unit to the right. In this case, the vertex is at (1, 0).
To shift this function up or down, we can add or subtract numbers after the cubed part of the function. For example, the function x3+1 is the cubic function shifted one unit up. Its vertex is (0, 1).
Reflection
As before, if we multiply the cubed function by a number a, we can change the stretch of the graph. For example 0.5x3 compresses the function, while 2x3 widens it.
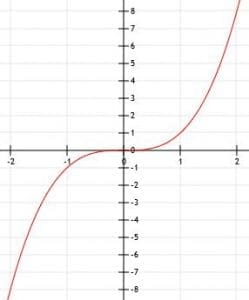
If this number, a, is negative, it flips the graph upside down as shown.
The y-intercept
As with quadratic functions and linear functions, the y-intercept is the point where x=0. To find it, you simply find the point f(0).
In the parent function, the y-intercept and the vertex are one and the same. In the function (x-1)3, the y-intercept is (0-1)3=-(-1)3=-1.
The x-intercepts.
Unlike quadratic functions, cubic functions will always have at least one real solution. They can have up to three. For example, the function x(x-1)(x+1) simplifies to x3-x. From the initial form of the function, however, we can see that this function will be equal to 0 when x=0, x=1, or x=-1.
There is a formula for the solutions of a cubic equation, but it is much more complicated than the corresponding one for quadratics:
3√((-b³/27a³+bc/6a²–d/2a²)+√((-b³/27a³+bc/6a²–d/2a²)²+(c/3a–b²/9a²)³))+3√((-b³/27a³+bc/6a²–d/2a²)+√((-b³/27a³+bc/6a²–d/2a²)²-(c/3a–b²/9a²)³))–b/3a.
This is a rather long formula, so many people rely on calculators to find the zeroes of cubic functions that cannot easily be factored.
Examples
This section will go over how to graph simple examples of cubic functions without using derivatives.
Example 1
Graph the function -x3.
Example 1 Solution
The only difference between the given function and the parent function is the presence of a negative sign. If we multiply a cubic function by a negative number, it reflects the function over the x-axis.
Thus, the function -x3 is simply the function x3 reflected over the x-axis. Its vertex is still (0, 0). This point is also the only x-intercept or y-intercept in the function.
Example 2
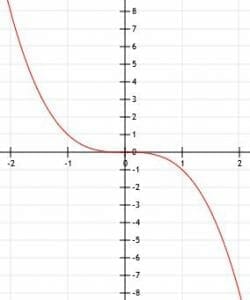
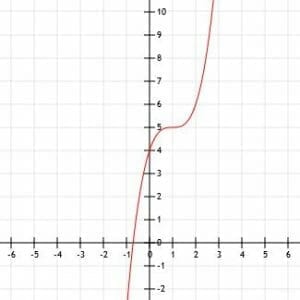
Graph the function (x-2)3-4.
Example 2 Solution
Again, we will use the parent function x3 to find the graph of the given function.
In this case, we need to remember that all numbers added to the x-term of the function represent a horizontal shift while all numbers added to the function as a whole represent a vertical shift.
In the given function, we subtract 2 from x, which represents a vertex shift two units to the right. This may seem counterintuitive because, typically, negative numbers represent left movement and positive numbers represent right movement. In graph transformations, however, all transformations done directly to x take the opposite direction expected.
We also subtract 4 from the function as a whole. This means that we will shift the vertex four units downwards.
Other than these two shifts, the function is very much the same as the parent function. The vertex will be at the point (2, -4).
The new y-intercept will be:
(0-2)3-4
-8-4
Thus, the point is (0, -12).
We can solve this equation for x to find the x-intercept(s):
0=(x-2)3-4
4=(x-2)3.
At this point, we have to take the cubed root of both sides. This gives us:
∛(4)=x-2
∛(4)+2=x.
The decimal approximation of this number is 3.59, so the x-intercept is approximately (3.59, 0).
Thus, we graph the function as below.
Example 3
Simplify the function x(x-2)(x+2). Then, find the key points of this function.
Example 3 Solution
In the current form, it is easy to find the x- and y-intercepts of this function.
Setting x=0 gives us 0(-2)(2)=0. Thus, the y-intercept is (0, 0). This will also, consequently, be an x-intercept.
In this case, however, we actually have more than one x-intercept. If x=2, the middle term, (x-2) will equal 0, and the function will equal 0. Likewise, if x=-2, the last term will be equal to 0, and consequently the function will equal 0.
Thus, we have three x-intercepts: (0, 0), (-2, 0), and (2, 0).
Expanding the function gives us x3-4x. Since we do not add anything directly to the cubed x or to the function itself, the vertex is the point (0, 0).
Consequently, the function corresponds to the graph below.
Example 4
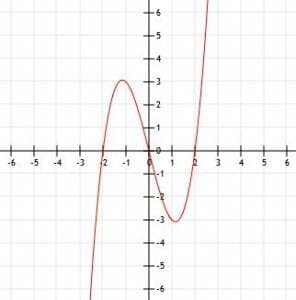
Simplify and graph the function x(x-1)(x+3)+2. Then, find the key points of this function.
Example 4 Solution
Let’s suppose, for a moment, that this function did not include a 2 at the end. The x-intercepts of a function x(x-1)(x+3) are 0, 1, and -3 because if x is equal to any of those numbers, the whole function will be equal to 0. The y-intercept of such a function is 0 because, when x=0, y=0.
Expanding the function x(x-1)(x+3) gives us x3+2x2-3x. Again, since nothing is directly added to the x and there is nothing on the end of the function, the vertex of this function is (0, 0).
Now, let’s add the 2 onto the end and think about what this does.
Effectively, we just shift the function x(x-1)(x+3) up two units. We can add 2 to all of the y-value in our intercepts.
That is, we now know the points (0, 2), (1, 2) and (-3, 2). The first point, (0, 2) is the y-intercept.
The x-intercept of this function is more complicated. For graphing purposes, we can just approximate it by shifting the graph of the function x(x-1)(x+3) up two units, as shown.
Example 5
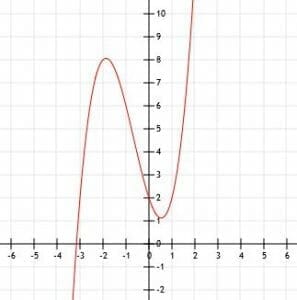
Determine the algebraic expression for the cubic function shown. Make sure to also identify any key points.
Example 5 Solution
The shape of this function looks very similar to and x3 function. We can see if it is simply an x cubed function with a shifted vertex by determining the vertex and testing some points.
It looks like the vertex is at the point (1, 5). We can also see the points (0, 4), which is the y-intercept, and (2, 6).
If the function is indeed just a shift of the function x3, the location of the vertex implies that its algebraic representation is (x-1)3+5.
If x=0, this function is -1+5=4. The point (0, 4) would be on this graph.
Likewise, if x=2, we get 1+5=6. Again, the point (2, 6) would be on that graph.
Thus, it appears the function is (x-1)3+5.