- Home
- >
- Graphing Linear Equations – Explanation & Examples
JUMP TO TOPIC
Graphing Linear Equations – Explanation and Examples
 Graphing linear equations requires using information about lines, including slopes, intercepts, and points, to convert a mathematical or verbal description into a representation of a line in the coordinate plane.
Though there are many ways to do this, this article will focus on how to use the slope-intercept form to graph a line. If you need a refresher on linear equations or graphing, make sure you review before moving forward with this section.
This topic will cover:
- How to Graph Linear Equations
- How to Find the Slope of a Linear Equation
- Slope-Intercept Form
- Point-Slope Form
- Standard Form
- How to Find the Intercept of a Linear Equation
How to Graph Linear Equations
Recall that any line can be defined by two points. Therefore, in order to graph a line, we just need to find two points and connect them.
Since lines go on forever, a graphical representation will usually include a line segment with arrows on both ends to show that the line continues infinitely in both directions.
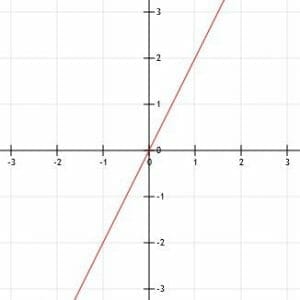
We can also graph the line if we know one point and the slope. In particular, the slope will help us find the second point needed to draw the line.
How to Find the Slope of a Linear Equation
Often, we are given a linear equation and asked to graph the line from that. In this case, we will need to use the equation to find the slope and a point on the line.
The process for finding the slope of a line based on a linear equation depends on the type of linear equation presented.
Slope-Intercept Form
Slope-intercept form makes it easy to find the slope of a line. Recall that any linear equation in slope-intercept form looks like this:
y=mx+b.
In this equation, m is the slope of the line and b is the y-intercept. Therefore, we can read off the slope by finding the coefficient of x.
Point-Slope Form
It is also simple to find the slope of a line when the linear equation for it is in point-slope form. Recall that a linear equation in point-slope form looks like this:
y-y1=m(x-x1).
In this equation, m is the slope, and (x1, y1) is any point on the line. Therefore, we can again find the slope easily by finding the number in front of the open parenthesis.
Standard Form
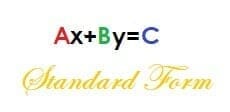
Finding the slope from standard form requires a little bit more algebraic manipulation. Recall that an equation written in standard form looks like this:
Ax+By=C.
In this equation, A is positive, and A, B, and C are whole numbers.
Let’s convert this equation to slope-intercept form to find the slope. We can do this by solving for y.
By=-Ax+C
y=-A/Bx+C/B.
Now, this equation is in slope-intercept form. Therefore, the slope is -A/B.
How to Find the Intercept of a Linear Equation
If we know the slope of a line, we can graph it once we find a point. Often, the easiest point to use is the y-intercept, which is the place where the line crosses the y-axis. It will always be of the form (0, b), where b is some real number.
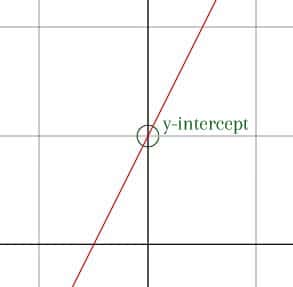
If the y-intercept isn’t clear, we can use a different point as long as we know the slope.
Slope-Intercept Form
If we are given the slope-intercept form of a line’s equation, we are luck. It is super easy to find the y-intercept of slope-intercept form. As mentioned above, slope-intercept form is:
y=mx+b,
where m is the slope and b is the y-intercept. That is, whatever term in the equation does not have a variable is the y-intercept!
Point-Slope Form
Point-slope form tells us the slope of a line and one point on it. Sometimes, this point is the y-intercept, but sometimes it is not.
More often, it makes sense to algebraically manipulate the point-slope form and turn it into slope-intercept form. We can do this as follows, starting with the point-slope equation: y-y1=m(x-x1).
Then, distribute the slope:
y-y1=mx-mx1.
Finally, add y1 to both sides:
y=mx-mx1+y1.
Since x1 and y1 are both just numbers, y=mx-mx1+y1 is in slope-intercept form and mx1+y1 is the y-intercept. We can then proceed in graphing the line as above.
Standard Form
Earlier, we showed that we can convert standard form to slope-intercept form:
y=-A/Bx+C/B.
The term without any variable, C/B, is the y-intercept. We can now use this value to graph the equation, just as we did when presented with equations in slope-intercept form.
Examples
In this section, we will provide examples of how to use the slope and intercept to graph a line and step-by-step solutions.
Example 1
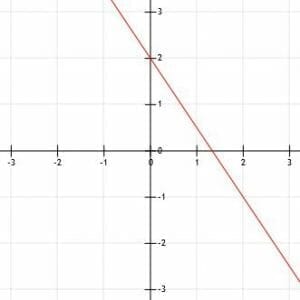
The line k has slope-intercept form: y=-3/2+2. Graph the line k.
Example 1 Solution
The line k is already in slope-intercept form. This makes it easy to find the information we need to graph it.
First, we need to find one point. The y-intercept, b, is the obvious choice. Since b=2, the y-intercept is the point (0, 2). That is, the y-intercept is on the y-axis, two units above the x-axis.
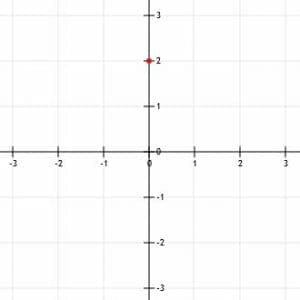
Now, we can use the slope to find another point on the graph. Again, since the given equation is in slope-intercept form, we know the slope is the coefficient of x, –3/2.
Notice that, if we read the slope out loud, we call it “minus three over two.” This means we can find a second point by going “down three (units), over two (units right).” Just remember that a negative number means down, while a positive number means up. In either case, move to the right when you say “over.”
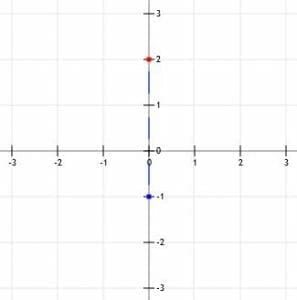
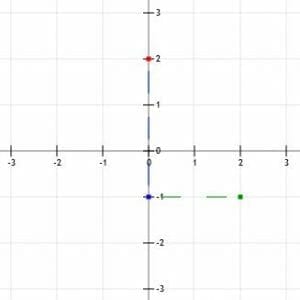
Now, we have two points, (0, 2) and (2, -1). We should then line up a straight edge so that it aligns with the two points and trace a line through them. Ideally, this line should go a little beyond both points.
Finally, add arrows to the line segment to show it continues in both directions infinitely.
Example 2
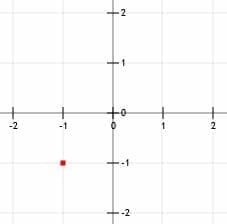
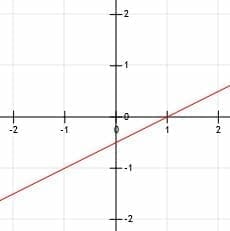
A line k passes through the point (-1, -1) and has a slope of 1/2. Find the graph of k.
Example 2 Solution
Though graphing with the y-intercept is a great strategy, it does not always work. This example illustrates why.
Let’s use the given slope and point to find one version of the point-slope form of this equation: y+1=1/2(x+1).
Now, we can manipulate this equation to put it in slope-intercept form:
y+1=1/2x+1/2.
y=1/2x-1/2.
In this case, the y-intercept is not a whole number. While it is certainly possible to graph fractions, it is easier to graph numbers that land on grid lines. In this case, starting at the point (-1, -1) might make more sense.
First, plot the known point.
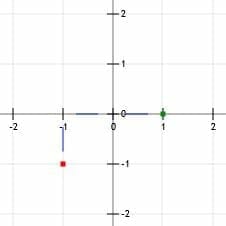
Again, we read the slope out loud as “1 over 2.” This means we can find a second point by locating the coordinates that are “up one (unit) over two (units right).”
Going up one gets us to the point (-1, 0), while going over two gets us to the point (1, 0).
Now, as in example 1, we can draw a line through the two points with arrows on the end.
Example 3
A line k has the equation 4x+3y=-6 when written in standard form. What is the graph of k?
Example 3 Solution
The line is in standard form. In order to graph it, we have to find a point and the slope. To make things simple, let’s see if we can use the y-intercept.
Recall from above that the y-intercept for a line whose equation is in standard form is C/B. In this case, that is –6/3=-2.
Likewise, we know from above that the slope of a line whose equation is in standard form is -A/B. Consequently, the slope of this line is -4/3.
Now, to graph this line, we need to first plot the y-intercept at (0, -2). This is a point on the y-axis two units below the x-axis.
Then, we can use the slope to help us find another point. To keep the graph simple, we may want to find a point to the upper left of the y-intercept, instead of one to the bottom right. To do this, we just do the reverse of what we have been doing. Rather than going “down 4 (units) over 3 (units right),” we reverse both directions. Now, we will mark the point “up 4 (units) over 3 (units left).”
Going up four units brings us to the point (0, 2). Going 3 units left brings us to (-3, 2). Note that we can get from this point to the y-intercept by using the “down 4 over 3” strategy.
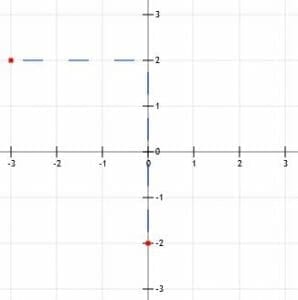
Now we can connect the two points with a line, extend the line through the points, and add arrows.
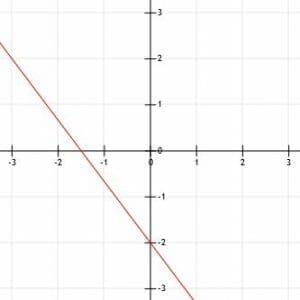
Example 4
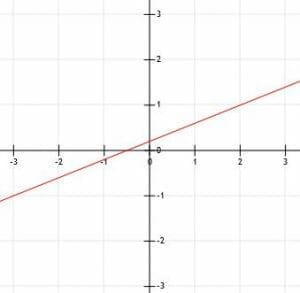
Given that the line k passes through the points (-3, -1) and (2, 1), graph the line k.
Example 4 Solution
Remember that two points uniquely define a line. While all the previous examples have provided us with one point and required us to find a second using slope, we are already given two points here.
We can actually just graph this line by drawing a line through the two points given and putting arrows on the end, as shown.
Example 5
The line l has the standard form linear equation x-3y=9. The line k is perpendicular to l and intersects the line k at (3, -2). Graph the two lines.
Example 5 Solution
First, let’s graph l.
Since l is in standard form, its y-intercept is C/B. This means that, in this case, the y-intercept of l is 9/-3=-3. Therefore, l goes through the point (0, -3), which lies on the y-axis three units below the x-axis.
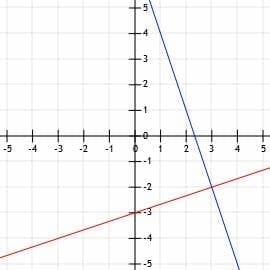
But, since k intersects l at the point (3, -2), l must pass through this point. Therefore, we plot (0, -3) and (3, -2) and then draw a line through the two points. Adding arrows on the end completes the line l.
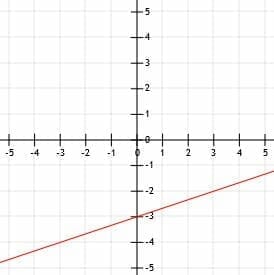
Now, we already have one point for k, (3, -2), the intersection point. Since k is perpendicular to l, we can find its slope by finding the slope of l and then finding its negative reciprocal.
Again, the slope of a line written in standard form is -A/B. In this case, therefore, the slope of l is -1/-3=1/3. The opposite reciprocal of this is -3. Therefore, k has slope -3.
Now, to find a second point of k, we can either find a point that is “down 3 over 1 (to the right)” or “up 3 over 1 to the left.” We will use the second strategy, as we did in example 3, to save graph space.
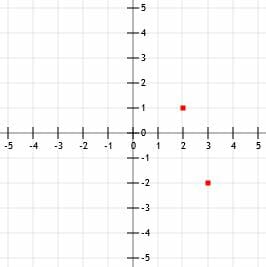
Going up three units gives us (3, 1). Going left one unit gives us (2, 1). Now, if we draw a line passing through these two points and add arrows to the end, we have the graph of k as well.
Practice Problems
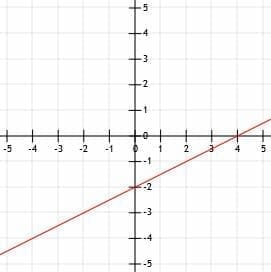
- Graph the line y=1/2x-2.
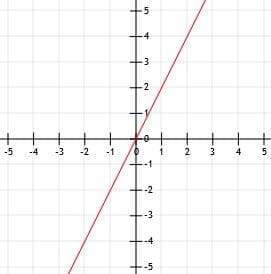
- Graph the line with slope 2 that goes through the point (1, 2).
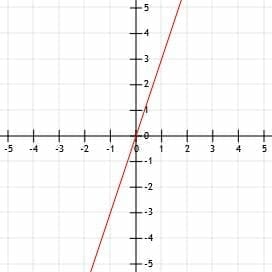
- Graph the line through the points (1, 3) and (-1, -3).
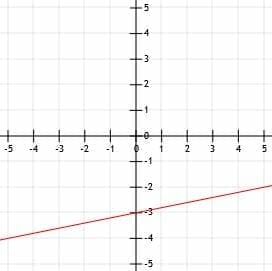
- Graph the line x-5y=15.
- The line l is y=3/4x and the line k is parallel to l. If k passes through the point (-2, -3), graph l and k.

