JUMP TO TOPIC
The Quartiles – Explanation & Examples
 The definition of quartiles is:
“The quartiles are values that divide your numerical data into four parts or quarters.”
In this topic, we will discuss the quartiles from the following aspects:
- What are the quartiles in statistics?
- How to find quartiles?
- The role of quartiles.
- Practical questions.
- Answers.
What are the quartiles in statistics?
The quartiles are values that divide your numerical data into four parts or quarters. The four parts may or may not be of equal size.
The three main quartiles are:
- The first or the lower quartile (denoted as Q1) is the value where 25% of the data points are less than that value.
- The second quartile or the median (denoted as Q2) is the value where 50% of the data points lie below this value.
- The third or the upper quartile (denoted as Q3) is the value where 75% of the data points are less than that value.
These quartiles divide the data into 4 quarters:
- The first quarter contains the data points from the smallest value (minimum) up to Q1.
- The second quarter includes data points from Q1 to the median.
- The third quarter includes data points from the median to Q3.
- The fourth quarter includes data points from Q3 to the highest data point or maximum.
How to find quartiles?
The method will differ according to the presence of an odd or even list of numbers.
– Example 1 of an odd list
For the numbers (1,2,3,4,5), find Q1,Q2,Q3.
1. Order the data from smallest to largest.
Our data is already in order, 1,2,3,4,5.
2. Find the median or Q2.
The median is the central value of the odd list of ordered numbers.
1,2,3,4,5.
The median or Q2 is 3 because there are 2 numbers below 3 (1,2) and two numbers above 3 (4,5).
If we have an even list of ordered numbers, the median value is the sum of the middle pair divided by two.
3. Find the first and third quartiles.
For an odd list of ordered numbers, the first quartile or Q1 is the median of the first half of data points including the median.
The third quartile or Q3 is the median of the second half of data points including the median.
The first half of the data including the median is 1,2,3.
The first quartile is 2 because 2 has 1 number before it (1) and 1 number after it (3).
The second half of the data including the median is 3,4,5.
The third quartile is 4 because 4 has 1 number before it (3) and 1 number after it (5).
We can plot this data as a box plot with the box showing 3 quartiles.
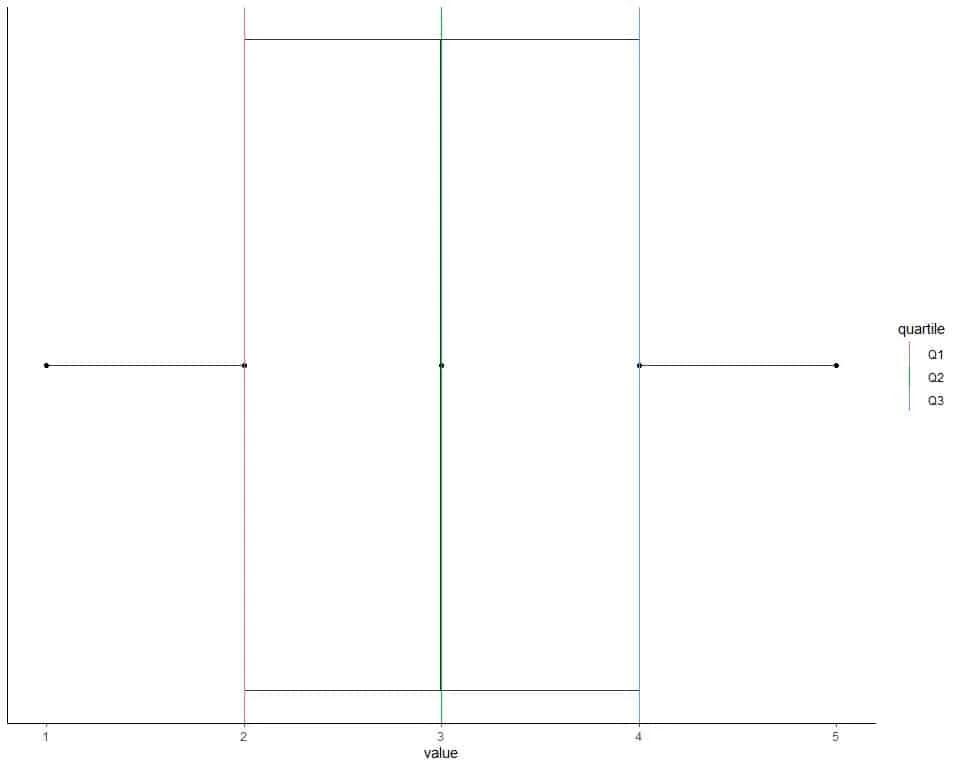
The data points are shown as black solid dots.
The first quartile is shown as a red line, the second quartile as a green line, and the third quartile as a blue line.
– Example 2 of an odd list
The following are 153 daily temperature measurements in New York, May to September 1973.
67 72 74 62 56 66 65 59 61 69 74 69 66 68 58 64 66 57 68 62 59 73 61 61 57 58 57 67 81 79 76 78 74 67 84 85 79 82 87 90 87 93 92 82 80 79 77 72 65 73 76 77 76 76 76 75 78 73 80 77 83 84 85 81 84 83 83 88 92 92 89 82 73 81 91 80 81 82 84 87 85 74 81 82 86 85 82 86 88 86 83 81 81 81 82 86 85 87 89 90 90 92 86 86 82 80 79 77 79 76 78 78 77 72 75 79 81 86 88 97 94 96 94 91 92 93 93 87 84 80 78 75 73 81 76 77 71 71 78 67 76 68 82 64 71 81 69 63 70 77 75 76 68.
find Q1, Q2, Q3.
1. Order the data from smallest to largest.
56 57 57 57 58 58 59 59 61 61 61 62 62 63 64 64 65 65 66 66 66 67 67 67 67 68 68 68 68 69 69 69 70 71 71 71 72 72 72 73 73 73 73 73 74 74 74 74 75 75 75 75 76 76 76 76 76 76 76 76 76 77 77 77 77 77 77 77 78 78 78 78 78 78 79 79 79 79 79 79 80 80 80 80 80 81 81 81 81 81 81 81 81 81 81 81 82 82 82 82 82 82 82 82 82 83 83 83 83 84 84 84 84 84 85 85 85 85 85 86 86 86 86 86 86 86 87 87 87 87 87 88 88 88 89 89 90 90 90 91 91 92 92 92 92 92 93 93 93 94 94 96 97.
2. Find the median or Q2.
The median is the central value of the odd list of ordered numbers.
56 57 57 57 58 58 59 59 61 61 61 62 62 63 64 64 65 65 66 66 66 67 67 67 67 68 68 68 68 69 69 69 70 71 71 71 72 72 72 73 73 73 73 73 74 74 74 74 75 75 75 75 76 76 76 76 76 76 76 76 76 77 77 77 77 77 77 77 78 78 78 78 78 78 79 79 79 79 79 79 80 80 80 80 80 81 81 81 81 81 81 81 81 81 81 81 82 82 82 82 82 82 82 82 82 83 83 83 83 84 84 84 84 84 85 85 85 85 85 86 86 86 86 86 86 86 87 87 87 87 87 88 88 88 89 89 90 90 90 91 91 92 92 92 92 92 93 93 93 94 94 96 97.
The median or Q2 is 79 because there are 76 numbers below 79 (56,57,……79) and 76 numbers above 79 (79,79,79,…..97).
3. Find the first and third quartiles.
For an odd list of ordered numbers, the first quartile or Q1 is the median of the first half of data points including the median.
The third quartile or Q3 is the median of the second half of data points including the median.
The first half of data including the median is:
56 57 57 57 58 58 59 59 61 61 61 62 62 63 64 64 65 65 66 66 66 67 67 67 67 68 68 68 68 69 69 69 70 71 71 71 72 72 72 73 73 73 73 73 74 74 74 74 75 75 75 75 76 76 76 76 76 76 76 76 76 77 77 77 77 77 77 77 78 78 78 78 78 78 79 79 79.
The first quartile is 72 because 72 has 38 numbers before it (56,57,….72) and 38 numbers after it (73,73,….79).
The second half of data including the median is:
79 79 79 79 80 80 80 80 80 81 81 81 81 81 81 81 81 81 81 81 82 82 82 82 82 82 82 82 82 83 83 83 83 84 84 84 84 84 85 85 85 85 85 86 86 86 86 86 86 86 87 87 87 87 87 88 88 88 89 89 90 90 90 91 91 92 92 92 92 92 93 93 93 94 94 96 97.
The third quartile is 85 because 85 has 38 numbers before it (79,79,…84) and 38 numbers after it (85,85,….97).
We can plot this data as a box plot with the box showing 3 quartiles.
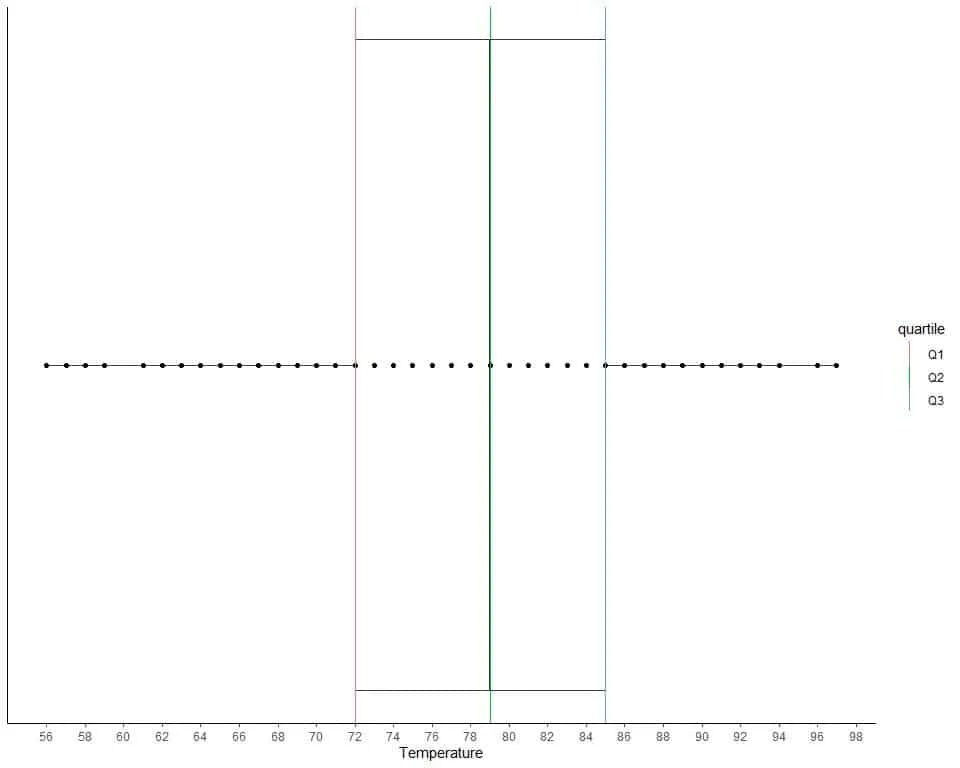
The data points are shown as black solid dots.
The first quartile is shown as a red line, the second quartile as a green line, and the third quartile as a blue line.
– Example 3 of an even list
For the numbers (1,2,3,4,5,6), find Q1,Q2,Q3.
1. Order the data from smallest to largest.
Our data is already in order, 1,2,3,4,5,6.
2. Find the median or Q2.
If we have an even list of ordered numbers, the median value is the sum of the middle pair divided by two.
1,2,3,4,5,6.
The middle pair is (3,4) because it has 2 numbers below it (1,2) and 2 numbers above it (5,6).
The median or Q2 = (3+4)/2 = 3.5.
3. Find the first and third quartiles.
For an even list of ordered numbers, the first quartile is the median of the first half of data points and the third quartile is the median of the second half of data points.
The first half of the data is 1,2,3.
The first quartile is 2 because 2 has 1 number before it (1) and 1 number after it (3).
The second half of the data is 4,5,6.
The third quartile is 5 because 5 has 1 number before it (4) and 1 number after it (6).
We can plot this data as a box plot with the box showing 3 quartiles.
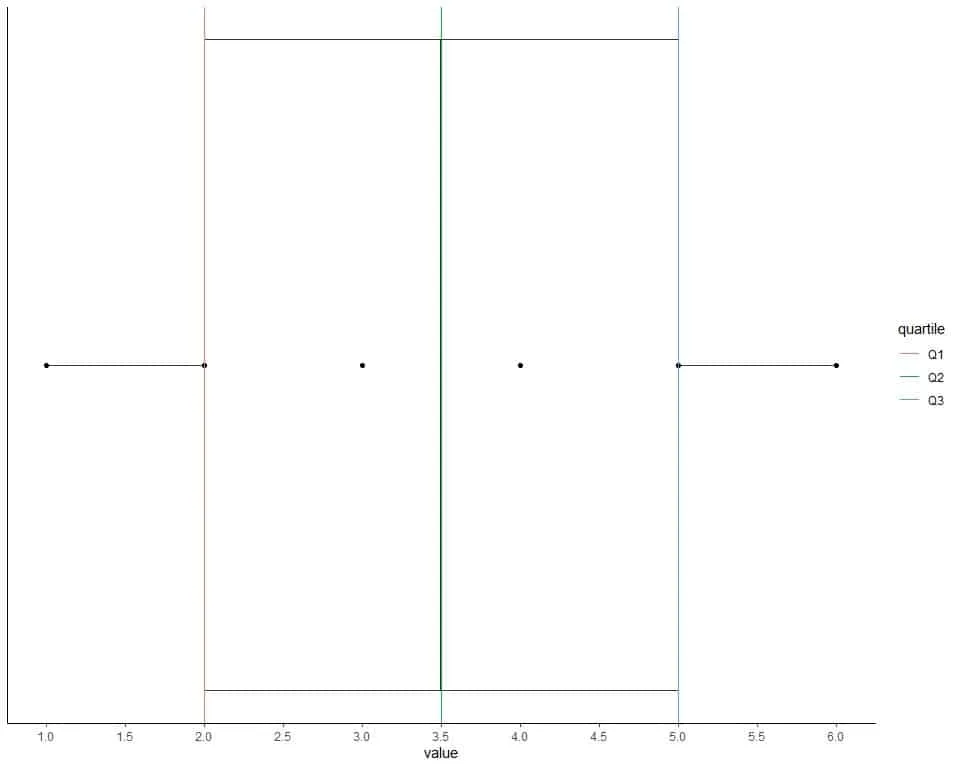 The data points are shown as black solid dots.
The first quartile is shown as a red line, the second quartile as a green line, and the third quartile as a blue line.
– Example 4 of an even list
The following are 84 daily ozone measurements in New York, May to September 1973.
41 36 12 18 28 23 19 8 7 16 11 14 18 14 34 6 30 11 1 11 4 32 23 45 115 37 29 71 39 23 21 37 20 12 13 135 49 32 64 40 77 97 97 85 10 27 7 48 35 61 79 63 16 80 108 20 52 82 50 64 59 39 9 16 78 35 66 122 89 110 44 28 65 22 59 23 31 44 21 9 45 168 73 76.
Find Q1, Q2, Q3.
1. Order the data from smallest to largest.
1 4 6 7 7 8 9 9 10 11 11 11 12 12 13 14 14 16 16 16 18 18 19 20 20 21 21 22 23 23 23 23 27 28 28 29 30 31 32 32 34 35 35 36 37 37 39 39 40 41 44 44 45 45 48 49 50 52 59 59 61 63 64 64 65 66 71 73 76 77 78 79 80 82 85 89 97 97 108 110 115 122 135 168.
2. Find the median or Q2.
If we have an even list of ordered numbers, the median value is the sum of the middle pair divided by two.
1 4 6 7 7 8 9 9 10 11 11 11 12 12 13 14 14 16 16 16 18 18 19 20 20 21 21 22 23 23 23 23 27 28 28 29 30 31 32 32 34 35 35 36 37 37 39 39 40 41 44 44 45 45 48 49 50 52 59 59 61 63 64 64 65 66 71 73 76 77 78 79 80 82 85 89 97 97 108 110 115 122 135 168.
The middle pair is (35,35) because it has 41 numbers below it (1,4,..,34) and 41 numbers above it (36,37,…,168).
The median or Q2 = (35+35)/2 = 35.
3. Find the first and third quartiles.
For an even list of ordered numbers, the first quartile is the median of the first half of data points and the third quartile is the median of the second half of data points.
The first half of data is another even list of numbers so we pick the middle pair to find median:
1 4 6 7 7 8 9 9 10 11 11 11 12 12 13 14 14 16 16 16 18 18 19 20 20 21 21 22 23 23 23 23 27 28 28 29 30 31 32 32 34 35.
The middle pair is (18,18) because it has 20 numbers below it (1,4,..,16) and 20 numbers above it (19,20,…,35).
The first quartile or Q1 = (18+18)/2 = 18.
The second half of data is another even list of numbers:
35 36 37 37 39 39 40 41 44 44 45 45 48 49 50 52 59 59 61 63 64 64 65 66 71 73 76 77 78 79 80 82 85 89 97 97 108 110 115 122 135 168.
The middle pair is (64,64) because it has 20 numbers below it (35,35,..,63) and 20 numbers above it (65,66,…,168).
The third quartile or Q3 = (64+64)/2 = 64.
We can plot this data as a box plot with the box showing 3 quartiles.
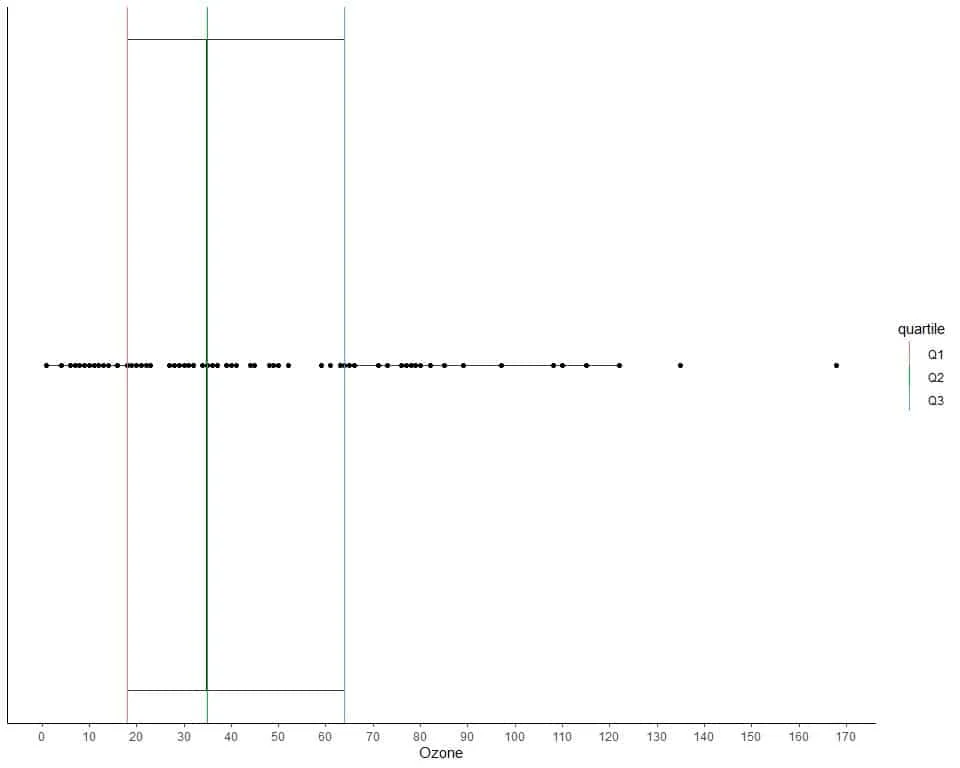
The data points are shown as black solid dots.
The first quartile is shown as a red line, the second quartile as a green line, and the third quartile as a blue line.
The role of quartiles
The second quartile or the median (Q2) provides information about the data center.
The difference between the first and third quartiles (Q3-Q1) is called the interquartile range (IQR) and provides information about the data spread.
If Q2 or median is more close to Q1 than Q3, this means that our data is right-skewed as we see in example 4. In other words, the upper half of the box plot is larger than the lower half.
If Q2 or median is more close to Q3 than Q1, this means that our data is left-skewed as we see in example 2. In other words, the upper half of the box plot is smaller than the lower half.
Practical questions
1. The following are the quartiles of prices for some fair and ideal cut diamonds.
cut | Q1 | Q2 | Q3 |
Fair | 2050.25 | 3282 | 5205.5 |
Ideal | 878.00 | 1810 | 4678.5 |
Which cut is more spread in its prices?
Is the price data right or left-skewed?
2. The following are the quartiles of temperature for some months in New York, May to September 1973.
Month | Q1 | Q2 | Q3 |
5 | 60.0 | 66 | 69.00 |
6 | 76.0 | 78 | 82.75 |
7 | 81.5 | 84 | 86.00 |
8 | 79.0 | 82 | 88.50 |
9 | 71.0 | 76 | 81.00 |
Which month is the least spread in its temperatures?
3. The following is the age in years of 10 participants from a certain survey.
26 48 67 39 25 25 36 44 44 47.
What is Q1, Q2, Q3 of this data?
4. The following is the age in years of 11 participants from a certain survey.
63 54 62 40 33 75 89 56 24 27 71.
What is Q1, Q2, Q3 of this data?
5. The following are the box plots for different TV hours of different races from a certain survey.
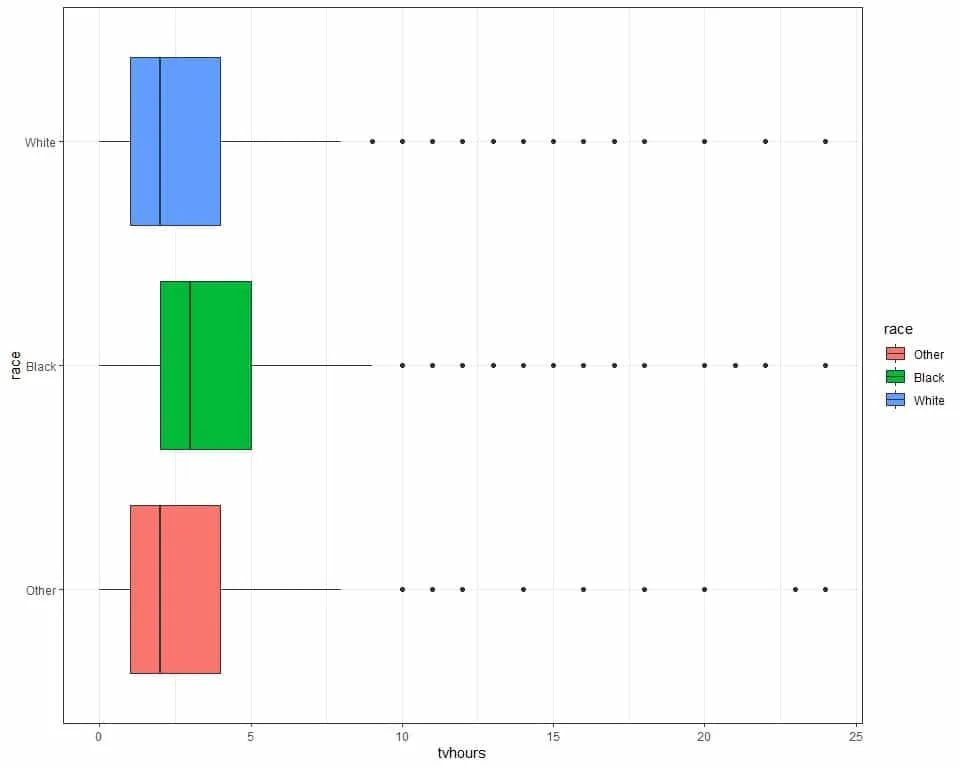 Which race has the highest Q3?
Is the TV hours right or left skewed?
Answers
1. Look at IQR = Q3-Q1 =, for fair cut, 3155.25.
For ideal cut, IQR = 3800.5. The ideal cut has a larger IQR so it is more spread in its prices.
In both cut types, the Q2 or median is more close to Q1 than Q3 which means that price data is right-skewed.
2. For month 5, IQR = 9.
For month 6, IQR = 6.75.
For month 7, IQR = 4.5.
For month 8, IQR =9.5.
For month 9, IQR =10.
The least spread is for month 7 or July.
3. 26 48 67 39 25 25 36 44 44 47 is an even list of numbers.
Following the above steps, Q2 = 41.5, Q1 = 26, Q3 = 47.
4. 63 54 62 40 33 75 89 56 24 27 71 is an odd list of numbers.
Following the above steps, Q2 = 56, Q1 = 36.5, Q3 = 67.
5. The black race has the highest Q3 at about 5 hours.
In all box plots, the Q2 or median is more close to Q1 than Q3 which means that TV hours are right-skewed.