- Home
- >
- Sample Space – Explanation and Examples
JUMP TO TOPIC
Sample Space – Explanation & Examples
 In your study of probability you will come upon the idea of a sample space. A clear understanding of this concept will make your journey more enlightening so let’s begin with its definition:
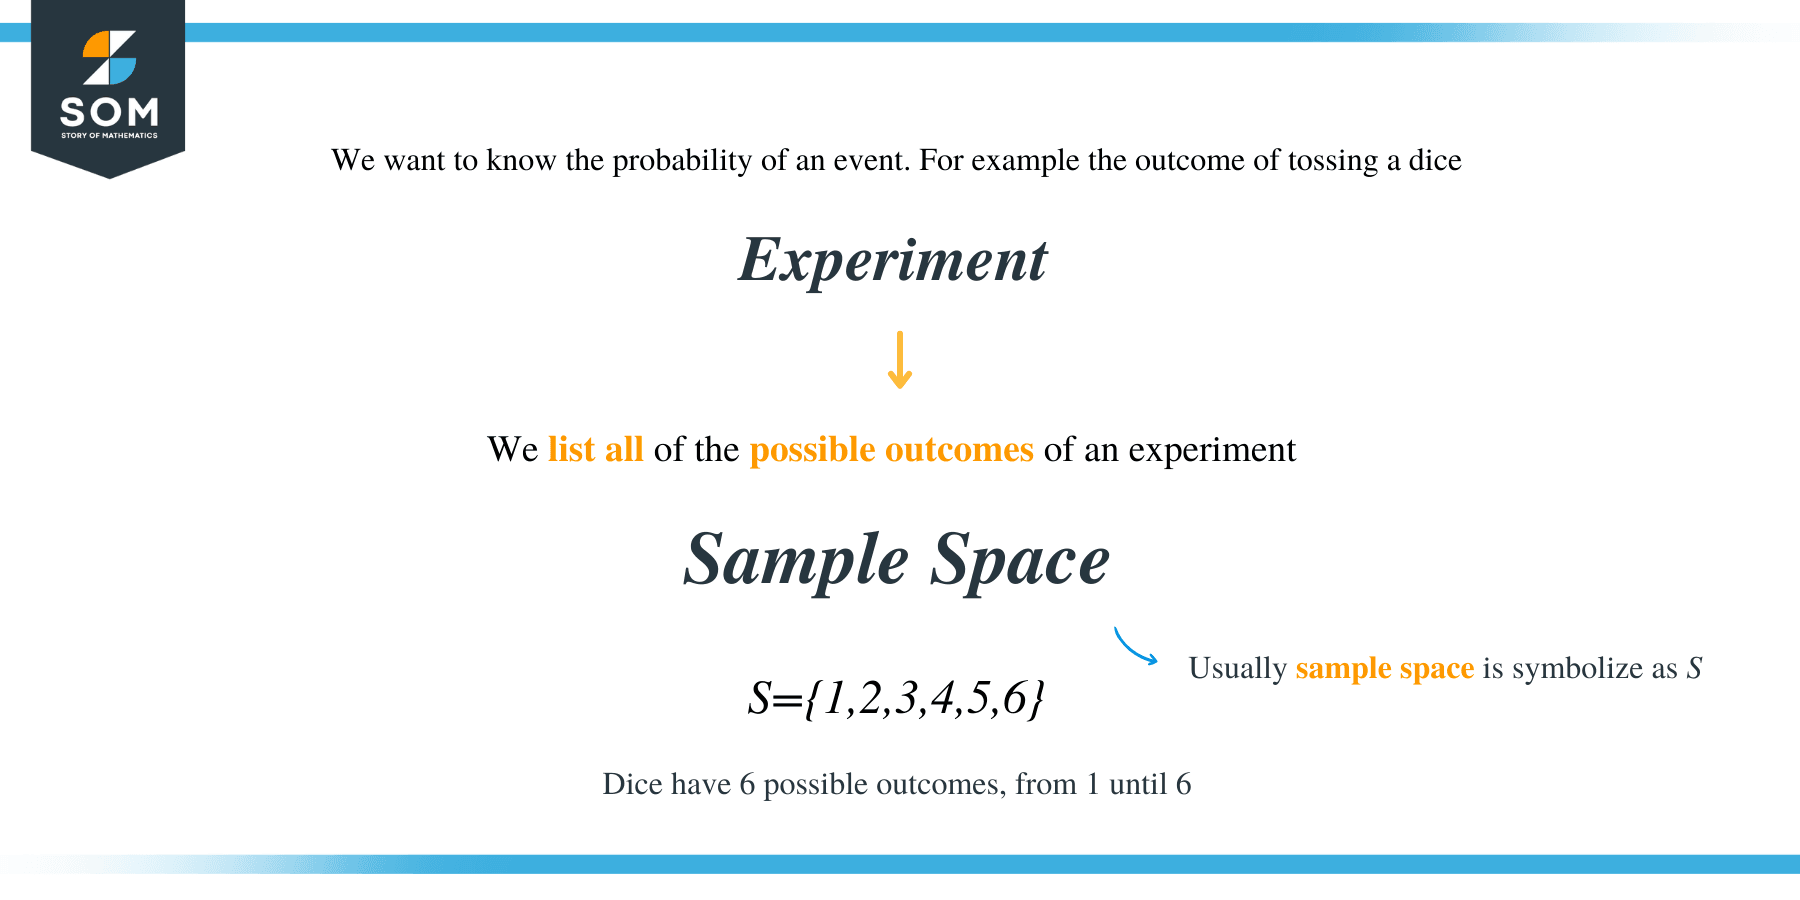
‘Sample space’ is defined as the set containing all the possible outcomes of a random experiment.
In order to help you to understand this concept, this article will explore the answers to the following questions:
- What is a sample space?
- How do we find a sample space?
Let’s get right into it by further explaining what a sample space is.
What is a sample space?
 You may recall that probability is the study of chance. For example, if you toss a die you have a 50-50 chance of getting a head. You can also get a tail. The outcome of a head and the outcome of a tail together make up the sample space of this experiment. Thus, we conclude:
A sample space is the set of all the possible outcomes of an experiment.
We usually name this set S. So, from our previously mentioned experiment we have
S = {H, T}
Notice that since it is a set, the sample space is written using set notation. The following examples state the sample space of the given experiments.
Experiment 1: Choosing from the symbols in a deck of cards
S = {♥, ♦, ♠, ♣}
Alternatively,
S = {Heart, Diamond, Spade, Club}
Experiment 2: Tossing a die
S = {1, 2, 3, 4, 5, 6}
Now that we understand what a sample space is, we need to explore how it is found. You may have gotten an idea from the previous examples so keep reading to learn more useful strategies to find a sample space.
How do we find a sample space?
To determine the sample space of an experiment, we list ALL the possible outcomes of the experiment.
You may have noticed that the sample space is found by listing all the possible outcomes of the experiment. Let’s now look at some cases where the sample space is not as obvious.
Experiment 2: Picking one fruit from a basket with 3 apples, 5 pears, 2 bananas, and 1 orange.
S = {Apple, Pear, Banana, Orange}
Notice that the number of individual fruits did not affect the total number of possible outcomes. This is because this experiment is one where we pick a single fruit from the basket. Here we can pick either an apple, a pear, a banana, or an orange. We cannot pick a fruit the basket does not contain, and we are only picking one fruit.
What if we now wanted to pick two fruits from the basket?
Experiment 3: Picking two fruits (at the same time) from a basket with 3 apples, 5 pears, 2 bananas, and 1 orange
To simplify our sample space, we will use:
A – Apple
P – Pear
B – Banana
O – Orange
S = {(A, A), (A, P), (A, B), (A, O), (P, P), (P, B), (P, O), (B, B), (B, O)}
Observe that we cannot choose (O, O) from the basket since there is only one orange in the basket. Additionally, since we are picking the fruits at the same time (A, P) is the same as (P, A). Thus, the outcome of choosing an apple and a pear occurs just once in the sample space.
Convenient Strategies to Determine a Sample Space
There are strategies that can be used to avoid missing some of the possible outcomes when writing out the sample space. In this section we will look at charts (or tables), and tree diagrams.
Chart
A chart is set up using rows and columns like a table. It is typically used to determine the sample space of an experiment that combines two activities. Observe the example below.
Experiment 4: Simultaneously tossing two dice
Die 1 | |||||||
1 | 2 | 3 | 4 | 5 | 6 | ||
Die 2 | 1 | (1, 1) | (1, 2) | (1, 3) | (1, 4) | (1, 5) | (1, 6) |
2 | (2, 1) | (2, 2) | (2, 3) | (2, 4) | (2, 5) | (2, 6) | |
3 | (3, 1) | (3, 2) | (3, 3) | (3, 4) | (3, 5) | (3, 6) | |
4 | (4, 1) | (4, 2) | (4, 3) | (4, 4) | (4, 5) | (4, 6) | |
5 | (5, 1) | (5, 2) | (5, 3) | (5, 4) | (5, 5) | (5, 6) | |
6 | (6, 1) | (6, 2) | (6, 3) | (6, 4) | (6, 5) | (6, 6) | |
This chart correctly shows the 36 outcomes in this sample space.
Tree Diagram
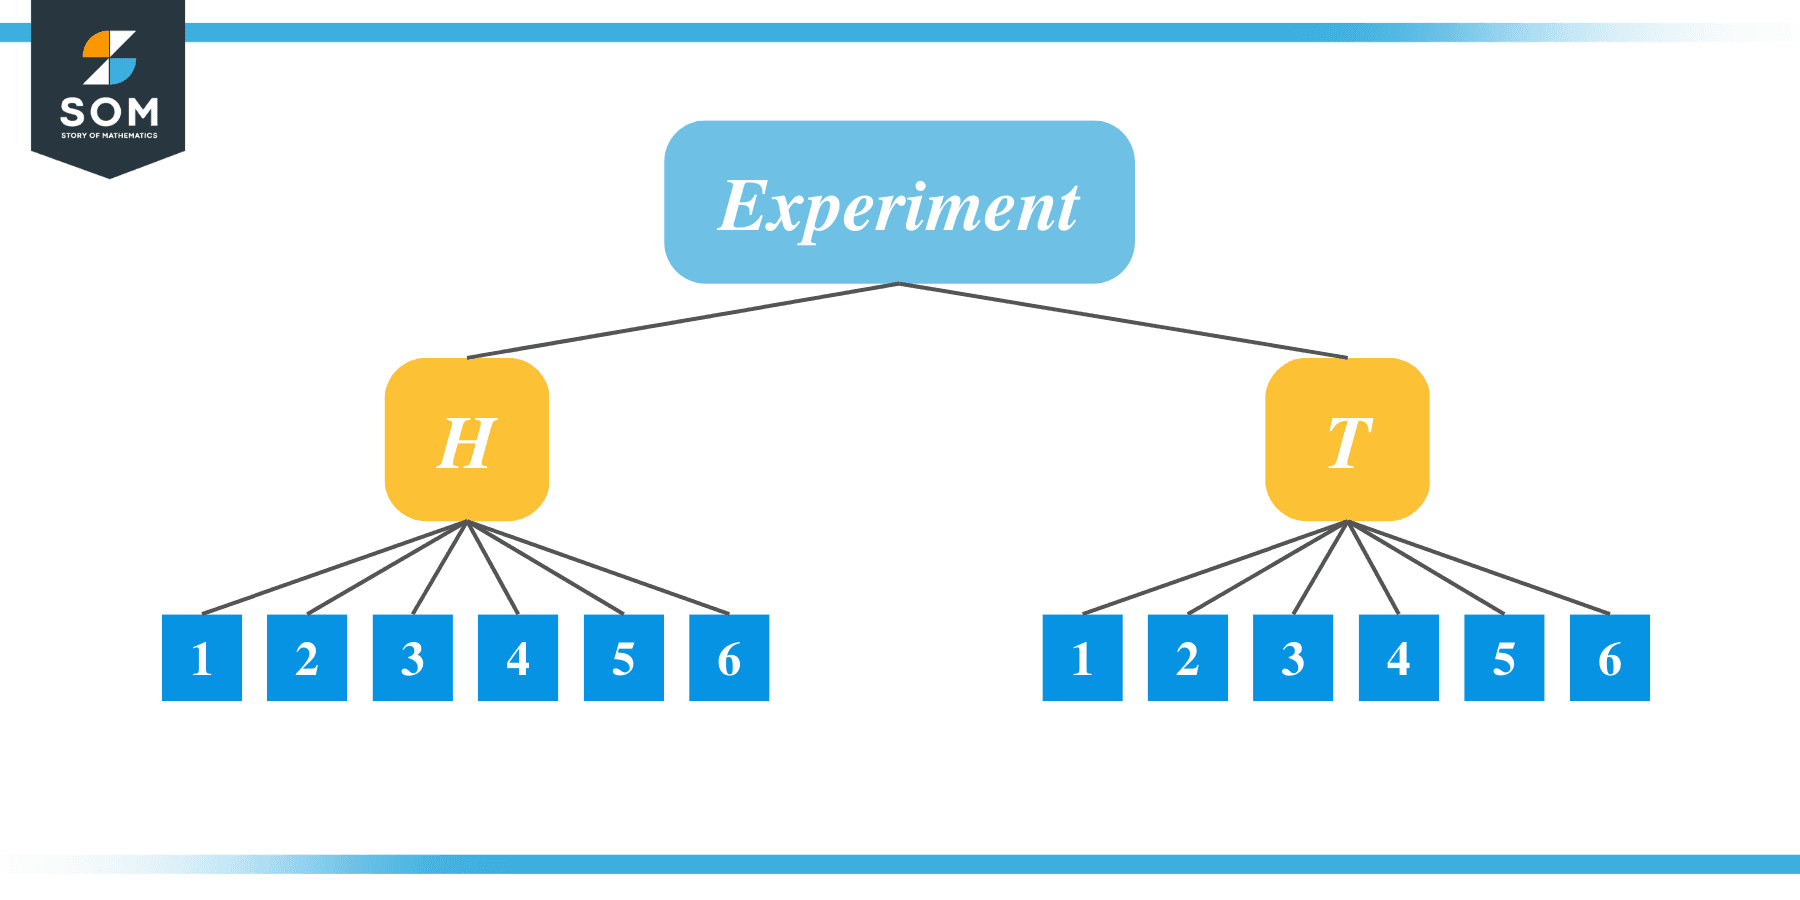
We can also use a tree diagram to find the sample space of an experiment. The branches show combinations of results of separate activities that make up an outcome.
Experiment 5: Flipping a coin and tossing a dice

From this diagram we can read off the 12 possible outcomes in the sample space as:
S = {H1, H2, H3, H4, H5, H6, T1, T2, T3, T4, T5, T6}
Notice that the order here does not matter. We do not count, for example, H1 as a different outcome from 1H.
Determining the Number of Outcomes in a Sample Space (without listing them)
In experiments 14 and 15, we mapped the possible outcomes of the unique activities with each other on a one-to-one basis. As a result, the number of outcomes of the experiment was the product of the number of outcomes of the two activities. This observation is useful when it is not practical to write out all the elements in a sample space.
For example, flipping a coin has 2 items in its sample space. Rolling a die has 6. Thus, the sample space of the experiment from simultaneously flipping a coin and rolling a die consisted of:
2 × 6 = 12 possible outcomes.
When Order Matters
In experiment 3 you saw that when simultaneously picking two fruits from a basket, picking an apple and then a pear was the same as picking a pear and then an apple.
What if we did not pick the fruits simultaneously and the order in which we picked them mattered? In such a case we would have to count both (A, P) and (P, A) as separate outcomes. The number of options with different fruits would now be doubled and our new sample space would become:
S = {(A, A), (A, P), (P, A), (A, B), (B, A), (A, O), (O, A), (P, P), (P, B), (B, P), (P, O), (O, P), (B, B), (B, O), (O, B)}
There are 15 outcomes in this sample space. It includes twice the number of outcomes with different fruits as the original experiment, plus the three outcomes with the same two fruits.
You can learn more about this in our articles on permutations and combinations.
Practice Questions
![]()
Open Problems
Write out the sample space for each of the following experiments.
- Choosing a laptop from a store with 5 different brands (B1, B2, B3, B4, B5) running 3 different operating systems (OS1, OS2, OS3).
- Choosing a combination of blue or black jeans with either a yellow, green, or white top, and a plaid or striped tie.
Open Problems Solutions
- Choosing a laptop from a store with 5 different brands (B1, B2, B3, B4, B5) running 3 different operating systems (OS1, OS2, OS3).
For this solution, you can use a tree diagram or a chart to match each brand with an operating system to get the following sample space containing 15 outcomes:
S = {B1-OS1, B1-OS2, B1-OS3, B2-OS1, B2-OS2, B2-OS3, B3-OS1, B3-OS2, B3-OS3, B4-OS1, B4-OS2, B4-OS3, B5-OS1, B5-OS2, B5-OS3}
- Choosing a combination of blue or black jeans with either a yellow, green, or white top and a plaid or striped tie.
For this solution you can use a tree diagram to match the jeans with the top and then match those combinations with the ties to get this sample space containing 12 outcomes:
S = {Blue-Yellow-Plaid, Blue-Green-Plaid, Blue-White-Plaid, Blue-Yellow-Stripe, Blue-Green-Stripe, Blue-White-Stripe, Black-Yellow-Plaid, Black-Green-Plaid, Black-White-Plaid, Black-Yellow-Stripe, Black-Green-Stripe, Black-White-Stripe}
