Solving Systems of Linear Inequalities – Technique & Examples
 Before solving systems of linear inequalities, let’s look at what inequality means. The word inequality means a mathematical expression in which the sides are not equal to each other.
Basically, there are five inequality symbols used to represent equations of inequality.
These are less than (<), greater than (>), less than or equal (≤), greater than or equal (≥), and the not equal symbol (≠). Inequalities are used to compare numbers and determine the range or ranges of values that satisfy the conditions of a given variable.
What is a System of Linear Inequalities?
A system of linear inequalities is a set of equations of linear inequalities containing the same variables.
Several methods of solving systems of linear equations translate to the system of linear inequalities. However, solving a system of linear inequalities is somewhat different from linear equations because the inequality signs hinder us from solving by substitution or elimination method. Perhaps the best method to solve systems of linear inequalities is by graphing the inequalities.
How to Solve Systems of Linear Inequalities?
Previously, you learned how to solve a single linear inequality by graphing. In this article, we will learn how to find solutions for a system of linear inequalities by graphing two or more linear inequalities simultaneously.
The solution to a system of linear inequality is the region where the graphs of all linear inequalities in the system overlap.
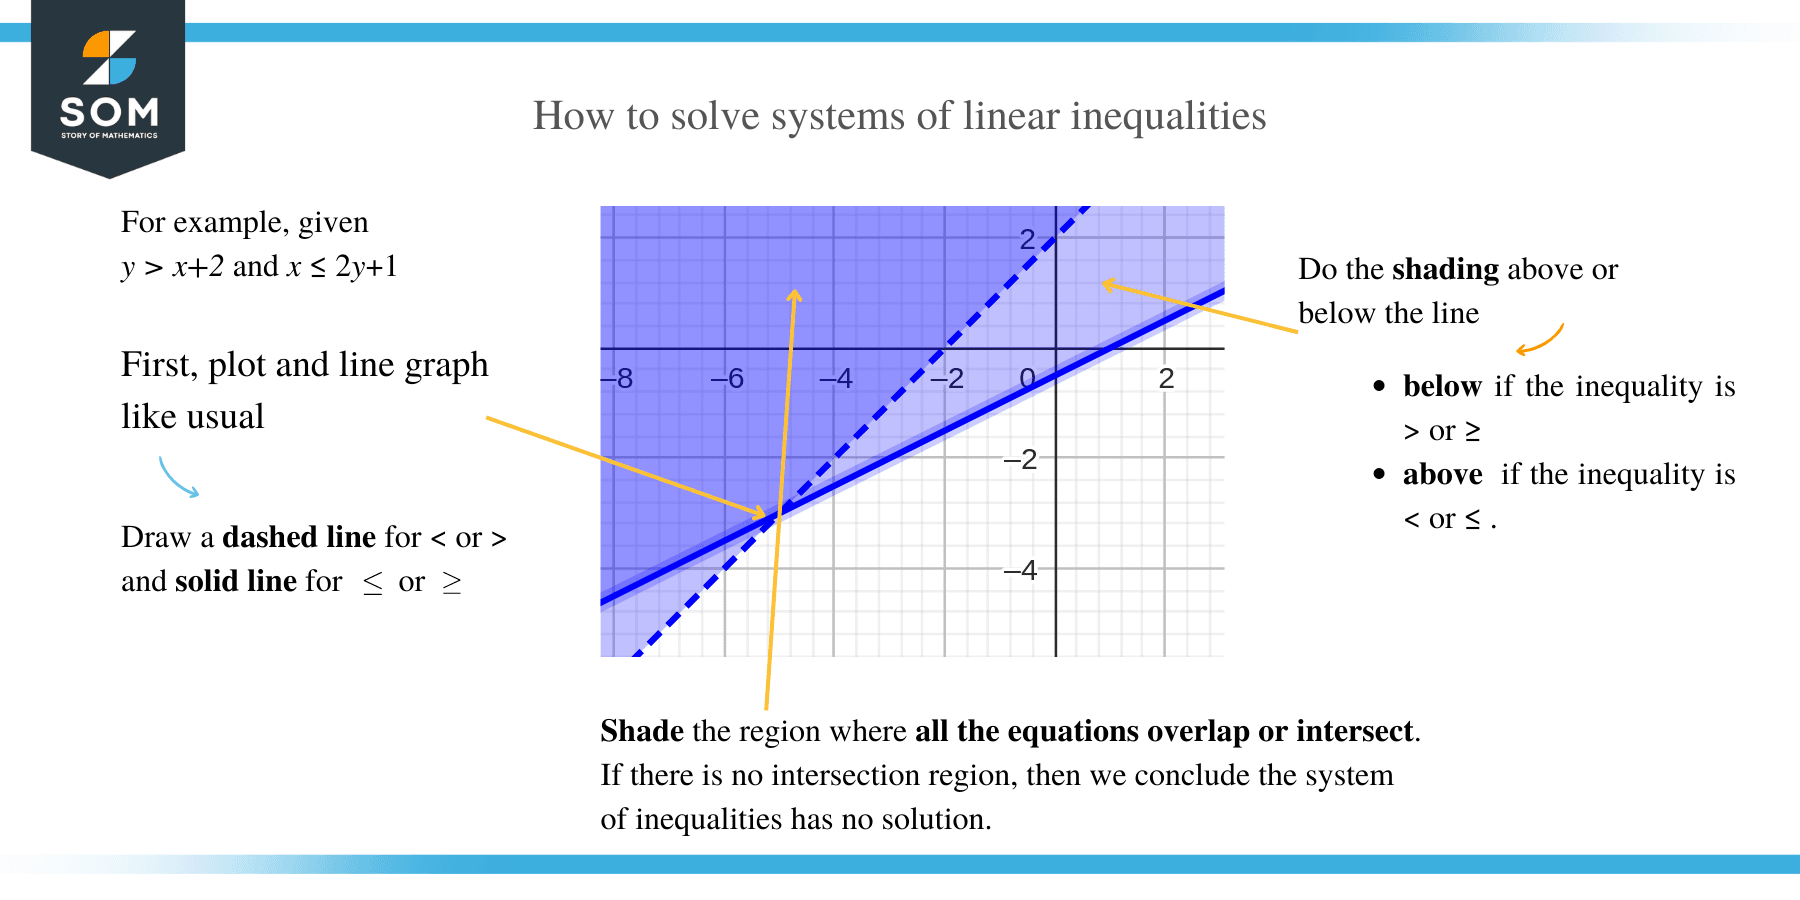
To solve a system of inequalities, graph each linear inequality in the system on the same x-y axis by following the steps below:
- Isolate the variable y in each linear inequality.
- Draw and shade the area above the borderline using dashed and solid lines for the symbols > and ≥ respectively.
- Similarly, draw and shade the area below the borderline using dashed and solid lines for the symbols < and ≤ respectively.
- Shade the region where all the equations overlap or intersect. If there is no intersection region, then we conclude the system of inequalities has no solution.
 Let’s go over a couple of examples to understand these steps.
Example 1
Graph the following system of linear inequalities:
y ≤ x – 1 and y < –2x + 1
Solution
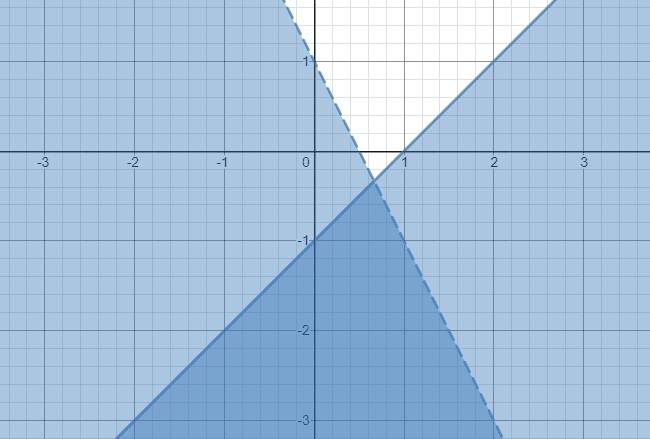
Graph the first inequality y ≤ x − 1.
- Because of the “less than or equal to” symbol, we will draw a solid border and do the shading below the line.
- Also, graph the second inequality y < –2x + 1 on the same x-y axis.
- In this case, our borderline will be dashed or dotted because of the less than symbol. Shade the area below the borderline.
Therefore, the solution to this system of inequalities is the darker shaded region extending forever in a downward direction, as shown below.
Example 2
Solve the following system of inequalities:
x – 5y ≥ 6
3x + 2y > 1
Solution
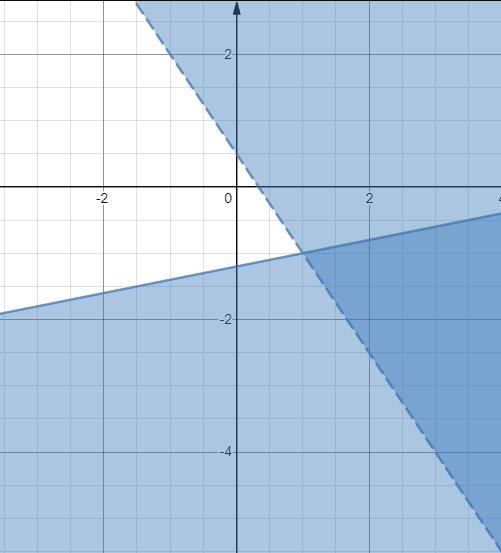
- First, isolate the variable y to the left in each inequality.
For x – 5y ≥ 6;
=> x ≥ 6 + 5y
=> 5y ≤ x – 6
=> y ≤ 0.2x – 1.2
And for 3x + 2y > 1;
=> 2y > 1 – 3x
=> y > 0.5 – 1.5x
- We’ll graph y ≤ 2x– 1.2 and y > 0.5 – 1.5x using a solid line and a broken, respectively.
The solution of the system of inequality is the darker shaded area which is the overlap of the two individual solution regions.
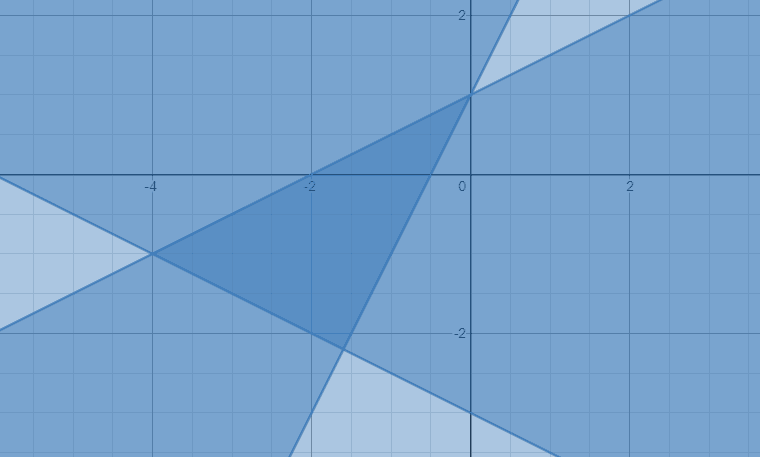
Example 3
Graph the following system of linear inequalities.
y ≤ (1/2) x + 1,
y ≥ 2x – 2,
y ≥ -(1/2) x – 3.
Solution
This system of inequalities has three equations that are all connected by an “equal to” symbol. This tells us that all the borderlines will be solid. The graph of the three inequalities is shown below.
The shaded region of the three equations overlaps right in the middle section. Therefore, the solutions of the system lie within the bounded region, as shown on the graph.
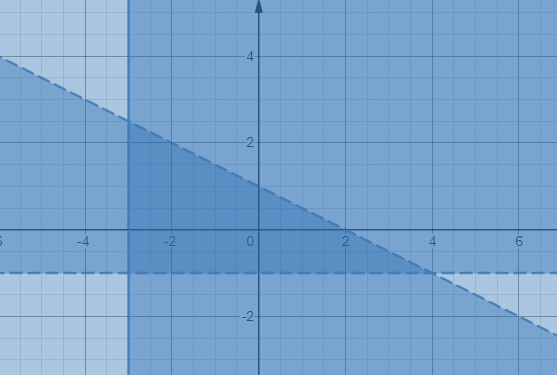
Example 4
Graph the following system of linear inequalities:
x + 2y < 2, y > –1,
x ≥ –3.
Solution
Isolate the variable y in the first inequality to get;
y < – x/2 +1 You should note that the inequality y > –1 and x ≥ –3 will have horizontal and vertical boundary lines, respectively. Let’s graph the three inequalities as illustrated below.
The darker shaded region enclosed by two dotted line segments and one solid line segment give the three inequalities.
Example 5
Solve the following system of linear inequalities:
–2x -y < -1
4x + 2y ≤-6
Solution
Isolate the variable y in each inequality.
–2x -y < -1 => y > –2x + 1
4x + 2y ≤ -6 => y ≤ -2x -3
Let’s go ahead and graph y > –2x + 1 and y ≤ -2x -3:
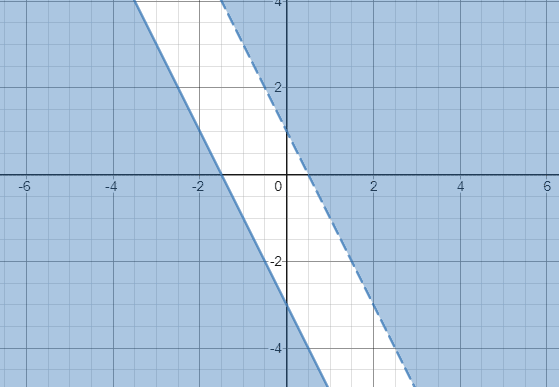
Since the shaded areas of two inequalities don’t overlap, we can therefore conclude that the system of inequalities has no solution.