Tree Diagram: Explanation & Examples
 A tree diagram represents the hierarchy of the events that need to be completed when solving a problem. The tree diagram starts with one node, and each node has its branches that further extend into more branches, and a tree-like structure is formed.
It might be a good idea to refresh the following topics to help understand this article better.
- Basic probability theory.
- Coin flip probabilities.
- Dice Probabilities.
- Probability with replacement.
- Probability without replacement.
- Bernoulli trials.
After reading this article, you should understand the following concepts:
- What a tree diagram is.
- How to make a tree diagram.
- How to solve coin flip problems using tree diagrams.
- How to find dice probabilities using tree diagrams.
- How to use tree diagrams to represent Bernoulli trials.
What is a tree diagram?
In mathematics, tree diagrams make it easy to visualize and solve probability problems. They are a significant tool in breaking the problem down in a schematic way. While tree diagrams can convert many complicated problems into simple ones, they are not very useful when the sample space becomes too large.
Tree diagram definition:
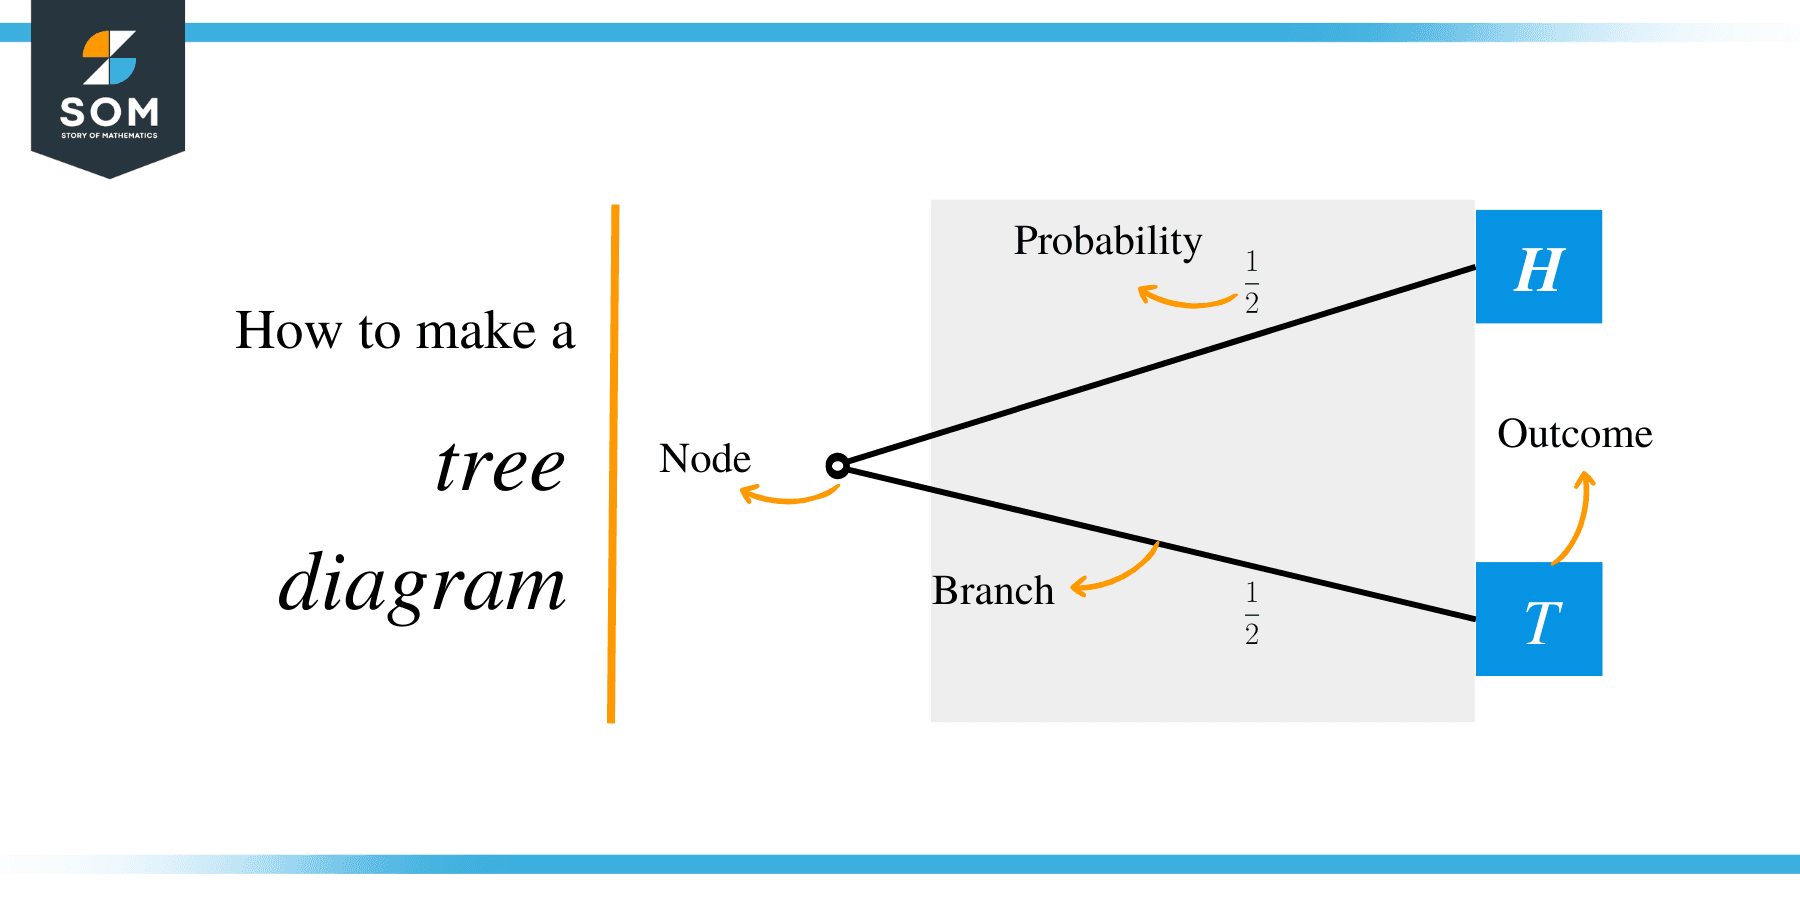
A probability tree diagram represents all the possible outcomes of an event in an organized manner. It starts with a dot and extends into branches. The probability of each outcome is written on its branch.
How to make a tree diagram
Let’s consider an example and draw a tree diagram for a single coin flip. We know that a coin flip has one of the two possible outcomes: heads ($H$) and tails ($T$). Each outcome has a probability of $1/2$. So we can represent this in a tree diagram as
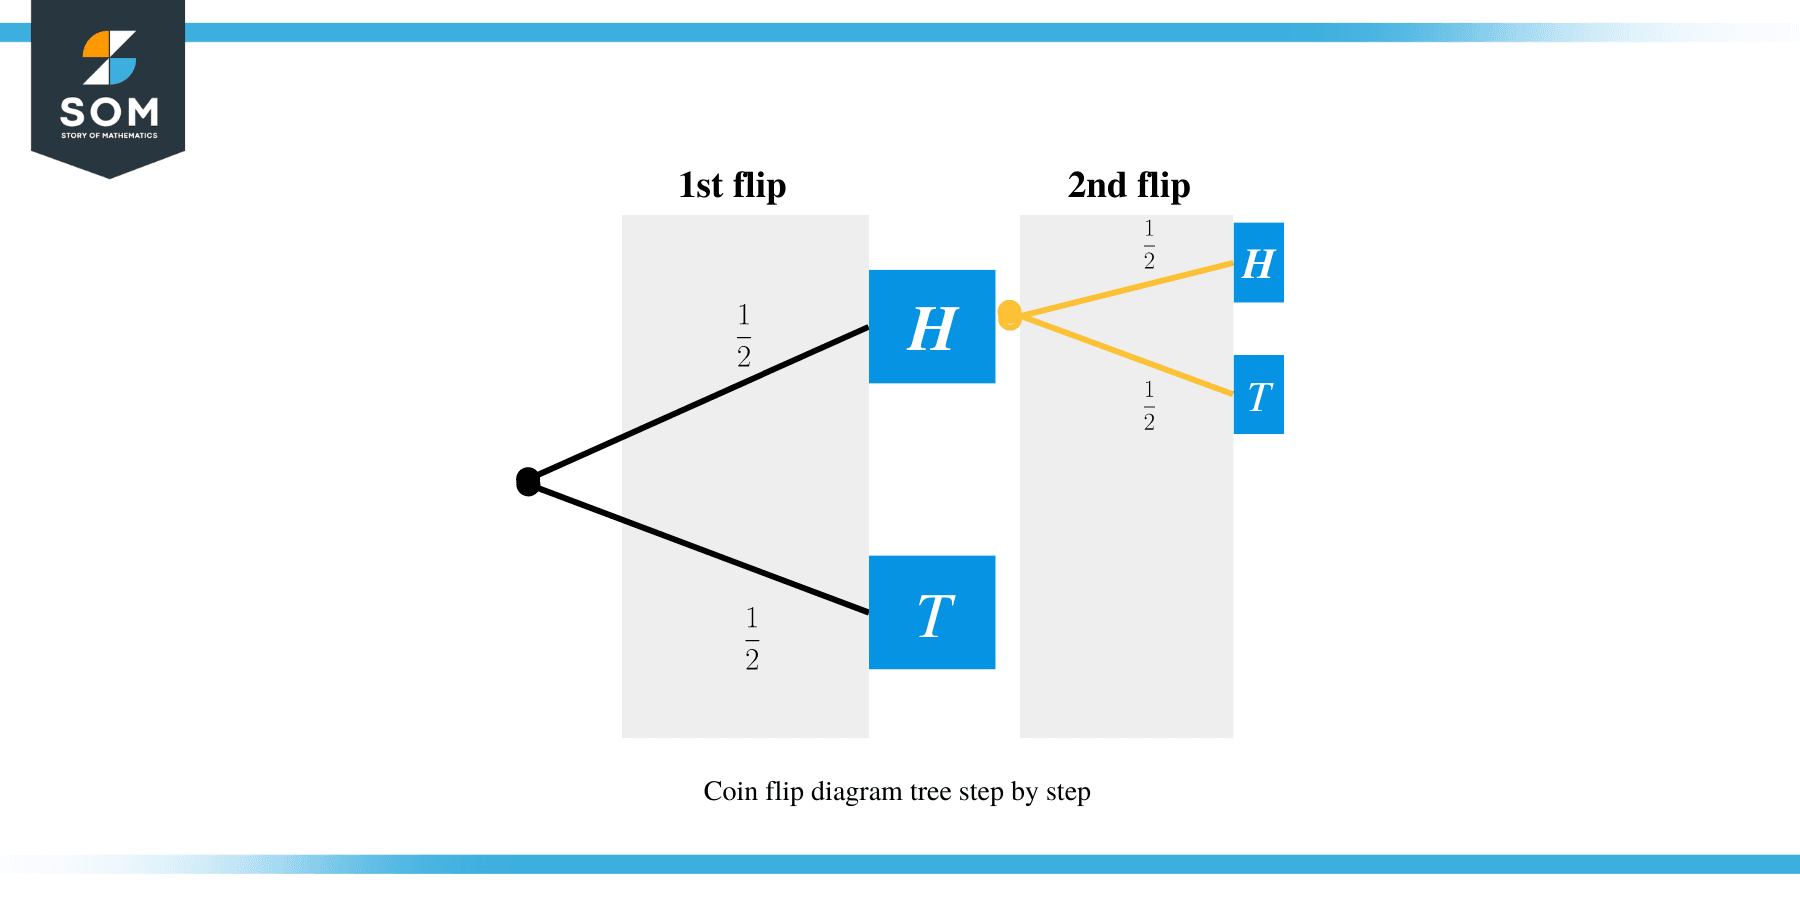
Now let’s assume that we flip the same coin one more time. Suppose the outcome of the first flip is head, the outcome of the second event can be either heads or tails, and the corresponding branches are shown in red in the diagram below.
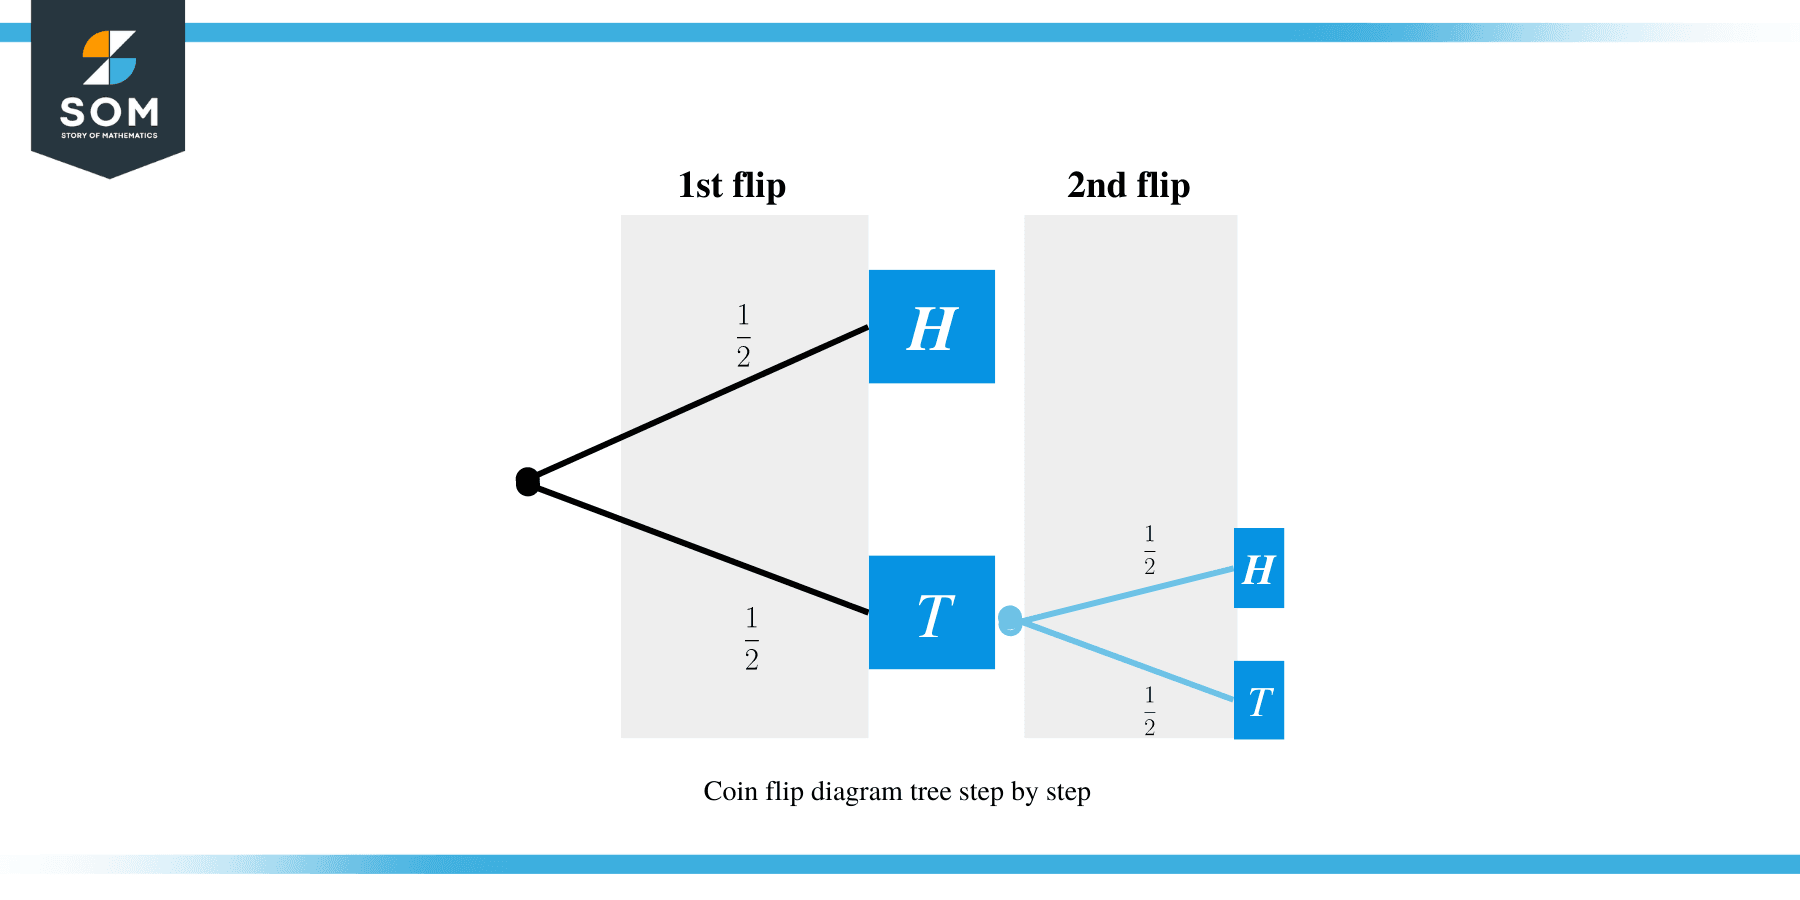
Similarly, if we assume that the outcome of the first event is tails, then the possible outcomes of the second flip are depicted in blue in the tree diagram below:
Finally, we can make a complete tree diagram of the two coin flips, as shown below.
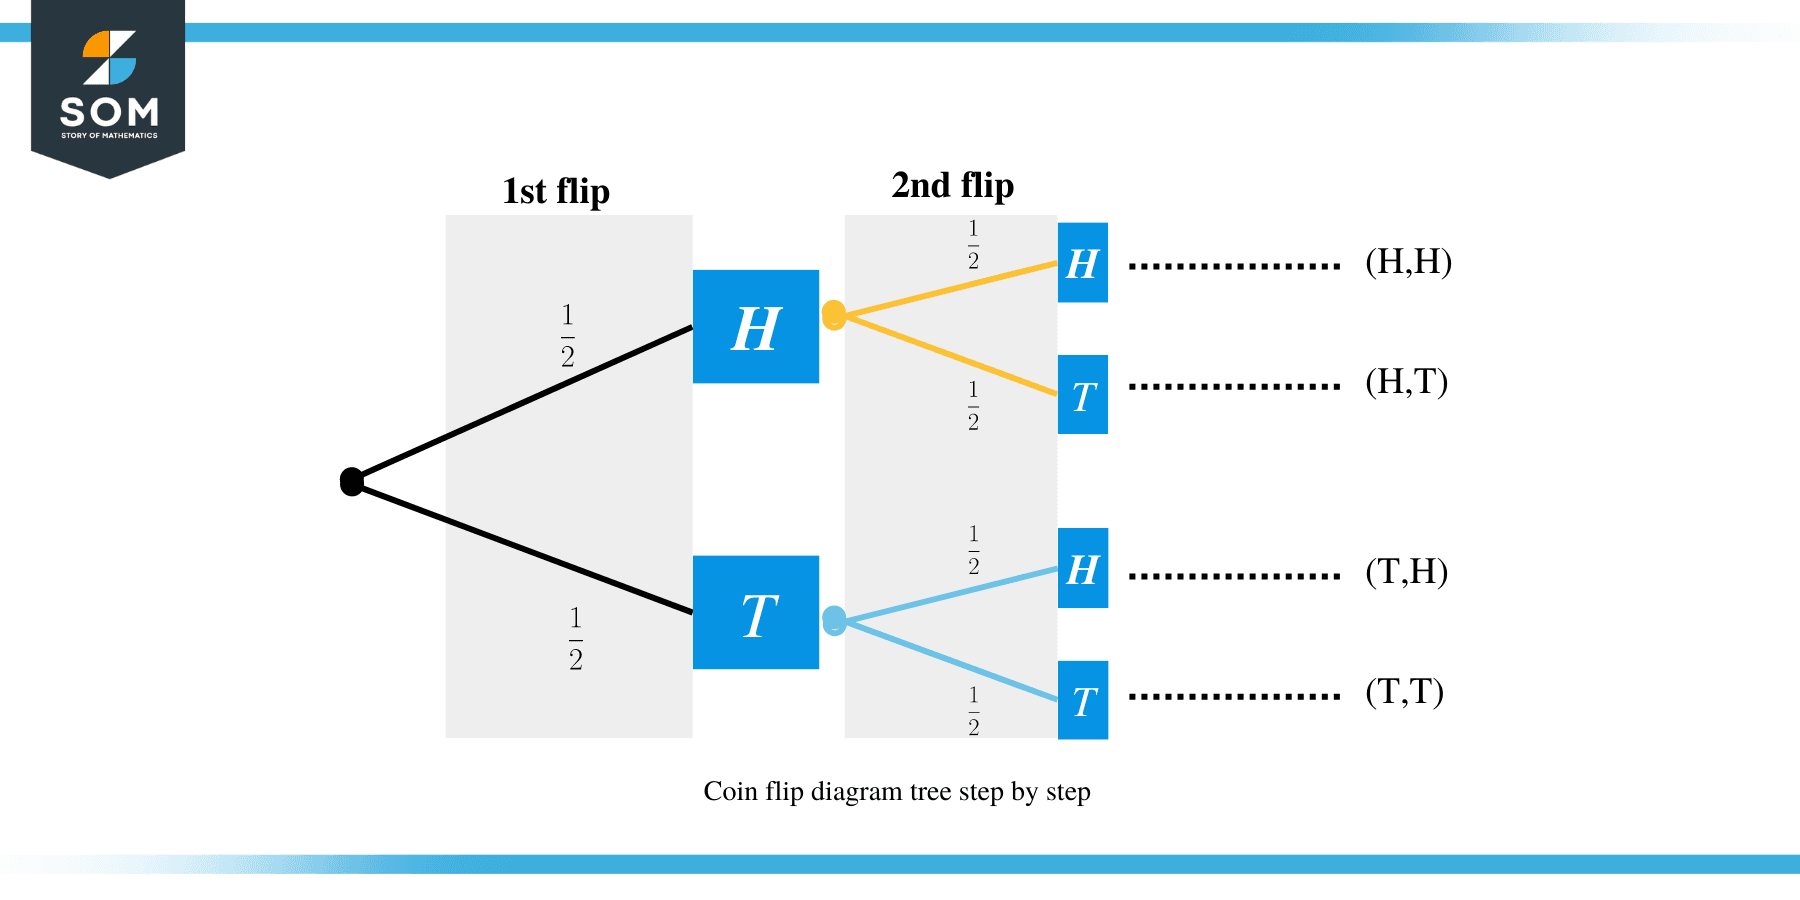
Note that two possible outcomes of two coin flips are depicted as $\{HH, HT, TH, TT\}$. To calculate the probability of any single event, we need to multiply the probabilities along the branches. If we need to evaluate the probability of multiple events or a compound event, such as $\{HH, TT\}$, then we add the final probabilities of the individual events down the column. Let us consider an example to clarify these ideas.
Coin flip probability using tree diagram:
Example 1:
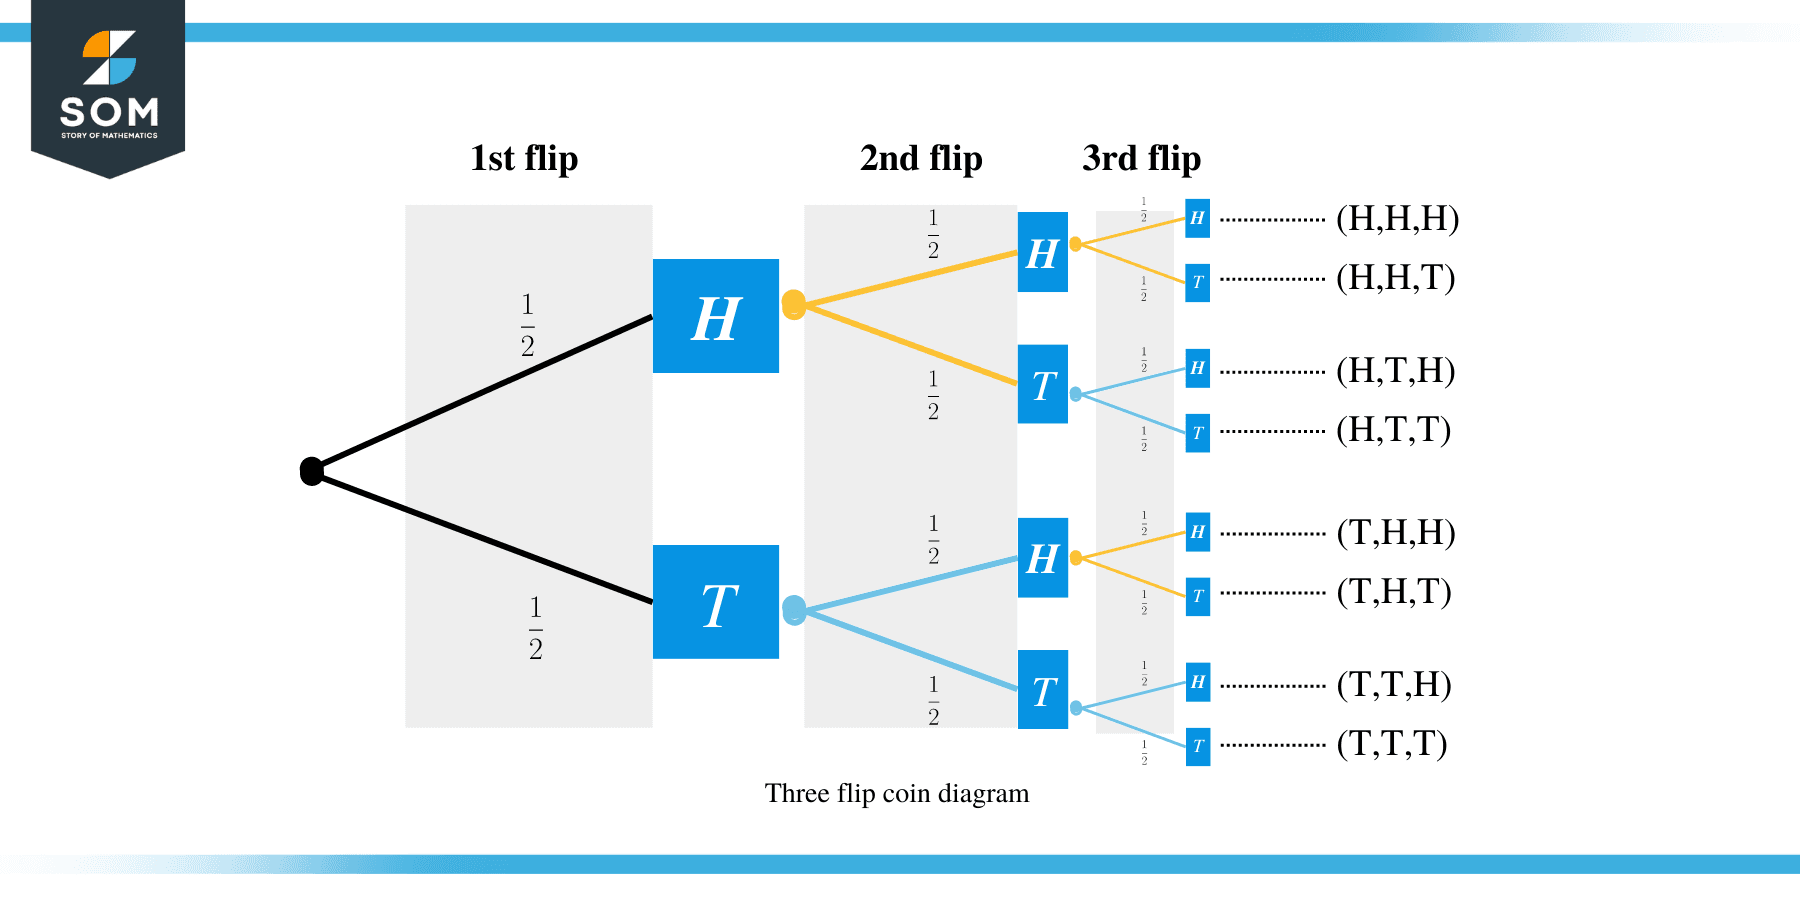
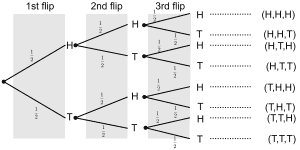
A fair coin is flipped three times. Draw a tree diagram to calculate the probability of the following events:
- Getting three Tails.
- Getting two Heads.
- Getting no Heads.
Solution:
1) Getting three Tails
From the tree diagram, we can see that only one outcome corresponds to the event of getting all three Tails. To get probabilities out of a tree diagram, we multiply the probabilities along the branches. So, the probability of getting three Tails is
$P(\textrm{Three Tails}) = \frac12 \times \frac12 \times \frac12=\frac18$.
2) Getting two Heads
We can see that there are three events that have two Heads,i.e., $E1=\{HHT\}$, $E2=\{HTH\}$ and $E3=\{THH\}$. So we will add the probabilities of each event down the final column of the tree diagram:
$P(E1)=\frac12 \times \frac12 \times \frac12=\frac18$.
$P(E2)=\frac12 \times \frac12 \times \frac12=\frac18$.
$P(E3)=\frac12 \times \frac12 \times \frac12=\frac18$.
So we can write the probability of getting two tails as
$P(\textrm{Two Tails}) = P(E1)+P(E2)+P(E3) = \frac18+\frac18+\frac18=\frac{3}{8}$.
2) Getting no Heads
From the tree diagram, we can see that the probability of getting no Heads is
$P(\textrm{no Heads}) = \frac12 \times \frac12 \times \frac12=\frac18$.
Dice probability using a tree diagram
Dice probabilities play an important role in probability theory. We usually consider multiple rolls of a six-sided fair die. The six possible outcomes of each roll, i.e., $\{1,2,3,4,5,6\}$ are considered to be equally likely, and every single outcome has a probability $\frac16$.
Tree diagrams are particularly useful in solving multiple rolls of a fair die when we are interested in a particular number, e.g., questions like getting a single in 2 in three rolls or not getting a 5 in four rolls, etc. Let us consider a few examples.
Example 2:
We roll a single die three times. Find the probability of the following events using a tree diagram:
- We don’t get a 5 in all three attempts.
- We get only one 5 in three attempts.
Solution:
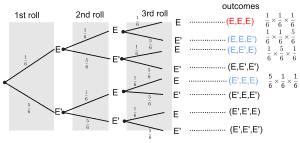
Let F represent the five and F’ represents not a five.
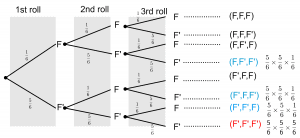
The event that no five appears in all three attempts is highlighted in red in the tree diagram. We calculate the probability as follows:
$P(F’F’F’)=\frac56 \times \frac56 \times \frac56=\frac{125}{216}$.
There are three outcomes in the tree diagram (highlighted in blue) that correspond to the event that only one five appears in three appempt. The corresponding probability is calculated as
$P(\textrm{One four in three attempts}) = P(FF’F’) + P(F’FF’) + P(F’F’F)$
$\qquad \qquad \qquad \qquad \qquad \qquad \quad = (\frac56 \times \frac56 \times \frac16)+(\frac56 \times \frac56 \times \frac16)+(\frac56 \times \frac56 \times \frac16)=\frac{125}{216}$.
Coin and dice probability using a tree diagram
We can combine both coin flip and roll of dice into a single probabilistic experiment, and tree diagrams help visualize and solve such questions. Let’s consider an example where we flip a coin and roll a die simultaneously.
Example: We roll a dice and flip a coin at random. Find the probability of:
a) getting Tails and an even number.
b) getting Tails or Heads and an odd number.
solution:
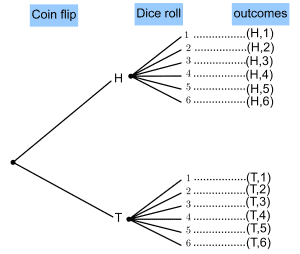
a) From the tree diagram, we see that three possibilities correspond to a Tail and an even number, i.e., $(T,2), (T,4), (T,6)$. The probability of getting Tails is $\frac12$, and the probability of getting any single number is $\frac16$ (We have not shown these probabilities on top of branches to reduce clutter in the diagram). The probability of every single event. i.e., $(T,2)$ or $(T,4)$ or $(T,6)$ is then $\frac12 \times \frac16 =\frac{1}{12}$. Finally, we add these individual probabilities to get the final answer
$P(\textrm{Tails and an even}) = \frac{1}{12} + \frac{1}{12} + \frac{1}{12} = \frac{3}{12} = \frac14$.
b) If we get Heads, then there are three possibilities of getting an odd number, as shown in the tree diagram, i.e., $(H,1), (H,3), (H,5)$. The probability of getting Heads is $\frac12$ and getting any single number is $\frac16$. So, the probability of $(H,1)$ or $(H,3)$ or $(H,5)$ is $\frac12 \times \frac16 = \frac{1}{12}$. Similarly, for Tails, we have three possibilities of getting an odd number, i.e., $(T,1), (T,3), (T,5)$. Each possibility has a probability $\frac{1}{12}$. To get the required probability, we need to add the probabilities of all the required possibilities, i.e.,
$P(\textrm{Heads or Tails and an odd number}) = \frac{1}{12} + \frac{1}{12} + \frac{1}{12} + \frac{1}{12} + \frac{1}{12} + \frac{1}{12} = \frac{6}{12} = \frac12$.
Probability of sampling using a tree diagram
In probability theory, many situations deal with sampling from a given collection. For example, sampling a card from a deck of 52 cards, sampling a ball from a bucket of different colored balls, sampling an item from a set of defective and non-defective items, etc. Sampling may be done with replacement, i.e., the sampled object is replaced in the collection. The sampling may be done without replacement, i.e., the sampled object is not replaced in the collection, and so probabilities of the next sample are dependent on the previous sample. In either case, tree diagrams offer a useful tool to visualize and solve these sampling questions.
Sampling with replacement
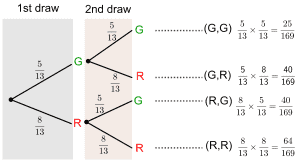
Let’s suppose there are thirteen balls in a box. Five balls are Green(G), and eight balls are Red(R). If we draw two balls, one at a time, with replacement, find the probability of the following events:
- Both Balls are Green.
- Both balls are Red.
- The first ball is Green and the second is Red.
- The first ball is Red and the second is Green.
Solution:
We can solve this question by drawing a tree diagram as shown below:
Probability without replacement using a tree diagram
Example:
A bag contains 10 balls. 3 are blue, and 7 are red. A ball is drawn at random and NOT replaced in the bag. Draw a tree diagram to represent the probabilities of drawing two consecutive balls of the same color.
solution:
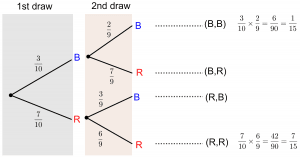
Notice that the probabilities of drawing a Red or Blue ball are different in the second draw as compared to the first draw. For instance, in the first draw, we have $3$ blue and $7$ red balls, so the probability of drawing a Blue ball is $\frac{3}{10}$. For the second draw, if we assume that a Blue ball was drawn in the first draw, then there would be $2$ Blue and $7$ Red balls left, and hence the probability of drawing another Blue ball is $\frac{2}{9}$, as shown in the top branch of the second draw. We calculate all the second draw probabilities using a similar argument and show them on top of their respective branches. Finally, the probability of drawing two balls of the same color is found by adding the probabilities corresponding to $(B,B)$ and $(R,R)$ outcomes, i.e.,
$P(\textrm{Two balls of same color})=P(R,R)+P(B,B)$
$=\frac{7}{15}+\frac{1}{15}=\frac{8}{15}$.
Bernoulli Trials and tree diagrams
One of the most useful applications of tree diagrams is in visualizing and solving questions related to Bernoulli Trials.
Bernoulli Trials refer to probabilistic events with only two possible outcomes, success and failure. If the probability of success is assumed to be $p$, then the probability of failure is $1-p$. In Bernoulli trials, we assume that the probability of success and failure remains the same for each trial.
There are two important questions that we are usually interested in Bernoulli Trials problems.
- The probability of $k$ successes in $n$ trials.
- The probability of first success in $k$ trials.
Both these questions can be solved using tree diagrams, as shown in the examples.
Example: Suppose a factory is producing light bulbs. The probability that any light bulb is defective is $p = 0.01$. A tester is testing light bulbs at random. What is the probability of the following events:
- Finding 2 defective light bulbs in 3 tests.
- Finding no defective light bulbs in 3 tests.
- The first defective light bulb is found at the third attempt.
- The first defective light bulb is found within the first two attempts.
Solution:
Let D represents a ”defective light bulb” and D’ represents a ”not defective light bulb”.
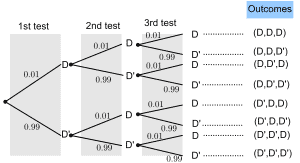
The probability of a defective light bulb is given to be $P(D)=0.01$. From basic probability theory, we know that:
$P(D’)=1-P(D)=1-(0.01)=0.99$.
1. Finding 2 defective light bulbs:
$P(\textrm{finding 2 defective light bulbs})=P(D’, D, D)+P(D, D’, D)+P(D, D, D’)$
$ =(0.99\times 0.01 \times 0.01)+(0.01\times 0.99 \times 0.01)+(0.01\times 0.01 \times 0.99)$.
$ =0.000099+0.000099+0.000099=0.000297$.
2. Finding no defective light bulbs:
$P(\textrm{finding no defective light bulbs})=P(D’, D’, D’)$.
$=(0.99 \times 0.99 \times 0.99) = 0.9703$.
3. The first defective light bulb is found at the third attempt:
$P(\textrm{1st defective light bulb at 3rd attempt})=P(D’, D’, D)$.
$=(0.99 \times 0.99 \times 0.01) = 0.009801$.
4. The first defective light bulb is found within the first two attempts:
$P(\textrm{1st defective light bulb at first 2 attempts})=P(D, D, D’)$.
$=(0.01 \times 0.01 \times 0.99) = 0.000099$.
Practice questions
- The letters of the word ‘SUCCESS’ are printed on 7 cards. Jacob chooses a card at random, replaces it, then chooses a card again. Calculate the probability using a tree diagram that only one of the cards he chooses has the letter C printed on it.
We roll a single die three times. Find the probability of the following events using a tree diagram:
- Getting an even number in all three attempts.
- Getting at least two even numbers in three attempts.
3.Three fair coins are tossed simultaneously. Use a tree diagram to determine the probability of getting:
- At least 2 Tails.
- At most, two Heads.
- No Tails at all.
4. Two cards are drawn from a deck of 52 cards without replacement. What is the probability
- Both cards are Kings.
- Atleast one of the cards is a King
Answer Key
- C’ represents Not the letter C.
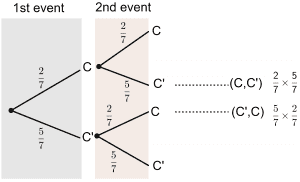
We can see from the tree diagram that the probability for one of the card he chooses has ‘ C ‘ printed on it is:
$P(\textrm{One of the card is C})=P(C,C’)+P(C’,C)$
$= (\frac27 \times \frac57)+(\frac57 \times \frac27) = \frac{20}{49}$.
2.
$P(\textrm{All even}) = P(E,E,E) = \frac{1}{216}$.
$P(\textrm{Two evens}) = P(E,E,E’) + P(E,E’,E) + P(E’,E,E) = \frac{15}{216}$.
3.
$P(\textrm{atleast two Tails}) = P(T,T,H) + P(T,H,T) + P(H,T,T) + P(T,T,T) = \frac12$.
$P(\textrm{at most two Heads}) = 1 – P(H,H,H) = \frac78$.
$P(\textrm{No tails}) = P(H,H,H) = \frac18$.
4.
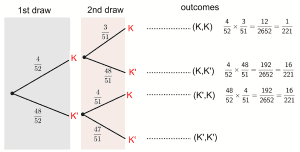
$P(\textrm{Both Kings}) = P(K,K) = \frac{1}{221}$.
$P(\textrm{Atleast one King}) = P(K,K’) + P(K’,K) + P(K,K) = \frac{33}{221}$.