JUMP TO TOPIC
Vertical Stretch – Properties, Graph, & Examples
 Ever noticed graphs that look alike, but one is more vertically stretched than the other? This is all thanks to the transformation technique we call vertical stretch.
Vertical stretch on a graph will pull the original graph outward by a given scale factor.
When a base function is multiplied by a certain factor, we can immediately graph the new function by applying the vertical stretch.
Before we dive deeper into this transformation technique, it’s best to review your knowledge on the following topics:
- Understanding the common parent functions we might encounter.
- Refresh your knowledge of vertical and horizontal transformations.
Feel free to click on the links to refresh your knowledge on these essential topics. We’ll now discuss the third transformation technique: vertical stretching.
What is a vertical stretch?
Vertical stretch occurs when a base graph is multiplied by a certain factor that is greater than 1. This results in the graph being pulled outward but retaining the input values (or x). When a function is vertically stretched, we expect its graph’s y values to be farther from the x-axis.
The graph below shows the graph of f(x) and its transformations. Why don’t we observe how f(x) is transformed when we multiply the output values by a factor of 3 and 6?
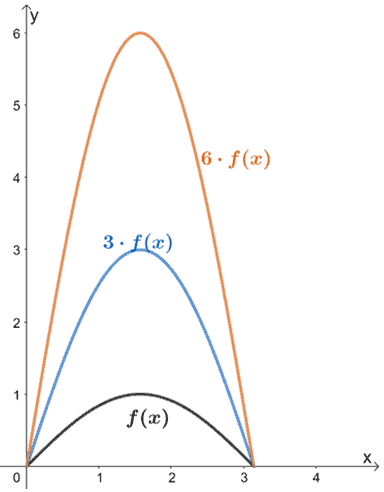
When f(x) is multiplied by scale factors of 3 and 6, its graph stretches by the same scale factors. We can also see that their input values (x for this case) remain the same; only the values for y were affected when we stretched f(x) vertically.
How do we generalize this rule? When we have |a| > 1, a · f(x) will stretch the base function by a scale factor of a. The input values will remain the same, so the graph’s coordinate points will now be (x, ay).
This means that if f(x) = 5x + 1 is vertically stretched by a factor of 5, the new function will be equivalent to 5 · f(x). Hence, the resulting function is 5(5x + 1) = 25x + 5.
How to vertically stretch a function?
When given a function’s graph, we can vertically stretch it by pulling the curve outwards based on the given scale factor. Here are some things to remember when we vertically stretch functions:
- Ensure that the values for x remain the same, so the base of the curve will not change.
- This means that when applying vertical stretches on a base graph, its x-intercepts will remain the same.
- Take note of the new critical points, such as the new maximum point of the graph.
Why don’t we try vertically stretching the function y = √x by a factor of 2?
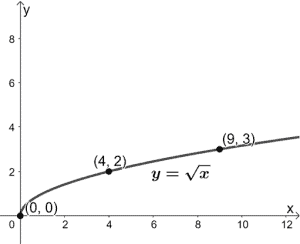
We’ve included some guide points highlighting how they also change when we graph the new function y = 2√x. What do we expect from the new graph?
It will still start at the origin, the y-coordinates will increase by a factor of 2, and the graph will stretch by a factor of 2.
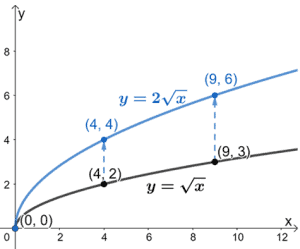
The graph above shows how we can vertically stretch the graph of y =√x by a factor of 2 to graph y = 2√x as well.
We can apply the same process when vertically stretching different types of functions and graphs. Before we try other examples, why don’t we summarize what we have learned so far about vertical stretch?
Summary of vertical stretch definition and properties
We’ve now learned about the effect of scaling a function by a positive factor, a. Below are some important pointers to remember when dealing with vertical stretches on graphs:
- A vertical stretch occurs only when the scale factor is greater than 1.
- Make sure to multiply the y-coordinates by the same scale factor.
- Retain the x-intercepts’ position.
- The vertically stretched function will have the same domain and a new range.
Let’s keep these helpful reminders in mind when we solve the questions after this section. Ready? Let’s begin applying this transformation technique!
Example 1
The function, g(x), is obtained by vertically stretching f(x) = x2 + 1 by a scale factor of 3. Which of the following is the correct expression for g(x)?
- g(x) = 3x2 + 1
- g(x) = x2 + 3
- g(x) = 3x2 + 3
- g(x) = 3(x + 1)2
Solution
When we stretch a function vertically, we multiply the base function by its scale factor. Hence, we have g(x) = 3 · f(x). Let’s make sure to distribute 3 to each of the term in f(x).
g(x) = 3(x2 + 1)
=3x2 + 3
This means that the correct expression for g(x) is 3x2 + 3.
Example 2
The table of values for f(x) is shown below. If g(x) = 4·f(x), construct a table of values for the function g(x).
| x | -6 | -4 | -2 | 2 | 4 | 6 |
| f(x) | 9 | 4 | 1 | 1 | 4 | 9 |
Solution
Since g(x) = 4·f(x), the function g(x) is vertically stretched by a scale factor of 4. What does this mean for its table of values? 9 =
We multiply each value of f(x) by 4 to find the output values for g(x). Note that the values for the x-coordinates will remain the same.
| x | -6 | -4 | -2 | 2 | 4 | 6 |
| g(x) | 36 | 16 | 4 | 4 | 16 | 36 |
Example 3
Fill in the blanks to make the following statements true, given that f(x) = |x|.
- If g(x) = 4|x|, the function g(x) is stretched vertically by a scale factor of ________.
- If the graph of f(x) is stretched vertically by a factor of 2 to attain h(x), so h(x) = ___ ∙ f(x).
- If the graph of f(x) is stretched vertically by a factor of 3, the expression for h(x) is ________.
Solution
- Comparing g(x) and f(x), we have g(x) = 4 ∙ f(x). This means that the function g(x) is vertically stretched by a factor of 4.
- Stretching f(x) vertically by a factor of 2 will result in h(x) being equal to 2 times f(x).
- Stretching f(x) vertically by a factor of 3 will result to h(x) being equal to 3 times f(x). Hence, h(x) = 3|x|.
Example 4
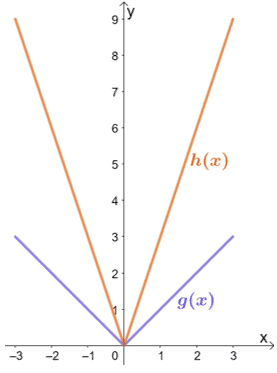
Observe the two functions shown below and relate h(x) to g(x).
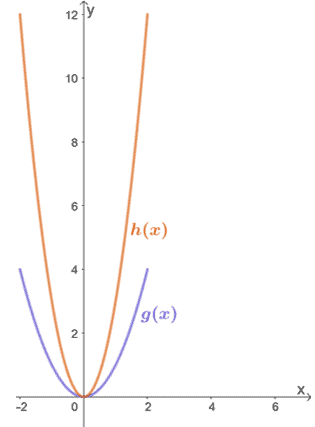
Solution
By inspection alone, we can see that h(x) results from vertically stretching g(x). To find the factor by which h(x) was stretched, let’s inspect some corresponding values for g(x) → h(x).
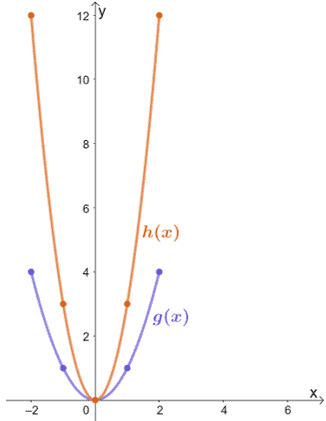
- (0, 0) → (0, 0)
- (1, 1) → (1, 3)
- (2, 4) → (1, 12)
We can see that the y-coordinate of h(x) is thrice that of g(x) for each pair of points. This means that h(x) = 3 ∙ g(x), so h(x) is the result of g(x) being stretched vertically by a scale factor of 3.
Example 5
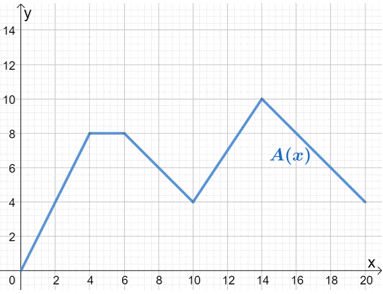
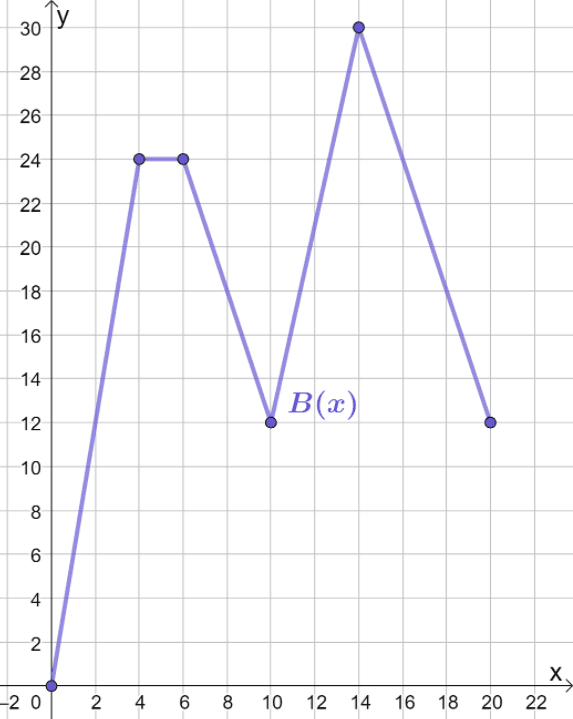
The function, A(x), models the distance (in km) traveled by Car A over a period of time (in hours).
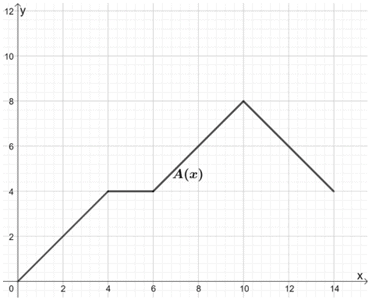
Jack wanted to compare this model to B(x), whose motion follows the same pattern, but the car being observed can cover two times the distance from A(x). Use the graph for A(x) to sketch the graph of B(x).
Solution
Since B(x) = 2 ∙ A(x), we vertically stretch the graph of A(x) by a scale factor of 2.
To do this, we can take note of some points from the graph and find their corresponding values for B(x). To find the new ordered pairs, let’s multiply each y-coordinate by 2.
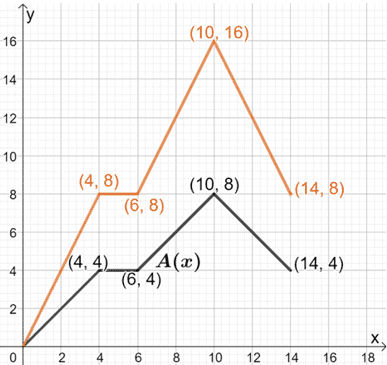
We can connect these points to form B(x). Keep in mind that the shape of A(x) and its base should remain the same.
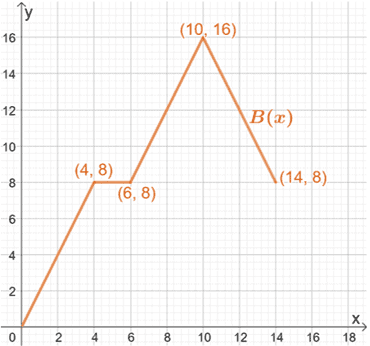
Hence, we have the final graph for B(x), as shown above.
Example 6
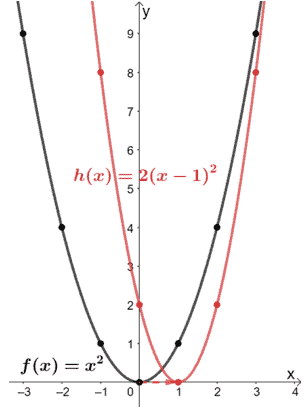
Observe the two functions shown below and relate h(x) to g(x). What is the expression for h(x)?
Solution
We can see that h(x) is the result of g(x) is vertically stretched by a certain scale factor. Let’s go ahead and inspect some of the corresponding points.
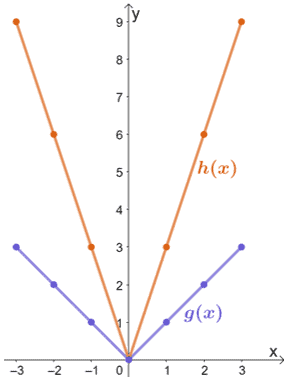
- (-3, 3) → (-3, 9)
- (-1, 1) → (-1, 3)
- (0, 0) → (0, 0)
- (1, 1) → (1, 3)
- (3, 3) → (3, 9)
From this, we can see that when g(x) is vertically stretched by a scale factor of 3, the resulting graph will be that of h(x). Hence, we have h(x) = 3 ∙ g(x).
The function g(x) represents the parent function of all absolute value functions. This means that g(x) = |x|. To find the expression for h(x), we multiply the expression of g(x) by 3. Hence, we have h(x) = 3|x|.
Example 7
Find the transformations done on f(x) to attain h(x).
- f(x) = x2 → h(x) = 3x2 + 24x + 48
- f(x) = √x → h(x) = 2√(x + 2)
- f(x) = ex → h(x) = 5(ex – 2) – 1
Solution
- Let’s try to factor the expression for h(x) first to see if we can find the transformations applied on f(x). Begin by factoring h(x):
- h(x) = 3(x2 + 8x + 16) = 3(x + 4)2 = 3 ∙ f(x + 4)
- From this factored form, we can see that h(x) is the result when f(x) is translated 4 units to the left and stretched vertically by 3.
- Take note of the factor multiplied to √x and the unit subtracted from the input value.
- This results to h(x) = 2 ∙ f(x + 2).
- Hence, f(x) has to be translated 2 units to the left and stretched vertically by 2.
- Let’s observe the difference between ex and h(x).
- h(x) = 5 ∙ ex – 2 -1 , hence, we have h(x) = 5 ∙ f(x – 2) – 1.
- This means that f(x) is translated 2 units to the right, stretched vertically by 5, and translated one unit downward.
Example 8
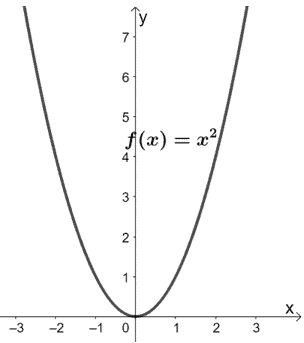
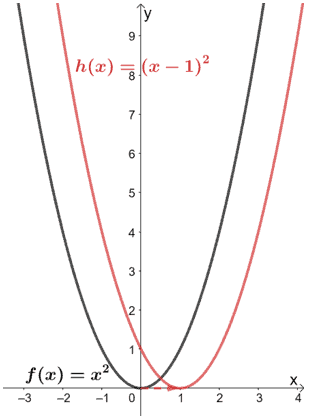
What are the transformations done on f(x) so that it results to h(x) = 2x2 – 4x + 2? Use the graph of f(x) shown below to guide you. Apply the transformations to graph h(x).
Solution
Let’s try to factor the expression for h(x) first to see if we can find the transformations applied on f(x).
Begin by factoring the common factor shared by the three terms.
2x2 – 4x + 2 = 2(x2 – 2x + 1)
Factor the expression using (a – b)2 = a2 – 2ab + b2.
2(x2 – 2x + 1) = 2(x – 1)2
Hence, we have h(x) = 2(x – 1)2. From this form, we can see the following:
- From (x – 1)2, we can see that f(x) was translated one unit to the right.
- The resulting graph was then vertically stretched by a factor of 2.
Let’s use these transformations and the graph of f(x) to graph h(x). So, start by translating the parent function y = x2 one unit to the right.
Now, let’s stretch the graph vertically by a scale factor of two.
Let’s take out the reference function and return the final graph of h(x).
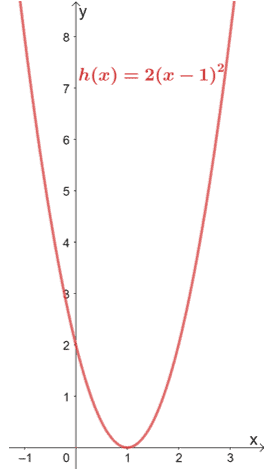
This example shows how transformations can save time in graphing families of functions.
Practice Questions
Open Problems
1. The table of values for $f(x)$ is shown below. If $g(x) = 3 \cdot f(x)$, construct a table of values for the function $g(x)$.
| x | -3 | -2 | -1 | 0 | 1 | 2 | 3 |
| f(x) | -27 | -8 | -1 | 0 | 1 | 8 | 27 |
2. The function, $A(x)$, models the distance (in km) traveled by Car A over time (in hours).
Mary wanted to compare this model to $B(x)$, whose motion follows the same pattern, but the car being observed can cover three times the distance from $A(x)$. Use the graph for $A(x)$ to sketch the graph of $B(x)$.
Open Problem Solutions
1.
| x | -3 | -2 | -1 | 0 | 1 | 2 | 3 |
| g(x) | -81 | -24 | -3 | 0 | 3 | 24 | 81 |
2.
Images/mathematical drawings are created with GeoGebra.