JUMP TO TOPIC
Experimental Probability – Explanation & Examples
 Have you ever tossed a die multiple times hoping to get a 6 but get none? Since probability is the study of chance it makes sense that what we expect is not always what we get. This brings us to experimental probability and its definition.
Experimental probability is the probability determined based on the results from performing the particular experiment.
In this lesson we will go through:
- The meaning of experimental probability
- How to find experimental probability
What is experimental probability?
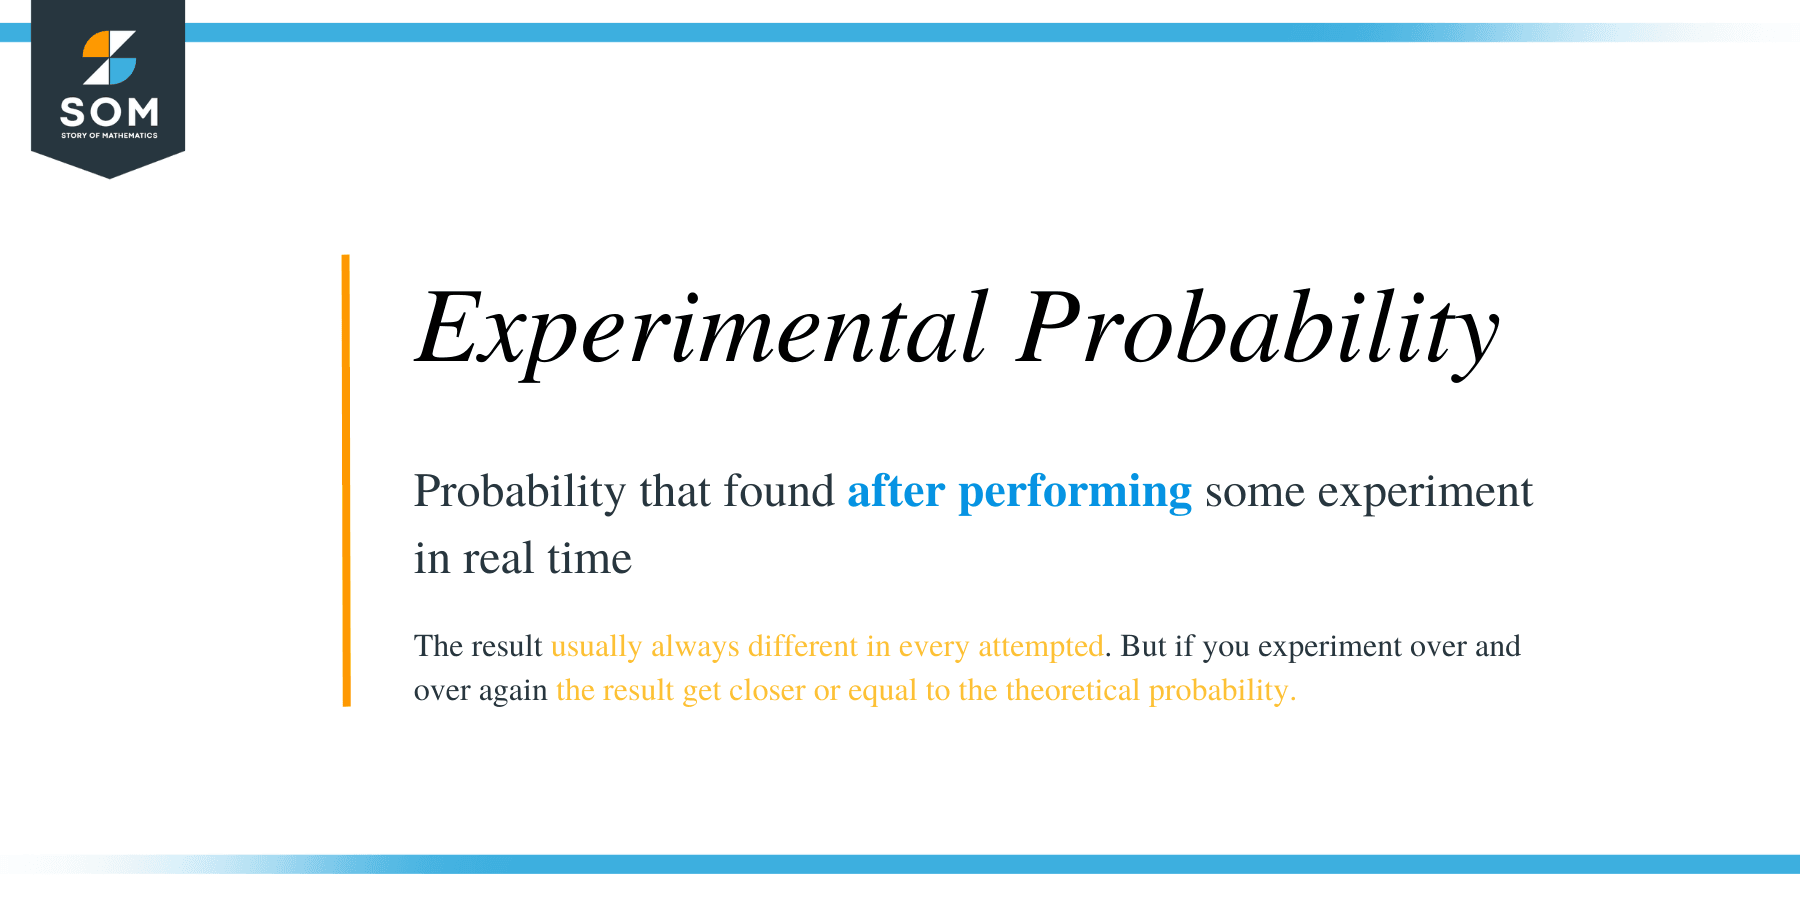 Theoretically, if you toss a die six times, you should expect to get one 6. However, if you’ve played any game involving dice you know that is not always the case. This is because the probability you get after performing an experiment may be different from what you expected. We can restate the definition of experimental probability as:
The ratio of the number of outcomes favorable to an event to the total number of trials of the experiment.
Experimental Probability can be expressed mathematically as:
$P(\text{E}) = \frac{\text{number of outcomes favorable to an event}}{\text{total number of trials of the experiment}}$
Let’s go back to the die tossing example. If after 12 throws you get one 6, then the experimental probability is $\frac{1}{12}$. You can compare that to the theoretical probability. The theoretical probability of getting a 6 is $\frac{1}{6}$. This means that in 12 throws we would have expected to get 6 twice.
Similarly, if in those 12 tosses you got a 1 five times, the experimental probability is $\frac{5}{12}$.
Does this mean that something is wrong with the theory of probability? Certainly not! As your number of trials of an experiment increases, you will notice that the experimental probability gets closer to the theoretical. For example, if you were to toss the die hundreds of times, the experimental probability will get closer or equal to the theoretical. 
How do we find experimental probability?
Now that we understand what is meant by experimental probability, let’s go through how it is found.
To find the experimental probability of an event, divide the number of observed outcomes favorable to the event by the total number of trials of the experiment.
Let’s go through some examples.
Example 1: There are 20 students in a class. Each student simultaneously flipped one coin. 12 students got a Head. From this experiment, what was the experimental probability of getting a head?
Solution:
Number of coins showing Heads: 12
Total number of coins flipped: 20
$P(\text{Head}) = \frac{12}{20} = \frac{3}{5}$
Example 2: The tally chart below shows the number of times a number was shown on the face of a tossed die.
Number | Frequency |
1 | 4 |
2 | 6 |
3 | 7 |
4 | 8 |
5 | 2 |
6 | 3 |
a. What was the probability of a 3 in this experiment?
b. What was the probability of a prime number?
Solution:
First, sum the numbers in the frequency column to see that the experiment was performed 30 times. Then find the probabilities of the specified events.
a. Number of times 3 showed = 7
Number of tosses = 30
$P(\text{3}) = \frac{7}{30}$
b. Frequency of primes = 6 + 7 + 2 = 15
Number of trials = 30
$P(\text{prime}) = \frac{15}{30} = \frac{1}{2}$
Experimental probability can be used to predict the outcomes of experiments. This is shown in the following examples.
Example 3: The table shows the attendance schedule of an employee for the month of May.
a. What is the probability that the employee is absent?
b. How many times would we expect the employee to be present in June?
Sunday | Monday | Tuesday | Wednesday | Thursday | Friday | Saturday |
| 1 Present | 2 Present | 3 Present | 4 Present | 5 Present | 6 Present |
7 Present | 8 Present | 9 Present | 10 Present | 11 Present | 12 Present | 13 Present |
14 Present | 15 Present | 16 Present | 17 Absent | 18 Present | 19 Present | 20 Present |
21 Absent | 22 Absent | 23 Present | 24 Present | 25 Present | 26 Present | 27 Present |
28 Present | 29 Present | 30 Present | 31 Present |
Solution:
a. The employee was absent three times and the number of days in this experiment was 31. Therefore:
$P(\text{Absent}) = \frac{3}{31}$
b. We expect the employee to be absent
$\frac{3}{31} × 30 = 2.9 ≈ 3$ days in June
Example 4: Tommy observed the color of cars owned by people in his small hometown. Of the 500 cars in town, 10 were custom colors, 100 were white, 50 were red, 120 were black, 100 were silver, 60 were blue, and 60 were grey.
a. What is the probability that a car is red?
b. If a new car is bought by someone in town, what color do you think it would be? Explain.
Solution:
a. Number of red cars = 50
Total number of cars = 500
$P(\text{red car}) = \frac{50}{500} = \frac{1}{10}$
b. Based on the information provided, it is most likely that the new car will be black. This is because it has the highest frequency and the highest experimental probability.
Now it is time for you to try these examples.
Practice Questions
The table below shows the colors of jeans in a clothing store and their respective frequencies. Use the table to answer the questions that follow.
Color of Jeans | Frequency |
Blue | 75 |
Black | 60 |
Grey | 45 |
Brown | 25 |
White | 20 |
- What is the probability of selecting a brown jeans?
- What is the probability of selecting a blue or a white jeans?
Question 3
On a given day, a fast food restaurant notices that it sold 110 beef burgers, 60 chicken sandwiches, and 30 turkey sandwiches. From this observation, what is the experimental probability that a customer buys a beef burger?
Question 4
Over a span of 20 seasons, a talent competition notices the following. Singers won 12 seasons, dancers won 2 seasons, comedians won 3 seasons, a poet won 1 season, and daring acts won the other 2 seasons.
a. What is the experimental probability of a comedian winning a season?
b. From the next 10 seasons, how many winners do you expect to be dancers?
Question 5
Try this at home! Flip a coin 10 times. Record the number of tails you get. What is your P(tail)?
Solutions
Question 1
Number of brown jeans = 25
Total Number of jeans = 125
$P(\text{brown}) = \frac{25}{125} = \frac{1}{5}$
Question 2
Number of jeans that are blue or white = 75 + 20 = 95
Total Number of jeans = 125
$P(\text{blue or white}) = \frac{95}{125} = \frac{19}{25}$
Question 3
Number of beef burgers = 110
Number of burgers (or sandwiches) sold = 200
$P(\text{beef burger}) = \frac{110}{200} = \frac{11}{20}$
Question 4
a. Number of comedian winners = 3
Number of seasons = 20
$P(\text{comedian}) = \frac{3}{20}$
b. First find the experimental probability that the winner is a dancer.
Number of winners that are dancers = 2
Number of seasons = 20
$P(\text{dancer}) = \frac{2}{20} = \frac{1}{10}$
Therefore we expect
$\frac{1}{10} × 10 = 1$ winner to be a dancer in the next 10 seasons.
Question 5
To find your P(tail) in 10 trials, complete the following with the number of tails you got.
$P(\text{tail}) = \frac{\text{number of tails}}{10}$