Slope of a Line – Explanation and Examples
 The slope of a line is defined as the change in y-values divided by the change in x-values. This number measures how steep a line is.
The slope of a line does not uniquely define it, but it does give us a lot of information. It is also a necessary ingredient in a line’s equation.
The slope of a line is often a fraction, so it is a good idea to review fractions before reading this section. A review of coordinate geometry and the coordinate plane would also help.
This section covers the following topics:
- What is the Slope of a Line?
- How to Calculate Slope of a Line
- How to Find Slope with Two Points
What is the Slope of a Line?
The slope of a line is a number used to describe how steep a line is. This number can be positive, negative, or zero. It can also be rational or irrational.
The slope of a line does not uniquely define it. This means that if you know the slope of a line, you cannot precisely say which points the line runs through.
Parallel lines are any lines that have the same slope. Perpendicular lines are lines that become parallel when one is rotated 90 degrees. If two perpendicular lines cross, they will form four 90 degree angles.
A line with a slope of 0 is a horizontal line. Any line that moves upwards as it goes further to the right is positive. Conversely, any line that moves downwards as it goes further to the left is negative.
A vertical line such as the y-axis is said to have a slope that is “undefined.” This has to do with how slope is determined mathematically, which we will discuss in more detail below.
How to Calculate the Slope of a Line
Slope is typically represented by the letter m. Interestingly, there is no consensus about why this letter was chosen. Anyone who knows French, however, can easily remember this because the word “monter” means “to climb.” This word has the same origin as the English word mountain, which can also serve as mnemonic since mountains have slopes.
We find the slope by dividing the change in y-values by the change in x-values. It does not matter which coordinates we choose for this calculation because the ratio remains constant.
How to Find Slope with Two Points
The easiest way to find slope is to find two coordinate pairs for points on the line. Call these two points (x1, y1) and (x2, y2). Note that it does not matter which point is labelled as which.
The formula for slope is: m=(y1-y2)⁄(x1-x2).
Remember that slope is “rise over run,” so you do not accidentally swap the x and y values in the formula.
If a line runs through the points (1, 2) and (-1, -1), label the first point (x1, y1) and the second (x2, y2). Then, its slope is:
m=(2+1)⁄(1+1)=3⁄2.
This means that for every two units the line moves to the right, it will move upwards three units.
We can also look at a coordinate plane with two points and find the slope graphically using two points. Consider, for example, the coordinate plane below.
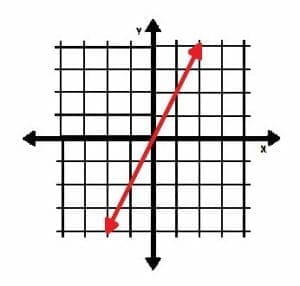
We should first find two points that lie on the line. It makes sense to use the simplest points possible, so the origin and the point (1, 2) make the most sense.
To get from the first point to the second requires us to move “up two (units), over one (unit right).” Saying this out loud while counting the units gives away the slope. In this case, it is indeed 2⁄1, or “two over one.”
We can double check this by putting the values into the formula above. If (0, 0) is (x1, y1), and (1, 2) is (x2, y2), we have:
m=(0-2)⁄(0-1)=-2⁄-1=2.
Note that counting graphically to determine slope only works when the data set includes rational numbers that are easy to identify with the graph’s scale.
Negative Slope
The two examples above both feature positive slopes. Finding a negative slope, however, is very similar.
Consider, for example, two points (10, 0) and (0, 50) that lie on a line. We then label them (x1, y1) and (x2, y2) respectively. Using this information, the slope of the line is:
m=(0-50)⁄(10-0)=-50⁄10=-5.
Note that the order we pick the points in doesn’t matter. If we had chosen (10, 0) to be (x2, y2) and (0, 50) to be (x1, y1), our equation would have been:
m=(50-0)⁄(0-10)=50⁄-10=-5.
Finding negative slopes graphically also works in the same way as finding positive slopes graphically. Consider the line shown below:
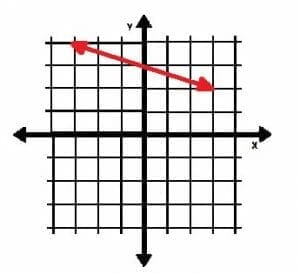
This line passes through the points (0, 3) and (3, 2). To get from one point to the other, we have to go “down one (unit), over three (units right).” Since “down” means negative motion, the slope of the line is -1⁄3, “minus one over three.”
Again, this means that for every three units this line moves to the right, it moves one unit downwards.
Zero Slope and Undefined Slope
What happens when our line is exactly horizontal or exactly vertical?
Consider the red horizontal line and the blue vertical line in the image below.
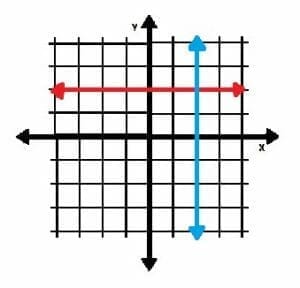
Let’s find the slopes of each.
The red line passes through the points (0, 2) and (1, 2). This means its slope is:
m=(2-2)⁄(0-1)=0⁄-1=0.
This horizontal line, like all horizontal lines, has a slope of 0 because its height never changes.
The blue line, on the other hand, passes through the points (2, 0) and (2, 1). This means its slope is:
m=(0-1)⁄(2-2)=-1⁄0…
and this is a problem because we cannot divide by zero. Therefore, this vertical line, and indeed all vertical lines have a slope that is undefined. This makes sense because it’s height is all heights at once.
Other Ways to Find Slope
Using given coordinates (or finding coordinates) and then plugging them into the slope equation is the most direct way of finding slope. It is not, however, the only way to do it. Sometimes information given about other lines is a better method.
Parallel Lines
Parallel lines have the same slope, and there are infinitely many lines parallel to a given line. Each line will just cross the x- and y-axes at different points.
For example, the two lines shown below are parallel.
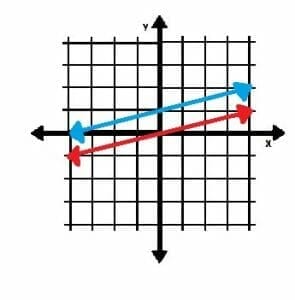
The red line crosses both axes at the origin. The blue line, however, crosses the y-axis at the point (0, 1). It then crosses the x-axis at the point (-4, 0). Since their slopes are the same, though, they are parallel.
If we know the slope of one line and know that another line is parallel, we can determine the slope of the second line easily.
In the image above, for example, the slope of the red line is easier to find since it passes through the origin. If (0, 0) is (x1, y1), and (4, 1) is (x2, y2), the slope is:
m=(0-1)⁄(0-4)=-1⁄-4=1⁄4.
Since the blue line is parallel, we can bypass the formula. Its slope is also 1⁄4.
Perpendicular Lines
Perpendicular lines meet at a 90 degree angle. Like parallel lines, there are infinitely many lines perpendicular to a given line. They will just meet the given line at different points.
The slopes of two perpendicular lines are related. Each is the opposite sign reciprocal of the other.
Recall that the reciprocal is the inverse of a fraction. To find it, simply flip the fraction upside down.
If your slope is a whole number, like -8, or a decimal like 0.8, first convert the number into a fraction. -8 becomes -8⁄1 and 0.8 becomes 8⁄10 or 4⁄5.
Then, flip the fraction upside down and change the sign. -8⁄1 becomes 1⁄8 and 4⁄5 becomes -5⁄4. This means that a line with slope 1⁄8 is perpendicular to a line with slope 8, and a line with slope -5⁄4 is perpendicular to a line with slope 4⁄5.
Knowing that to lines are perpendicular can consequently help us find the slope more quickly.
For example, in the image below, the red and blue lines are perpendicular.
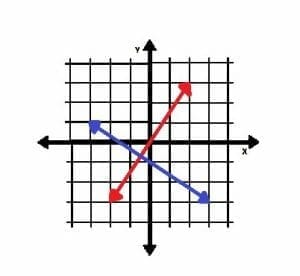
Again, since the red line crosses through the origin, its slope is easier to determine. Let (0, 0) be (x1, y1), and (3, 2) be (x2, y2). Then,
m=(0-2)⁄(0-3)=-2⁄-3=2⁄3.
The blue line’s slope is the opposite reciprocal. 2⁄3 inverted is 3⁄2, and the adding the negative sign makes it -3⁄2. Therefore, -3⁄2 is the slope of the blue line.
Real World Meaning
The slope also has meaning in the real world. Recall that we often call the x-axis the “independent variable,” and y-axis the “dependent variable.” This means that a change in the x variable causes a change in the y variable.
We actually use slope all of the time without realizing it. When we say a rate like “mile per hour” when talking about a car’s speed or “inches per year” when talking about a plant’s growth, we are talking about slope.
For example, if we plotted time along the x-axis and miles traveled by some car along the y-axis, the slope of line is the miles traveled by that car in an hour. If the car started at 0 miles at a time 0 hours and went 50 miles in one hour, its speed is (0-50)⁄(0-1)=-50⁄-1=50 miles per hour. This is also the slope of the line connecting the two points, though!
Consequently, another way to think about slope is as a rate.
Examples
This section will cover examples of common types of problems involving the slope of a line. It will also include step-by-step solutions to them.
Example 1
Given that the points (8, 7) and (-20, 14) lie on a line, find the slope of the line.
Example 1 Solution
Since we are given two points, we can use the equation for the slope of a line. Let (8, 7) be (x1, y1) and (-20, 14) be (x2, y2). Then, plugging the values into the formula gives us:
m=(7-14)⁄(8+20)=-7⁄28=-1⁄4.
The slope of the line is therefore -1⁄4.
Note: It is possible to determine the unique equation of a line when given two points, but that process is outside the scope of this lesson.
Example 2
Find the slope of the red line shown in the graph below.
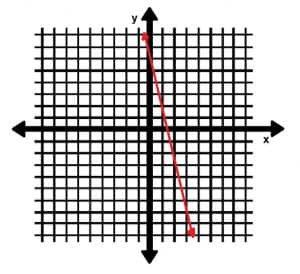
Example 2 Solution
We can use the graph to find two points to plug into our slope formula.
Since the points (1, 2) and (3, -7) lie on the line, we will use them. Let (1, 2) be (x1, y1) and let (3, -7) be (x2, y2). Then, we have:
m=(2+7)⁄(1-3)=9⁄-2=-9⁄2.
Therefore, the slope is -9⁄2.
We could also have solved this problem graphically. To get from the first point to the second point requires us to go “down 9 (units), over 2 (units right).” Since “down” indicates a negative direction, the slope is -9⁄2, read “minus 9 over 2.”
Example 3
The slope of a line p is 3⁄5. If the points (8, -9) and (2x, -3) lie on the line, what is the value of x?
Example 3 Solution
We can again use the formula for slope, but we need to work backwards. Let (8, -9) be (x1, y1), and let (2x, -3) be (x2, y2). Remember that we already know m=3⁄5. Therefore, we have
3⁄5=(-9+3)⁄(8-2x)
3⁄5=-6⁄(2(4-x)).
Multiplying both sides by 2(4-x) gives us:
3⁄5×2(4-x)=-6
6⁄5(4-x)=-6
24⁄5–6x⁄5=-6.
Then, subtracting 24⁄5 from both sides yields:
–6x⁄5=-30⁄5–24⁄5
–6x⁄5=-54⁄5
Finally, multiplying both sides by -5⁄6 gives us:
x=(-54×-5)⁄(5×6)
x=9.
Therefore, since x=9, the point (2x, -3) is actually (2×9, -3)=(18, -3).
Example 4
Find the slope of any line perpendicular to a line passing through the points (-1, 5) and (-7, 7).
Example 4 Solution
We must first find the slope of the given line. Then, we can calculate the opposite reciprocal of that slope to determine the slope of a line perpendicular to the given line.
Let (-1, 5) be (x1, y1), and let (-7, 7) be (x2, y2). Then, we can calculate the slope as:
m=(5-7)⁄(-1+7)=-2⁄6=-1⁄3.
Since the slope is –1⁄3, the opposite reciprocal is +3, or just 3. Therefore, any line perpendicular to the given line will have a slope of 3.
Example 5
The line k passes through the points (2, 3) and (-1, 8). The line l is shown below.
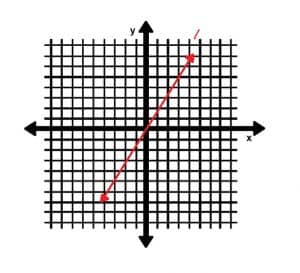
Are the lines k and l parallel, perpendicular, or neither?
Example 5 Solution
In this case, we will have to find the slopes of both lines and compare them.
First, let’s consider the line k. Let (2, 3) be (x1, y1), and let (-1, 8) be (x2, y2). Then, we have:
m=(3-8)⁄(2+1)=5⁄3.
Therefore, the slope of k is 5⁄3.
Next, let’s consider the line l. It is clear that is passes through the points (0, 0) and (5, -3). If the origin is (x1, y1) and (5, -3) is (x2, y2), we have:
m=(3-0)⁄(5-0)=-3⁄5.
Therefore, the slope of l is -3⁄5.
Any line parallel to k has a slope of 5⁄3, so l is not parallel.
Any line perpendicular to k will have a slope that is the opposite reciprocal of k, which is -3⁄5. Since l has a slope of -3⁄5, the two lines are perpendicular.
Example 6
A submarine at a depth of 33 feet below sea level experiences approximately 14.7 pounds per square inch of pressure from the water above it. Another submarine at 66 feet below sea level experiences approximately 29.4 pounds per square inch of pressure from the water above it. Plot these points on a graph and draw a line connecting them. What is the slope of this line and what is its real-world meaning?
Example 6 Solution
We first need to determine whether the pressure or the depth is the independent variable. Since the pressure depends on depth, and not vice versa, the depth is the independent variable and the pressure is the dependent variable. This means the x-variable is depth and the y-variable is pressure.
Therefore, our points are (33, 14.7) and (66, 29.4). The coordinate plane below includes the two points and a line passing through them.
Let (33, 14.7) be (x1, y1) and (66, 29.4) be (x2, y2). The slope, then, is:
m=(29.4-14.7)⁄(66-33)=14.7⁄33.
The slope is therefore 14.7⁄33, which could be read with units as “14.7 pounds per square inch per 33 feet.” In context, this means that for every 33 feet the submarine descends, the pressure around it from the water will increase by 14.7 pounds per square inch.