JUMP TO TOPIC
Transformations of Functions – Explanation & Examples
 When graphing functions, you’ll be asked to transform and translate functions in various ways. Ever wondered how graphs can suddenly be transformed into a different one so that it represents a different function? It’s all thanks to the various forms of transformations we can perform on a function’s graph.
Functions transformations are the different ways we can change the form of a function’s graph so that it becomes a different function.
Amazing, right? If you want to save time when graphing different functions, you’ve reached the right article! We’ll learn about transformations done on functions and focus on translations.
Before we begin, though, since we’re working on graph transformations, we’d recommend reviewing your resources on parent functions. Check out our article on parent functions, too, if you want to take a refresher.
What are transformations of functions?
We’ve learned about parent functions and how a family of functions shares a similar shape. We can extend this knowledge by learning about the transformations of functions.
Transformations of functions are the processes that can be performed on an existing graph of a function to return a modified graph. We normally refer to the parent functions to describe the transformations done on a graph.
As can be seen from the example, transformations on a function can come in different forms and affect the graphs in different ways. This article and the next four ones will focus on the different transformations we can perform on a given function.
Below is a list of the common transformations performed on a graph:
- Horizontal and vertical transformations (or translations)
- Horizontal and vertical stretches
- Horizontal and vertical compressions
- Reflections and rotations
Our article will focus on the horizontal and vertical transformations that we can apply to a function.
How to do transformations of functions?
We can perform transformations based on the rule that we are provided for the transformation. Some transformations will require us to flip the graph over the y-axis or reflect it about the origin.
For now, we’ll focus on two transformations: vertical and horizontal.
Horizontal transformation or translation on a function
When we transform or translate a graph horizontally, we either shift the graph to certain units to the right or to the left. This will be a rigid transformation, meaning the shape of the graph remains the same.
Let’s try translating the parent function y = x3 three units to the right and three units to the left.
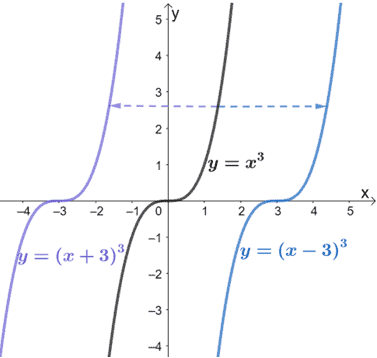
When we translate a graph three units to the right, we subtract 3 from the input variable, x. Similarly, we add 3 to x when we translate three units to the left.
The table below generalizes horizontal transformations for all types of function f(x).
Translate f(x) h units to the right | f(x + h) , when h > 0 |
Translate f(x) h units to the left | f(x – h) , when h > 0 |
Vertical transformation or translation on a function
Now, what happens if we translate three units upward or downwards instead? We call this vertical transformation. This type of transformation also retains the shape of the graph but shifts it either upward or downward.
Let’s what happens if we shift y = x2 two units upward and downward.
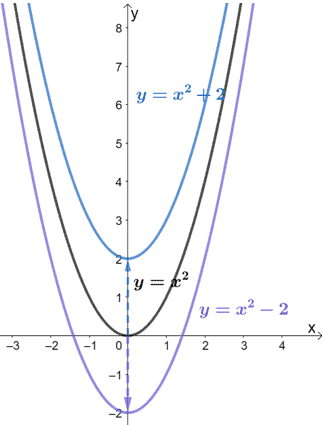
When we translate a graph two units downward, we subtract 2 from the output value, y. Similarly, we add 2 to y when we translate it two units to the upward.
The table below generalizes vertical transformations for all types of function f(x).
Translate f(x) k units upward | f(x) + k, when k > 0 |
Translate f(x) k units downward | f(x) – k, when k > 0 |
We’ve now learned the general rules for horizontal and vertical transformations, so how do we apply these when we graph functions?
How to graph transformations?
When working with functions resulting from multiple transformations, we always go back to the function’s parent function. Below are some important pointers to remember when graphing transformations:
- Identify the transformations performed on the parent function.
- Graph the parent function as a guide (this is optional).
- Perform each transformation on the graph until we complete all the identified transformations.
Why don’t we start graphing f(x) = (x + 1)2 – 3 by first identifying its transformations?
Since the graph is a quadratic function, we start with the parent function y = x2.
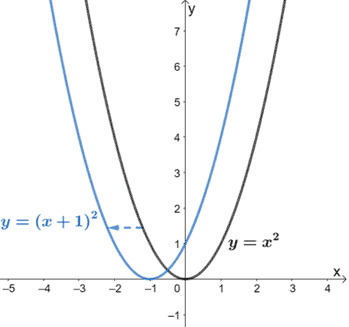
The first terms, (x + 1)2, show that the function y = x2 is translated 1 unit to the left.
The last term, -3, indicates that the resulting function is translated 3 units downward.
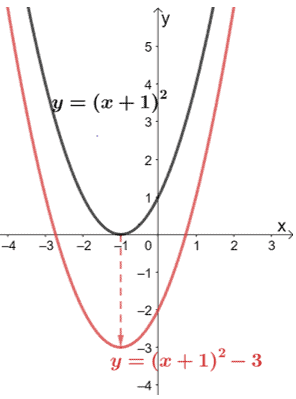
This means that final graph for the function f(x) = (x + 1)2 – 3 is as shown by the red graph. As you can see, just by shifting the graphs vertically and horizontally, we can already modify them to represent a different function.
We’ll now try different questions that involve horizontal and vertical translations in the examples shown below.
Example 1
What happens when f(x) = x3 is translated 4 units to the right and 2 units downward?
Solution
Refer to the two tables that summarize the vertical and horizontal transformations as shown from the previous sections.
If we want to translate the cubic function, f(x) = x3, 4 units to the right, we add 4 to the input value, x. Hence, we have (x + 4)3.
Since we still need to translate 2 units downward, let’s subtract two units from the resulting function. The resulting function now becomes (x + 4)3 – 2.
Example 2
The table of values for f(x) and g(x) are as shown below.
x | -4 | -2 | 0 | 2 | 4 |
f(x) | 16 | 4 | 0 | 4 | 16 |
x | -4 | -2 | 0 | 2 | 4 |
g(x) | 19 | 7 | 3 | 7 | 19 |
Use the information above and select which of the following best describes g(x) in terms of f(x).
- The function g(x) is the result when f(x) is translated 3 units upward.
- The function g(x) is the result when f(x) is translated 3 units downward.
- The function g(x) is the result when f(x) is translated 3 units to the right.
- The function g(x) is the result when f(x) is translated 3 units to the left.
Solution
Observe how for each output value, g(x) is always 3 units greater than f(x). This means that g(x) = f(x) + 3. Remember that for f(x) + k, we translate k units upward.
We have k = 3, so we can have g(x) when we translate f(x) 3 units upward.
Example 3
The graphs of y = √x, g(x), and h(x) are shown below.
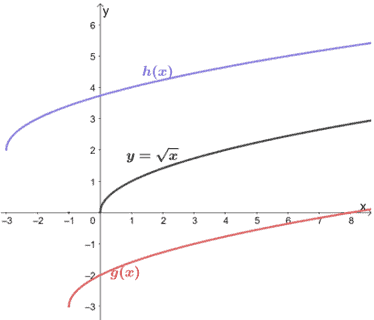
Describe the transformations done on each function and find their algebraic expressions as well.
Solution
Find the horizontal and vertical transformations done on the two functions using their shared parent function, y = √x.
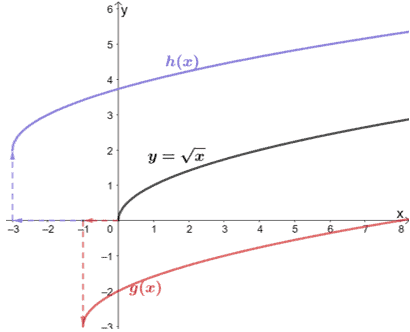
From the graph, we can see that g(x) is equivalent to y = √x but translated 3 units to the right and 2 units upward. From this, we can construct the expression for h(x):
- The function y = √x is translated 3 units to the left, so we have h(x) = √(x + 3).
- Since we also need to translate the resulting function 2 units upward, we have h(x) = √(x+3) + 2.
We can apply the same process for g(x). The g(x) graph is equivalent to y = √x being translated one unit to the right and 3 units downward. From this, we can find the expression for g(x):
- The function y = √x is translated 1 unit to the left, so we have g(x) = √(x + 1).
- Since we also need to translate the resulting function 3 units downward, we have g(x) = √(x+1) – 3.
Example 4
The function g(x) can be attained by translating y = 3x by 3 units to the left and 2 units upward. Find the expression for g(x) and graph the resulting function.
Solution
When we translate y = 3x by three units to the left, we subtract 3 from the input value or x. Hence, we have y = 3(x – 3). We still need to translate it 2 units upward, hence, we have g(x) = 3(x – 3) + 2.
We know how the parent function y = 3x looks like. Let’s use its graph and translate the graph vertically and horizontally.
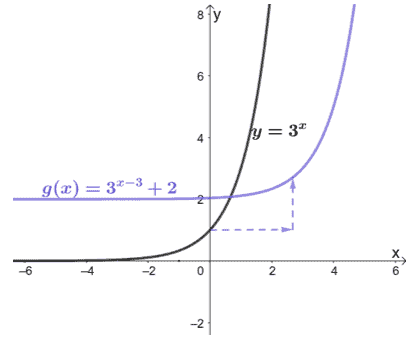
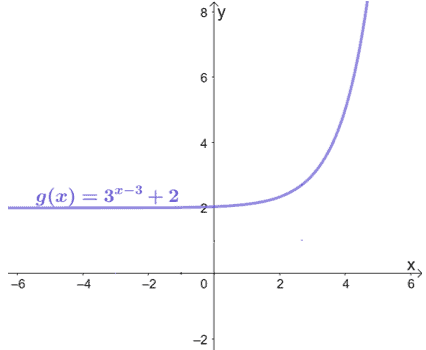
Hence, we have the final graph shown below.
Example 5
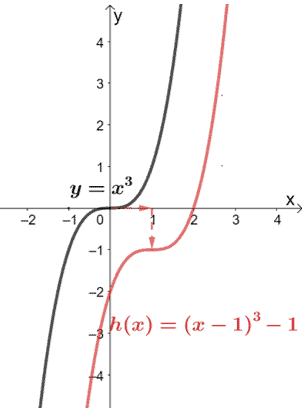
Describe the translations applied on y = x3 to attain the function h(x) = (x – 1)3 – 1. Use the transformations to graph h(x) as well.
Solution
Let’s break down h(x) first: h(x) = (x – 1)3 – 1. Hence, we need to translate x3 one unit to the right and one unit downward. Let’s go ahead and graph x3 first. We then apply the transformations.
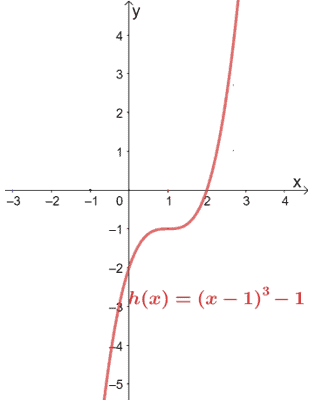
Let’s go ahead and remove the parent function to show h(x) by itself.
Practice Questions
Images/mathematical drawings are created with GeoGebra.