JUMP TO TOPIC
Rational function – Properties, Graphs, and Applications
 We’ll be encountering rational functions in our Algebra classes. From the word “ratio,” these functions are unique as they represent ratios of two polynomials.
Rational functions are functions that contain polynomials for both their numerator and denominator.
These were also some of the most commonly used functions when we learned about asymptotes – which we’ll soon learn why. Problems related to motions, rate, and work may sometimes make use of rational functions to model unique situations.
Learning how to graph rational functions can also help us apply our previous knowledge to different math concepts such as asymptotes, holes, and limits.
With its extensive use, we must learn about rational functions – starting from its definition.
What is a rational function?
As we have mentioned, rational functions are formed by dividing two polynomials from each other. By the end of this section, we’ll understand why the function shown below is a rational function.
$f(x) = \dfrac{a_nx^n + a_{n-1}x^{n-1}+…+a_o}{ b_nx^n + b_{n-1}x^{n-1}+…+b_o }$
Why don’t we go ahead and learn more about rational functions and list down some examples of rational functions?
Rational function definition and examples
Given that $p(x)$ and $q(x)$ are two polynomials, we can form a rational function, $f(x)$, that is equal to $\dfrac{p(x}{q(x)}$.
For the function to be valid, $q(x)$ must not be equal to $0$. Below are some examples of rational functions:
- $f(x) = \dfrac{x^2-1}{2x + 1}$
- $g(x) = \dfrac{x^2 – 3x + 2}{x^2 – 4}$
- $h(x) = \dfrac{(x + 1)^3}{x + 5}$
From the examples, we can see that as long as both the numerator and denominator are both polynomial expressions, the function is a rational function.
This means that if both $p(x)$ and $q(x)$ are polynomials, we can each express them as $ p(x) = a_nx^n + a_{n-1}x^{n-1}+…+a_o$ and $ q(x) = b_mx^m + b_{m-1}x^{m-1}+…+b_o$.
Reviewing our knowledge on polynomial functions and expressions, for these to expressions to be valid, $\{a_n, a_{n-1}, … a_o\}$ and $\{b_m, b_{m-1}, … b_o\}$ must be real numbers. In addition, $n$ and $m$ must be positive exponents.
This means that all reciprocal functions are rational functions.
How to solve rational functions?
What happens when we’re given the rational function? Can we also find the values returned by rational functions and find their zeros?
- Finding the output values given a list of $x$-values will help us find key points in graphing the rational function.
- We might need to evaluate rational functions as well when solving problems that involve rational functions.
- Finding the zeros of rational functions can help us in finding their $x$-intercepts.
Let’s start by reviewing what we know about evaluating rational functions.
How to evaluate rational functions?
We can evaluate rational functions the same way we do with other functions – substitute the value of $x$ into the function. Let’s say we have $f(x) = \dfrac{2x-1}{x^2 + 2}$ and we want to find out what $f(5)$?
Substitute $x=5$ into the expression:
$\begin{aligned}f(5)&=\dfrac{2(5)-1}{(5)^2 + 2}\\&=\frac{10-1}{25+2}\\&=\frac{9}{27}\\&=\frac{1}{3} \end{aligned}$
Make sure to express the evaluated values in lowest terms whenever possible.
When evaluating the value of the function at $x=0$, the trick is to retain the constants in the numerator and denominator to find $f(0)$.
This mean that for our example, $f(0)=\dfrac{-1}{2}=-\dfrac{1}{2}$. This also represents the $y$-intercept of the function: $\left(0, -\dfrac{1}{2}\right)$.
How to find the zeros of rational functions?
We’ve already learned about finding the zeros of different functions in the past. Here’s an article that can help you review this concept.
As a refresher, rational functions’ denominator can never be equal to zero ($q(x) \neq 0$). This means that to find a rational function’s zeros, we equate the numerator ($p(x)$) to $0$ and solve for $x$.
This means that for us to find the zero of $f(x) = \dfrac{2x-1}{x^2 + 2}$, we equate the numerator to $0$ then solve for $x$.
$\begin{aligned}2x-1&=0\\2x&=1\\x&=\dfrac{1}{2} \end{aligned}$
Zeros also represent the $x$-intercepts, so the $x$-intercept of $f(x)$ is $\left(\dfrac{1}{2}, 0\right)$.
How to solve rational equations?
We sometimes need to find the intersections between two functions where one is a rational function. When this happens, we equate both functions and find the value of $x$ that satisfies the equation.
- Multiply both sides of the equation by the least common denominator.
- Simplify the equation so that it reduces to a polynomial equation.
- Apply the appropriate techniques we’ve learned when solving polynomial equations, as discussed here.
Given $g(x) = x – 1$ and $h(x) = \dfrac{2x + 1}{x + 1}$, equate both functions if we want to find the value of $x$ when $g(x) = h(x)$.
$ \begin{aligned}x – 1 &= \dfrac{2x- 2}{x + 1}\\(x – 1)\cdot (x + 1) &= \dfrac{2x – 2}{x + 1}\cdot(x+1)\\x^2 – 1& = 2x – 2\\x^2-2x+1&=0\\(x+1)^2&=0\\x&=-1\end{aligned}$
See how the equation was reduced to a quadratic equation? Once you have an equation that is easier to manipulate, this leads to us being able to apply techniques we’ve learned in the past.
How to graph rational functions?
If the given rational function is a reciprocal function, follow the steps in graphing reciprocal functions by transformations. Need a refresher? No worries, check out this article on reciprocal functions.
To graph a rational function, $f(x) = \dfrac{p(x)}{q(x)}$, we need find these important elements:
- Check if the rational functions have holes. Make sure to plot these as unfilled dots.
- Inspect the function for any possible vertical asymptotes.
- Take note of any horizontal or oblique asymptotes of the rational function as well.
- Find the $x$ and $y$-intercepts of the function, then plot these on the $xy$-plane.
- Find the intersection of the function and the horizontal or oblique asymptote.
- Predict the functions’ end behaviors by checking the values of $f(x)$ in between the different intervals formed by the $x$-intercepts and vertical asymptotes.
- Graph the curves in between the asymptotes.
Let’s try to graph $f(x) = \dfrac{x^2 – 5x + 6x}{x^3 – 9x}$ as we try to refresh each concept and master the steps when graphing rational functions.
Important properties and elements of a rational function’s graph
Plot the holes of the rational function
Recall that holes exist in rational functions when the expression‘s numerator and denominator share a common factor. Find the hole’s $\boldsymbol{x}$-coordinate by equating this factor to $\boldsymbol{0}$.
Factoring $f(x)$, we have $f(x) = \dfrac{(x – 2)(x – 3)}{x(x – 3)(x + 3)}$. Since $(x-3)$ is a common factor, $f(x)$ has hole at $x-3=0$ or $x = 3$.
Substitute this value back into the simplified form of $\boldsymbol{f(x)}$ to find the $\boldsymbol{y}$-coordinate of the hole.
$\begin{aligned}f(x)&=\dfrac{(x-2)\cancel{(x-3)}}{x\cancel{(x-3)}(x+3)}\\&=\dfrac{x-2}{x(x+3)}\\\\f(3)&=\dfrac{3-2}{3(3+3)}\\&=\dfrac{1}{18}\end{aligned}$
This means that $f(x)$ has a hole at $\left(3, \dfrac{1}{8} \right)$.
Finding the asymptotes
Let’s refresh what we have learned so far about the three types of asymptotes in the context of rational functions. Using the general form as shown below:
$f(x) = \dfrac{a_nx^n + a_{n-1}x^{n-1}+…+a_o}{ b_mx^m + b_{m-1}x^{m-1}+…+b_o }$
- Set the denominator to $0$ to find a vertical asymptote.
- If the degree of the number is less than that of the denominator ($n < m$), $f(x)$ has a horizontal asymptote of $y = 0$.
- If the numerator and denominator’s degrees are equal ($n = m$), they have a horizontal asymptote at $y = \dfrac{a_n}{b_m}$.
- If the degree of the number is greater than that of the denominator ($n > m$), $f(x)$ has no horizontal asymptote but has an oblique asymptote instead. Recall that can determine its equation by finding the quotient of the function.
Applying these to the simplified form of the function, $f(x) = \dfrac{x-2}{x(x+3)}$, we have the following results:
| Vertical Asymptote | Equate the denominator to $0$ then solve for $x$: $ \begin{aligned}x(x + 3)&=0\\x & =0\\x&=-3 \end{aligned}$ |
| Horizontal Asymptote | Since the degree of the numerator is less than the denominator ( $2 < 3$), the horizontal asymptote is $y = 0$. |
| Oblique Asymptote | If the function has a horizontal asymptote, it can’t have an oblique asymptote. |
Finding the intercepts
Find the $x$ and $y$-intercepts of $f(x)$ by setting $y$ to $0$ and $x$ to $0$, respectively. Hence, we have the following intercepts for our given function:
| $\boldsymbol{y}$-intercept | $f(0) = \dfrac{0}{0}$ The function has no $y$-intercept. |
| $\boldsymbol{x}$-intercept | $ \begin{aligned} \dfrac{x-2}{x(x+3)} & = 0\\ x – 2&=0 \\x&=2\end{aligned}$ This means that $f(x)$ has an $x$-intercept at $(2, 0)$. |
Finding the intersection between the function and the asymptote
Find the point where the function intersects with either the horizontal or oblique asymptotes. Equate the equation of the asymptote to the function and solve for $x$.
Let’s equate $f(x) = \dfrac{(x – 2)(x – 3)}{x(x – 3)(x + 3)}$ to $y = 0$.
$\begin{aligned}\dfrac{(x-2)(x-3)}{x(x-3)(x+3)}&=0\\\dfrac{x-2}{x(x+3)}&=0\\x-2&=0\\x&=2\end{aligned}$
Since $x=2$ when $y=0$, the function intersects the asymptote at $(2,0)$.
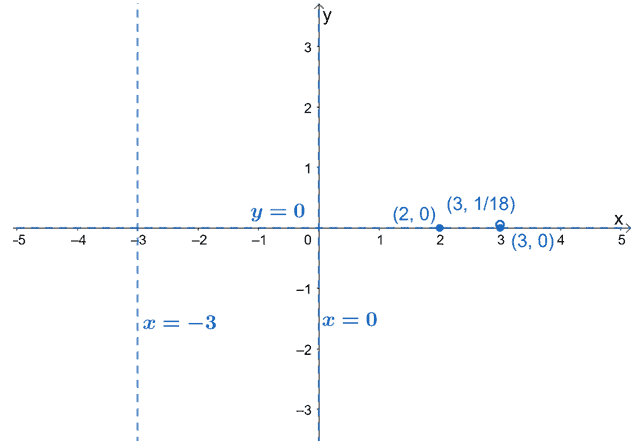
Now that we have these important elements graph the important points and asymptotes on the graph.
- Plot dashed lines to represent the vertical and horizontal asymptotes.
- Plot the point where the horizontal asymptote intersects with the function.
- Plot the hole of the function (if any).
- Include the $x$ and $y$-intercepts.
So, what are the next steps for us? It’s time to predict the behavior of the curve for each interval. This will help us know how the graphs between each interval would behave.
Predicting and graphing the rational functions’ curves
We can predict the behavior of a rational function’s curves by checking the values of $f(x)$ at different intervals.
- Use the values of $x$ at its vertical asymptotes and holes.
- Divide the domain of the $f(x)$ based on the values of $x$.
- Find a value of $x$ that is within each interval and observe the signs of the $f(x)$ for each test value.
- If the value of $f(x)$ is negative, the curve lies below the $x$-axis. Similarly, if $f(x)$ is positive, the curve lies above the $x$-axis for that interval.
- Use the resulting points as an additional guide in graphing the curve of $f(x)$.
Let’s apply this technique in predicting the behavior of the graph of $f(x) = \dfrac{(x-2)(x-3)}{x(x-3)(x+3)}$.
Making Use of Test Values
Break down the domain of $f(x)$ into: $(-\infty, -3)$, $(-3, 0)$, $(0,\infty)$. Use a table to organize your results:
| Interval | Test Value | Value of $\boldsymbol{f(x)}$. | $\boldsymbol{f(x)}$’s sign | Position of Curve in the Axis |
| $(-\infty, -3)$ | $-4$ | $-\dfrac{3}{2}$ | Negative | Below |
| $(-3, 0)$ | $-1$ | $\dfrac{3}{2}$ | Positive | Above |
| $(0, \infty)$ | $1$ | $-\dfrac{1}{4}$ | Negative | Below |
Plot these points on the graph to also guide us when graphing the curve of $f(x)$.
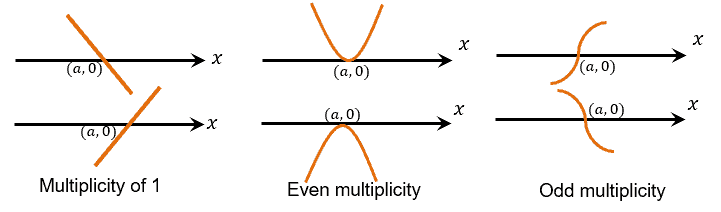
Using the asymptote’s degree to predict the curve’s shape
Aside from knowing the positions of the curve at different intervals, the function’s highest degree can also help us predict the curve’s shape.
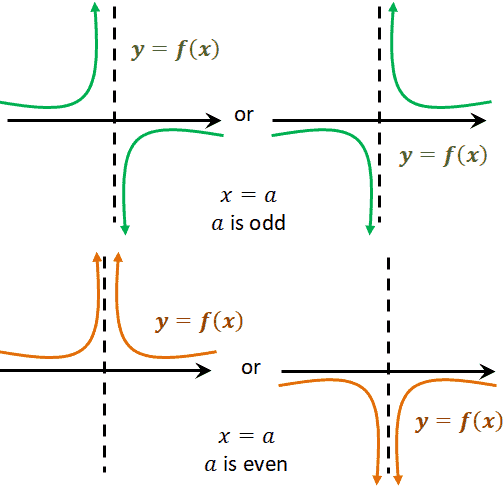
As can be seen from the guide shown above, when the factor containing the vertical asymptote, $x=a$, has an odd degree, the curve may have a shape similar to the one shown in green.
Similarly, when the degree is even, the function’s curve near the given asymptote will be similar to the curves shown in orange.
Now that we know what to expect of the curves between the intervals and how the curve behaves near the vertical asymptotes, we can graph the curves of the function.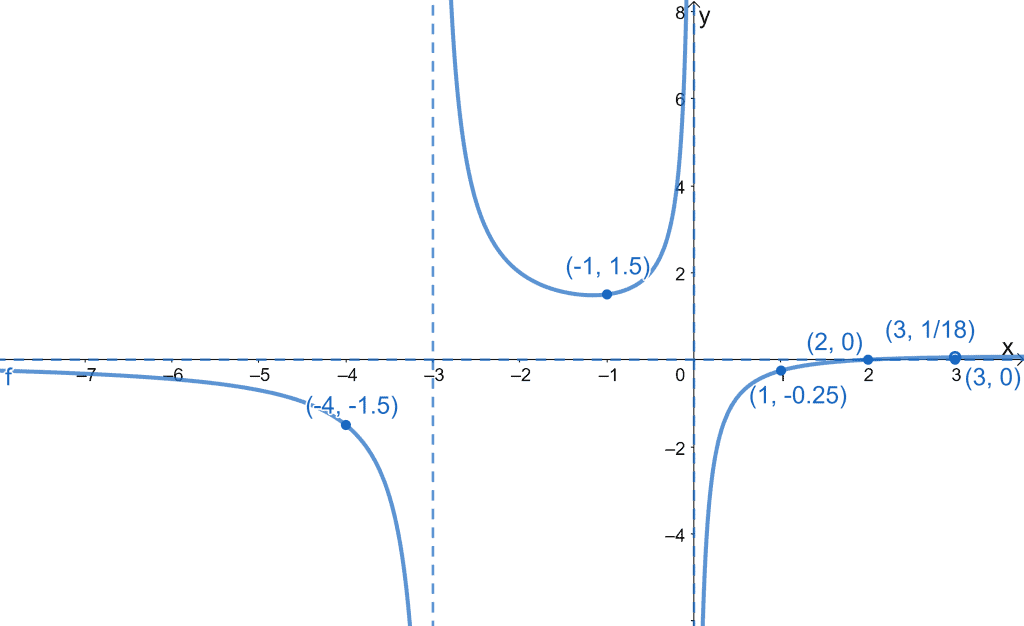
We can finalize how the curve looks by taking out the guide points and only leaving out the hole of $f(x)$ and its asymptotes.
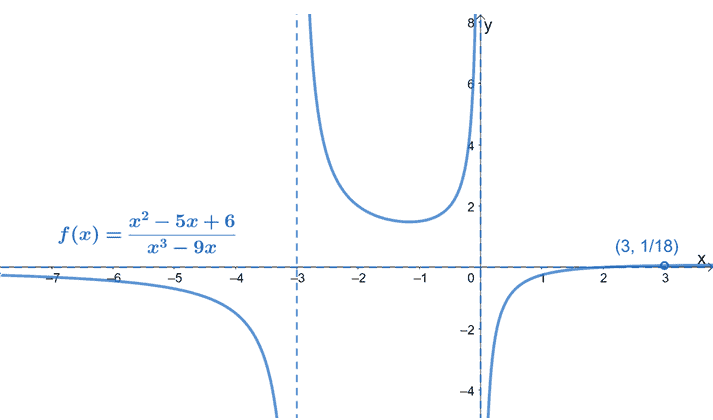
This step is optional, but this returns a cleaner visual of the graph of $f(x)$. Are you ready to graph more functions? Don’t worry. We’ve prepared a lot of examples and cases for you. For now, let’s see how we can use rational functions in real-world applications.
How to solve problems involving rational functions?
We’ve now extensively discussed the elements and properties of a rational function’s graph. Now, how do we apply these when given word problems?
Some common problems involve concentrations, rates, and ratios of different quantities.
Here are some important pointers when dealing with problems that involve rational expressions and functions:
- Since rational functions represent ratios of two polynomials, most problems will involve the ratio or quotient of two or more objects.
- Begin by expressing each group of objects or quantities as a polynomial function.
- Express the final function using an appropriate rational function.
- Make use of the different properties we’ve learned about rational functions to answer the problem.
Let’s apply what we’ve learned so far with the examples that follow. We’ll also try out other rational functions and see if we can graph these too!
Example 1
Fill in each blank with the correct words or phrases to make the following statements true.
a. Given that $f(x) = \dfrac{m(x)}{n(x)}$, the expressions $m(x)$ and $n(x)$ must be ________________ functions and ________ must not be equal to zero.
b. If the degree of the numerator is _________ than the denominator, the rational function will have an oblique asymptote.
c. If a rational function has vertical asymptotes of $x = -2$ and $x = 3$, its domain is __________________.
Solution
When working with questions like this, it will help you go back to your notes for this section. Review your knowledge on the definition of rational functions, oblique asymptote, and domain of rational functions.
a. Rational functions have polynomial functions found on its numerator and denominator, so $m(x)$ and $n(x)$ are both polynomial functions, where $\boldsymbol{n(x)}$ is not zero.
b. For a rational function to have an oblique asymptote, the numerator’s degree must be greater than that of the denominator.
c. The domain of rational functions can be determined by excluding the restricted values for $x$. This means that the function has a domain of all real numbers except for $\boldsymbol{-2}$ and $\boldsymbol{3}$ or $\boldsymbol{ (-\infty, -2) \cup (-2, 3) \cup (3, \infty)}$.
Example 2
Complete the table below by finding the $x$ and $y$-intercepts of the following rational functions.
| Function | $\boldsymbol{x}$-intercept | $\boldsymbol{y}$-intercept |
| $f(x) = \dfrac{x + 1}{2x + 5}$ | ||
| $g(x) = \dfrac{x^2 – 4}{3x – 6}$ | ||
| $h(x) = \dfrac{x^4 – 4x^2 + 4}{3x^6 – 3}$ |
Solution
Recall that the intercepts of the rational functions can be determined by:
- Setting $x$ to $0$ to find the $y$-intercept.
- Equating the function to $0$ to find the $x$-intercept$.
Let’s start with the first row:
| $\boldsymbol{x}$-intercept | $\boldsymbol{y}$-intercept |
| $\begin{aligned}x + 1 &=0 \\x&= -1\end{aligned}$ | $\begin{aligned}f(0) &= \dfrac{0+1}{2(0)+5}\\&=\dfrac{1}{5} \end{aligned}$ |
This means that $f(x)$ has an $x$-intercept of $(-1, 0)$ and a $y$-intercept of $\left( 0, \dfrac{1}{5}\right)$.
Apply the same process for $g(x)$ and $h(x)$. Apply the appropriate techniques in solving the resulting equations.
| $\boldsymbol{x}$-intercept | $\boldsymbol{y}$-intercept |
| $\begin{aligned} x^2 – 4 &= 0 \\ (x – 2)(x + 2) &= 0\\\\ x&=2\\x&=-2\end{aligned}$ | $\begin{aligned}f(0) &= \dfrac{(0)^2-4}{3(0) – 6}\\&=\dfrac{-4}{-6}\\ &= \dfrac{2}{3} \end{aligned}$ |
Hence, $g(x)$ has an $x$-intercept of $(-2, 0)$ and $(2, 0)$. It also has a $y$-intercept of $\left( 0, \dfrac{2}{3}\right)$.
| $\boldsymbol{x}$-intercept | $\boldsymbol{y}$-intercept |
| $\begin{aligned} x^4 – 4x^2 + 4 &= 0 \\ (x^2 – 2)(x^2 + 2) &= 0\\x^2 & = 2\\\\x &= -\sqrt{2}\\x&=\sqrt{2}\end{aligned}$ | $\begin{aligned}f(0) &= \dfrac{(0)^4-4(0)^2 + 4}{3(0)^6 – 3}\\&=\dfrac{4}{-3}\\ &= -\dfrac{4}{3} \end{aligned}$ |
Notice that we didn’t use $x^2 + 2$ at the later part of the steps? That’s because $x^2 + 2 = 0$ will return imaginary roots.
That’s why we have $(-\sqrt{2}, 0)$ and $(\sqrt{2}, 0)$ as the only $x$-intercepts of $h(x)$ and $\left(0, -\dfrac{4}{3}\right)$ as the $y$-intercept of $h(x)$.
Now that we have all the intercepts let’s fill in the given table with our answers.
| Function | $\boldsymbol{x}$-intercept | $\boldsymbol{y}$-intercept |
| $f(x) = \dfrac{x + 1}{2x + 5}$ | $(-1, 0)$ | $\left( 0, \dfrac{1}{5}\right)$ |
| $g(x) = \dfrac{x^2 – 4}{3x – 6}$ | $(-2, 0)$ , $(2, 0)$ | $\left( 0, \dfrac{2}{3}\right)$ |
| $h(x) = \dfrac{x^4 – 4x^2 + 4}{3x^6 – 3}$ | $(-\sqrt{2}, 0)$ , $(\sqrt{2}, 0)$ | $\left(0, -\dfrac{4}{3}\right)$ |
Example 3
Identify the asymptotes present in the following rational functions.
a. $f(x) = \dfrac{-8}{x – 7}$
b. $f(x) = \dfrac{x^2 – 9}{x^2 – 1}$
c. $f(x) = \dfrac{x^2 – 5x + 4}{x – 2}$
Solution
We can begin by finding the vertical asymptotes for each function. We can do this by finding the restrictions of $x$ in the denominator.
| $\boldsymbol{f(x) = \dfrac{-8}{x – 7}}$ | $\boldsymbol{ f(x) = \dfrac{x^2 – 9}{x^2 – 1}}$ | $\boldsymbol{ f(x) = \dfrac{x^2 – 5x + 4}{x – 2}}$ |
| $\begin{aligned} x – 7 &= 0\\ x&=7 \end{aligned}$ | $\begin{aligned} x^2 – 1 &= 0\\ (x – 1)(x + 1) &=0\\\\x&=1\\x&=-1 \end{aligned}$ | $\begin{aligned} x – 2 &= 0\\x&=2 \end{aligned}$ |
Remember that a function may either have a horizontal asymptote or an oblique asymptote, but never both.
- For $ f(x) = \dfrac{-8}{x – 7}$, since the degree of the numerator is less than the degree of the denominator, it has a horizontal asymptote of $\boldsymbol{y=0}$.
- The numerator and denominator’s degrees are equal for $ f(x) = \dfrac{x^2 – 9}{x^2 – 1}$, so it has a horizontal asymptote equal to the ratio of their leading coefficients, $\boldsymbol{y=1}$.
- In $f(x) = \dfrac{x^2 – 5x + 4}{x – 2}$, the numerator has a higher degree that its denominator, so we’re expecting $f(x)$ to have an oblique asymptote. Divide the numerator by the denominator and the resulting quotient returns the oblique asymptote’s equation.
$\dfrac{x^2 – 5x + 4}{x – 2} = \boldsymbol{x – 3} + \dfrac{-2}{x – 2}$
Let’s go ahead and summarize the asymptotes found on each of the given functions:
a. $f(x) = \dfrac{-8}{x – 7}$
- Vertical asymptote: $x = 7$.
- Horizontal asymptote: $y = 0$.
b. $f(x) = \dfrac{x^2 – 9}{x^2 – 1}$
- Vertical asymptote: $x = -1$ and $x = 1$.
- Horizontal asymptote: $y = 1$.
c. $f(x) = \dfrac{x^2 – 5x + 4}{x – 2}$
- Vertical asymptote: $x = 2$.
- Oblique asymptote: $y = x – 3$.
Example 4
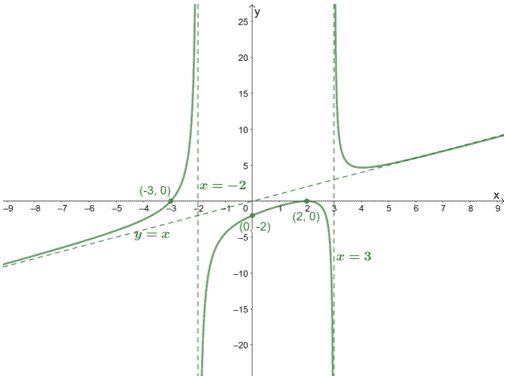
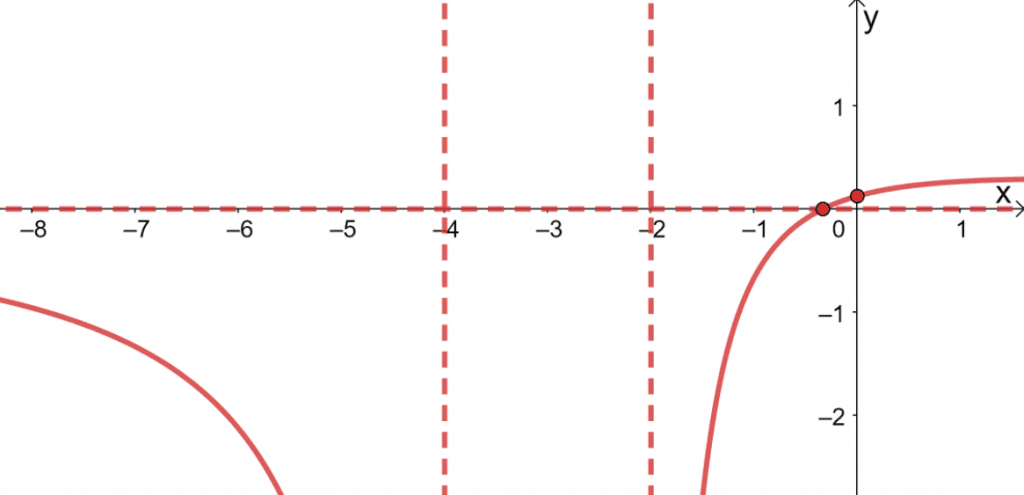
Find a rational function that may represent the given graph shown below.
Solution
We can find one function that can represent this graph by taking note of the following:
- The vertical asymptotes of $f(x)$.
- The $x$ and $y$-intercepts.
- Find the other asymptotes to confirm if the function we have derived has the right degree.
We can see that the graph has $x$-intercepts at $(2,0)$ and $(-3, 0)$. To determine its multiplicity, let’s refresh our knowledge on zero multiplicities from our article on polynomial functions.
Seeing that the curve passes through $(-3, 0)$ once, the factor $(x + 3)$ can only have a multiplicity of 1.
Seeing the behavior of the curve of the graph at $(2, 0)$, we can see that the factor has an even multiplicity at $(x – 2)$, so it can be $(x – 2)^2$.
If we want to find the rational function, $f(x) = \dfrac{p(x)}{q(x)}$, these factors from the $x$-intercepts will represent the expression for $p(x)$. Hence, our tentative $p(x)$ is $(x + 1)(x – 2)^2$.
Focusing on the asymptotes, we can see that the function has vertical asymptotes at $x = -2$ and $x = 3$, the rational function has a denominator that contains $(x + 2)$ and $(x – 3)$ in its denominator. This means that the denominator, $q(x)$, is $(x + 2)(x – 3)$.
We now have $f(x) = \dfrac{(x + 3)(x – 2)^2}{(x + 2)(x – 3)}$. Let’s check if this function does represent this graph by confirming whether the $y$-intercept is equal to $(0, -2)$.
$ \begin{aligned}f(0)&=\dfrac{(0 + 3)(0 – 2)^2}{(0 + 2)(0 – 3)}\\&=\dfrac{12}{-6}\\&=-2\end{aligned}$
This confirms that our proposed function also passes through the $y$-intercept of the graph. Hence, the graph can be represented by the function $\boldsymbol{f(x) = \dfrac{(x + 3)(x – 2)^2}{(x + 2)(x – 3)}}$.
Example 5
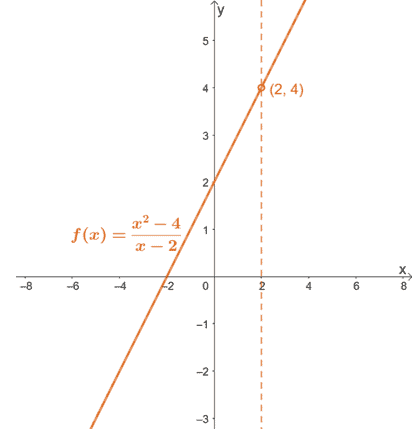
Analyze and graph the function, $f(x) = \dfrac{x^2 – 4}{x – 2}$.
Solution
Let’s go ahead and see if $f(x)$ is in its lowest term by factoring in the numerator.
$ \begin{aligned}f(x)&=\dfrac{x^2 – 4}{x – 2}\\ &= \dfrac{(x – 2)(x + 2)}{x – 2}\end{aligned}$
We can see that $(x – 2)$ is a common factor shared by the numerator and denominator, so there’s a hole at $\boldsymbol{x = 2}$. Find the $y$-coordinate of the hole by substituting $x=2$ into the simplified expression for $f(x)$.
$ \begin{aligned}f(x)&= \dfrac{\cancel{(x – 2)}(x + 2)}{\cancel{x – 2}}\\&=x + 2\end{aligned}$
This means that the hole’s $y$-coordinate is $f(2) = 4$, so the hole is found at $\boldsymbol{(2, 4)}$.
Find the $x$ and $y$-intercepts of $f(x)$:
| $\boldsymbol{x}$-intercept | $\begin{aligned}x + 2 &= 0\\ x&=-2\\x_\text{int}&=(-2,0)\end{aligned}$ |
| $\boldsymbol{y}$-intercept | $\begin{aligned}f(x)&= x + 2 \\ f(0)&= 0 + 2\\&= 2\\y_\text{int}&=(0,2)\end{aligned}$ |
Inspect the function for asymptotes.
- Find the vertical asymptote by equating the denominator to $0$ and solving for $x$.
- Since the numerator’s degree is greater than that of the denominator, we’re expecting an oblique asymptote.
| Vertical Asymptote | $\begin{aligned}x – 2 &= 0\\ x&=2\end{aligned}$ |
| Oblique Asymptote | $\begin{aligned}f(x)&= \dfrac{x^2 – 4}{x – 2}\\&= \boldsymbol{x – 2} + \dfrac{0}{x – 2}\\y&=x – 2\end{aligned}$ |
Since the vertical asymptote is $x = 2$, the function has a domain of $\boldsymbol{(-\infty, 2) \cup (2, \infty)}$.
The graph has been reduced to a linear expression to graph the curve along with the hole, intercepts, and asymptotes right away.
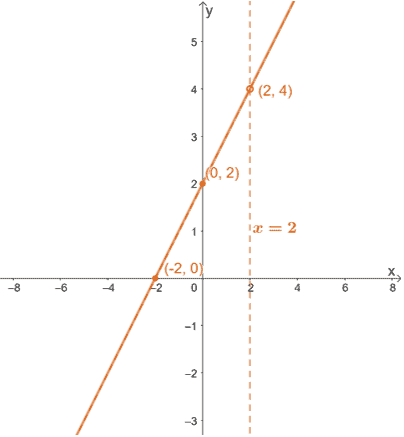
Here’s the graph of $f(x)$, and we can see that the function has reduced to a linear function. When the graph reduces to a function we’re familiar with; there is no need to predict the end behaviors.
Here’s a summary of what we know about $f(x)$ and its graph:
- The function $f(x)$ has an $x$-intercept of $(-2, 0)$ and a $y$-intercept of $(0, 2)$.
- The function has a vertical asymptote of $x = 2$ and an oblique asymptote at $y = x + 2$.
- This means that it has a domain of $\boldsymbol{(-\infty, 2) \cup (2, \infty)}$.
- The function has a hole at $(2, 4)$, and this is also the point of intersection shared between the vertical and oblique asymptotes.
Here’s the final graph for $ f(x) = \dfrac{x^2 – 4}{x – 2}$.
Example 6
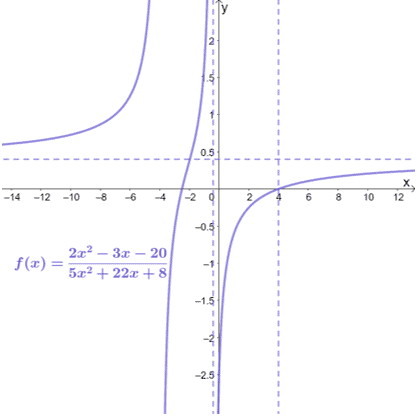
Analyze and graph the function, $f(x) = \dfrac{2x^2 – 3x – 20}{5x^2 + 22x +8}$.
Solution
Express both the numerator and the denominator in factored form.
$ \begin{aligned}f(x)&= \dfrac{2x^2 – 3x – 20}{5x^2 + 22x +8}\\&= \dfrac{(2x + 5)(x – 4)}{(5x + 2)(x + 4)}\end{aligned}$
This confirms that $f(x)$ is in its simplest form, so the function’s graph has no hole.
Identify the function’s $x$ and $y$-intercepts.
| $\boldsymbol{x}$-intercept | $\begin{aligned} (2x + 5)(x – 4) &= 0\\ x&=-\dfrac{5}{2}\\x&=4\\x_\text{int}&=\left(-\dfrac{5}{2}, 0\right), (4,0)\end{aligned}$ |
| $\boldsymbol{y}$-intercept | $\begin{aligned}f(x)&= \dfrac{(2x + 5)(x – 4)}{(5x + 2)(x + 4)}\\f(0) &= \dfrac{(0 + 5)(0 – 4)}{(0 +2)(0 +4}\\&=\dfrac{-20}{8}\\&=-\dfrac{5}{2}\\y_\text{int}&=\left(0,-\dfrac{5}{2}\right)\end{aligned}$ |
Find the asymptotes of $f(x)$.
- Equate the denominator to $0$ and solve for $x$ to find the vertical asymptotes.
- Since the degree of the numerator equal to the denominator, it has a horizontal asymptote by dividing the numerator and denominator’s leading coefficients.
| Vertical Asymptote | $\begin{aligned}(5x + 2)(x + 4) &= 0 \\x&=-\dfrac{5}{2}\\x&=-4\end{aligned}$ |
| Horizontal Asymptote | $\begin{aligned}y&=\dfrac{2}{5}\end{aligned}$ |
Since the vertical asymptote is $x = 2$, the function has a domain of $\boldsymbol{(-\infty, -4) \cup (-4, -\dfrac{5}{2}) \cup (-\dfrac{5}{2}, \infty)}$.
Find the intersection shared between the function and the horizontal asymptote by equating $f(x)$ and $y = \dfrac{2}{5}$.
$\begin{aligned}\dfrac{2x^2 – 3x – 20}{5x^2 + 22x +8}&=\dfrac{2}{5}\\5(2x^2-3x-20)&=2(5x^2 + 22x + 8)\\10x^2 – 15x -100&=10x^2 + 44x + 16\\-59x &= 116\\x&=-\dfrac{116}{59}\end{aligned}$
This means that the graph and the horizontal asymptote intersects at the point $\boldsymbol{\left(-\dfrac{116}{59}, \dfrac{2}{5}\right)}$.
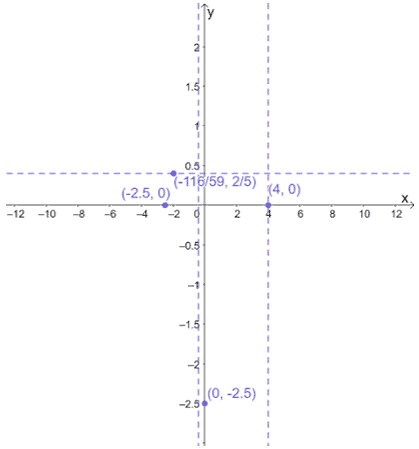
Before predicting the curve’s behavior at different intervals, plot the asymptotes, holes, and intercepts first.
Use the vertical asymptotes and intercept to divide the domain of $x$. Use test values to predict the positions of the curve at different intervals.
| Interval | Test Value | Value of $\boldsymbol{f(x)}$. | $\boldsymbol{f(x)}$’s sign | Position of Curve in the Axis |
| $\left(-\infty, -\dfrac{5}{2}\right)$ | $-6$ | $\dfrac{5}{4}$ | Positive | Above |
| $\left(-\dfrac{5}{2}, -\dfrac{2}{5}\right)$ | $-1$ | $\dfrac{5}{3}$ | Positive | Above |
| $\left(-\dfrac{2}{5}, 4\right)$ | $2$ | $-\dfrac{1}{4}$ | Negative | Below |
| $(4, \infty)$ | $8$ | $\dfrac{1}{6}$ | Positive | Above |
Plot the test values and the resulting value of $f(x)$ and apply the curves’ positions using the information from the table shown above.
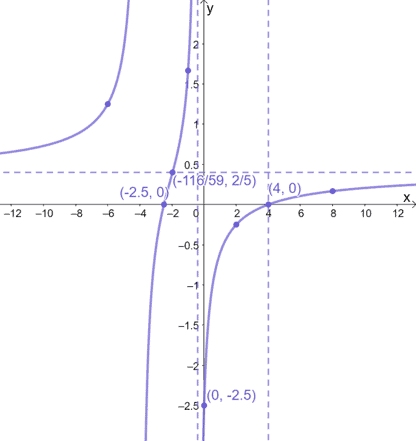
Summarize all the properties about $f(x)$ and let’s finalize the graph of $f(x) = \dfrac{2x^2 – 3x – 20}{5x^2 + 22x +8}$.
- The function $f(x)$ has $x$-intercepts of $(-2.5, 0)$ and $(4, 0)$ and a $y$-intercept of $(0, -2.5)$.
- The function has a vertical asymptotes of $x = -\dfrac{2}{5}$ and $x = 4$. It also has a horizontal asymptote of $y = \dfrac{2}{5}$.
- This means that it has a domain of $(-\infty, -4) \cup (-4, -\dfrac{5}{2}) \cup (-\dfrac{5}{2}, \infty)$.
- The point of intersection shared between the vertical and horizontal asymptotes is $\left(-\dfrac{116}{59}, \dfrac{2}{5}\right)$.
We’ve tried graphing and understanding the different properties of the rational functions. We try to apply these to model real-world examples and answer some word problems involving rational functions.
Example 7
Jennifer runs an e-commerce company and plans to manufacture her best-selling shampoo bar to scale her business. She predicts that the fixed monthly cost of manufacturing her shampoo bars will be 3 000 dollars. It costs Jennifer 4.80 dollars to produce each shampoo bar.
a. If $C(x)$ represents the total cost of producing $x$ shampoo bars, what is the expression for $C(x)$?
b. If $A(x)$ represents the average cost of producing $x$ shampoo bars, what is the expression for $A(x)$?
c. Find the values of $A(10)$, $A(100)$, and $A(1000)$. What do these values represent?
d. Determine the horizontal asymptotes found in the graph of $A(x)$. What do they represent in terms of Jennifer’s company and the bars she manufactures?
Solution
The total cost of producing $x$ shampoo bars can be calculated by adding the fixed cost and the total manufacturing cost for $x$ bars.
It costs $4.80$ dollars to produce one shampoo bar, so it will cost $4.80x$ dollars to manufacture $x$ shampoo bars.
a. This means that the total cost can be expressed as $\boldsymbol{C(x) = 4.80x + 3000}$.
We can determine the average cost by dividing the total cost, $C(x)$ by the total number of units, $x$.
b. Hence, the average cost of producing one shampoo bar is $\boldsymbol{A(x) = \dfrac{4.80x + 3000}{x}}$.
Now that we have the expressions for $A(x)$, we can find different values of the function by substituting $x = 10$, $x = 100$, and $x = 1000$ into $A(x)$.
| $\boldsymbol{x}$ | $\boldsymbol{A(x)}$ |
| $10$ | $\dfrac{4.80(10) + 3000}{10} = 304.80$ |
| $100$ | $\dfrac{4.80(100) + 3000}{100} = 34.80$ |
| $1000$ | $\dfrac{4.80(100) + 3000}{100} = 7.80$ |
c. From the table, we have shown that $\boldsymbol{A(10) = 304.80}$, $\boldsymbol{A(100) = 34.80}$, and $\boldsymbol{A(1000) = 7.80}$. These values show the average cost of each shampoo bar when 10, 100, and 1000 bars are manufactured.
This also shows that as $\boldsymbol{x}$ becomes bigger, the average cost becomes smaller.
Since the degree of both the numerator and denominator of $A(x)$ is the same, the horizontal asymptote can be determined by dividing the numerator and denominator’s leading coefficients.
d. Hence, the horizontal asymptote of $A(x)$ is $y = \dfrac{4.80}{1} = \boldsymbol{4.80}$. This means that the lowest possible average cost for manufacturing these shampoo bars is $4.80.
Why don’t you practice your graphing skills and see if you can arrive at the function of $A(x)$ as shown below?
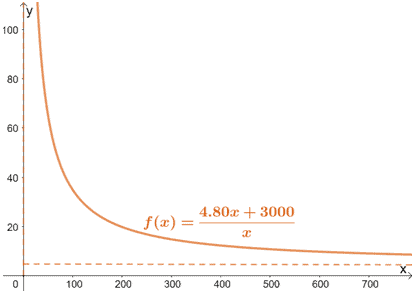
As you can see, the graph shows that Jennifer can produce more than 1000 units, but her average cost can never go below $4.80$.
Example 8
Hailey and her research team are studying the concentration of a drug over time ($t$ minutes) after injecting it into their subject’s bloodstream. The function, $C(t)$, models the amount of concentration observed in $t$ minutes.
$C(t) = \dfrac{36t}{t^2 + 12}$
a. What is the horizontal asymptote of $C(t)$? Interpret this result.
b. Find the values of $C(10)$, $C(20)$, and $C(30)$. What happens when $t$ increases?
c. Graph $C(t)$ using our graphing techniques or use a graphing utility if you have one to confirm the behavior of $C(t)$.
d. What does the maximum point of the curve represent?
Solution
Since the denominator has a higher degree than the numerator, $C(t)$ has a horizontal asymptote of $\boldsymbol{C(t) = 0}$. This means that once injected, the concentration can never be equal to zero.
Substitute $t = 10$, $t = 20$, and $t = 30$ into the function’s expression to find $C(t)$ at those points.
| $\boldsymbol{t}$ | $\boldsymbol{C(t)}$ |
| $10$ | $\dfrac{36(10)}{(10)^2 + 12} \approx 3.21 $ |
| $20$ | $\dfrac{36(20)}{(20)^2 + 12} \approx 1.78 $ |
| $30$ | $\dfrac{36(30)}{(30)^2 + 12} \approx 1.18 $ |
As $\boldsymbol{t}$ increases, we can see that $\boldsymbol{C(t)}$ decreases. This behavior makes sense since as time increases, the amount of the drug present decreases, and consequently, the concentration decreases.
We can use either method to graph $C(t)$, and we should have a graph similar to the one shown below.
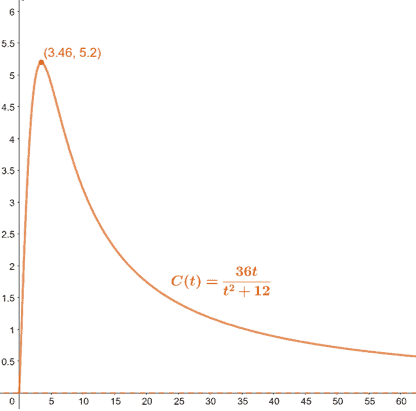
This means that at time $t = 3.46$ minutes, the concentration is at its highest.
These examples have shown you how we can apply our knowledge on rational functions to graph them, predict their curves’ behavior, and even apply these to solve real-world applications.
Make sure to review your notes, then try out the problems that follow on your own!
Practice Questions
Open Problems
1. Complete the table below by finding the $x$ and $y$-intercepts of the following rational functions.
Function | $\boldsymbol{x}$-intercept | $\boldsymbol{y}$-intercept |
$f(x) = \dfrac{x + 4}{-3x + 4}$ | ||
$g(x) = \dfrac{x^2 – 9}{2x – 6}$ | ||
$h(x) = \dfrac{x^4 – 6x^2 + 9}{4x^5 – 12x^3}$ |
2. Analyze the g=function, $f(x) = \dfrac{3x + 1}{x^2 + 6x +8}$.
Open Problem Solutions
1.
Function | $\boldsymbol{x}$-intercept | $\boldsymbol{y}$-intercept |
$f(x) = \dfrac{x + 4}{-3x + 4}$ | $(-4, 0)$ | $(0, 1)$ |
$g(x) = \dfrac{x^2 – 9}{2x – 6}$ | $(-3, 0)$ | $\left(0,\dfrac{3}{2}\right)$ |
$h(x) = \dfrac{x^4 – 6x^2 + 9}{4x^5 – 12x^3}$ | $(-\sqrt{3}, 0), (\sqrt{3}, 0)$ | None |
2. Here’s a summary of what we know about $f(x)$ and its graph:
- $x$-intercept: $\left(−\dfrac{1}{3},0\right)$, $y$-intercept: $\left(0, \dfrac{1}{8}\right)$
- Vertical asymptote:$x=-2$ and $x = -4$.
- Horizontal asymptote: $y = 0$
- Domain: $(−\infty, -4) \cup (-4,-2 ) \cup (-2, \infty)$
Images/mathematical drawings are created with GeoGebra.