JUMP TO TOPIC
3D Coordinate System – Definition, Graphing Techniques, and Examples
It is important that we understand the 3D coordinate system when studying vectors and higher calculus topics. We’ve been dealing with planes and rectangular coordinates in the past. This time, we’ll look into the components and conventions of the three-dimensional coordinate system.
The 3D coordinate system allows us to represent a quantity in a space that contains three mutually perpendicular axes. Through the 3D coordinate system, we can now visualize points and surfaces with respect to three axes.
In this article, we’ll cover all the bases you need to understand how we model values and systems in the three-dimensional coordinate system. We’ll also discuss how we extend our understanding of the rectangular coordinate system to graph equations in the three-dimensional coordinate system.
What is the three-dimensional coordinate system?
The three-dimensional coordinate system contains an origin (normally denoted by $O$) and formed by three mutually perpendicular coordinate axes: the $x$-axis, $y$-axis, and the $z$-axis.
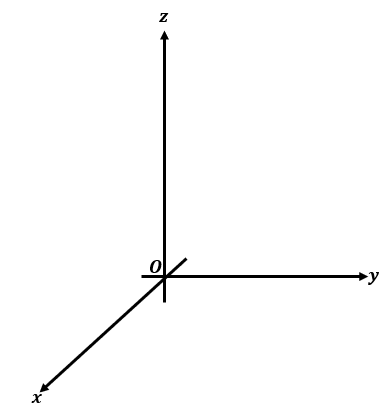
In the rectangular coordinate system, we can locate the point using the ordered pair, $(x, y)$, where $x$ represents the horizontal position and $y$ represents the vertical position of the point. Since we only need two directions to locate the point on a plane, we call this system the two-dimensional coordinate system.
Now, if we want to locate the point in space, we’ll need three numbers :$x$, $y$, and $z$. We call $\boldsymbol{(x, y,z)}$, the ordered triple. This is how we established the origin of the 3D coordinate system. Instead of two axes, we now have three coordinate axes that are mutually perpendicular to each other. In 3D coordinate systems, we normally view the $\boldsymbol{x}$ and $\boldsymbol{y}$-axis as the two horizontal axes that are perpendicular to each other. The $\boldsymbol{z}$-axis becomes the sole vertical axis in three dimensions.
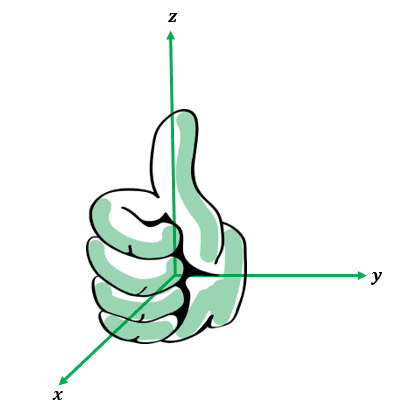
To establish the direction of the third axis, $z$-axis, we can apply the right-hand rule. The image above illustrates that rule: using your right hand, curl your fingers around the $z$-axis. If we curl our hand around $90^{\circ}$ in a counterclockwise direction, our fingers will move from the positive $x$-axis to the $y$-axis. The position of our thumb shows us the positive direction of the $z$-axis.
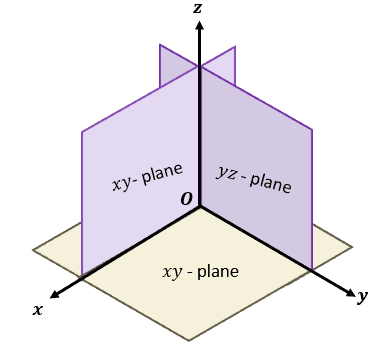
In the past, we’ve been working with just one plane on the $xy$-coordinate system. For the 3D coordinate system, we have three coordinate planes.
- We call the plane formed by the $x$ and $y$ axes the $\boldsymbol{xy}$-plane.
- Similarly, the plane formed by the $y$ and $z$ axes is called the $\boldsymbol{yz}$-plane.
- The $\boldsymbol{xz}$-plane contains the $x$ and $z$ axes.
Here’s a great mental exercise in case you still need help visualizing the three-dimensional coordinate system. Imagine you’re in a room and focus on one corner.
The origin is the point where these three axes intersect. Imagine the corner of your room where two walls intersect – that’s how we can picture out the origin’s position.
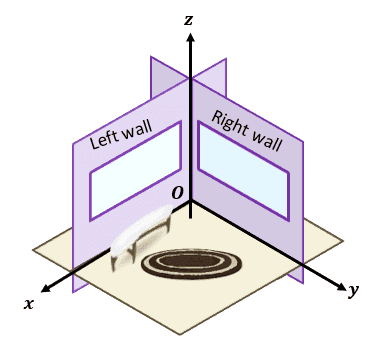
The wall on the left will represent the $xz$-plane while the right wall represents the $yz$-plane. If the walls represent the $xz$ and $yz$ planes, then the floor will represent the $xy$-plane. Extending these planes through their positive and negative directions, we’ll have eight “rooms” we call the octant. A three-dimensional coordinate system will have a total of eight octants that all intersect at the origin, $O$.
- If the 2D coordinate system has four quadrants, the 3D coordinate system has eight octants.
- The first octant will the three coordinates positive (similar to how the first quadrant has the positive $x$ and $y$ coordinates).
Let’s now understand how coordinates are represented in 3D coordinate systems.
COORDINATES IN THREE-DIMENSIONAL SYSTEM Since our point is now positioned in a space, the point $P(x_o, y_o, z_o)$ will be located: · $x_o$ units from the $yz$-plane · $y_o$ units from the $xz$-plane · $z_o$ units from the $xy$-plane The point $P$ represented by the ordered triple, $(x_o, y_o, z_o)$, we call $x_o$, $y_o$, and $z_o$ the coordinates of $P$. Just like in the rectangular coordinate system, we call $x_o$ the $x$-coordinate, $y_o$ the $y$-coordinate, and $z_o$ the $z$-coordinate. |
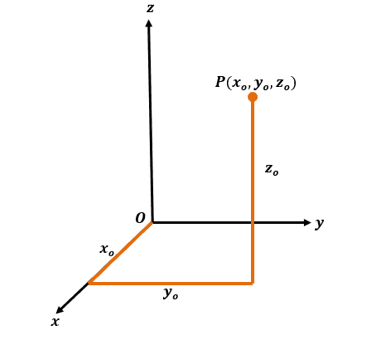
Here’s the position of $P(x_o, y_o, z_o)$: from the origin, count $x_o$ units along the $x$-axis, from our count on the $x$-axis, $P$ is $y_o$ unit parallel to the $y$-axis, and $z_o$ units parallel to the $z$-axis.
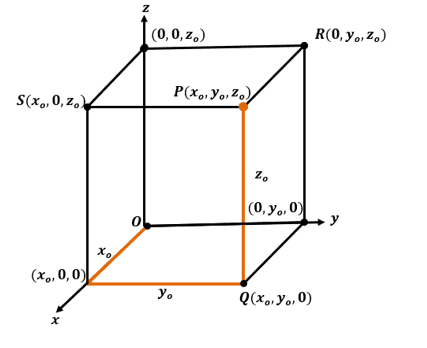
We can use the point, $P$, to construct a rectangular box as shown above. This highlights the projections of $\boldsymbol{P}$ onto the different planes.
- The point, $Q(x_o, y_o, 0)$, is the projection of $\boldsymbol{P}$ on the $\boldsymbol{xy}$-plane.
- The point, $S(x_o, 0, y_o)$, is the projection of $\boldsymbol{P}$ on the $\boldsymbol{xz}$-plane.
- The point, $R(0, y_o, z_o)$, is the projection of $\boldsymbol{P}$ on the $\boldsymbol{yz}$-plane.
ANALOGY OF 2D AND 3D RECTANGULAR COORDINATE SYSTEMS We define the two-dimensional coordinate system as $ \mathbb{R}^2$, so for the three-dimensional coordinate system, our Cartesian product will now be $\boldsymbol{ \mathbb{R}^3}$. Equations’ graphs in the 2D coordinate system are called curves while we call the equation in the 3D coordinate system the surface. |
Now that we have a clear understanding of the three-dimensional coordinate system, let’s focus on learning how to graph coordinates and surfaces.
How to graph in 3D?
We can graph a coordinate in the three-dimensional coordinate, $P(x_o, y_o, z_o)$. system by:
- Start from the origin then move $x_o$ units along the $x$-axis.
- The point must be $y_o$ and $z_o$ units way from the $y$ and $z$ axes.
- The projected rectangular box will have dimensions of $x_o$, $y_o$, and $z_o$ units.
Let’s try plotting the coordinate point, $(-2, 4, 5)$, on our 3D rectangular coordinate system.
- From the origin, move $-2$ units along the $x$-axis. This means that the point will be behind the first octant, where $x$ is negative.
- Now, the point must be $4$ units parallel to the $y$-axis and $5$ units parallel to the $z$-axis.
- You can construct a rectangular box to guide in plotting $(-2, 4, 5)$.
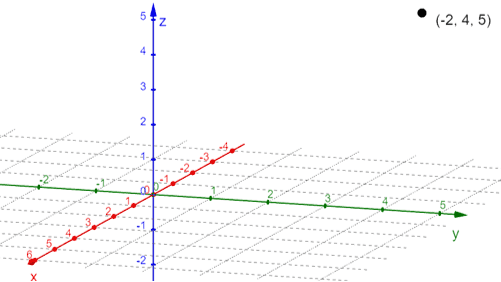
This graph shows the point, $(-2, 4, 5)$ plotted in the three-dimensional rectangular coordinate system. Now, in the same space, graph $(3, -2, 4)$ as shown below.
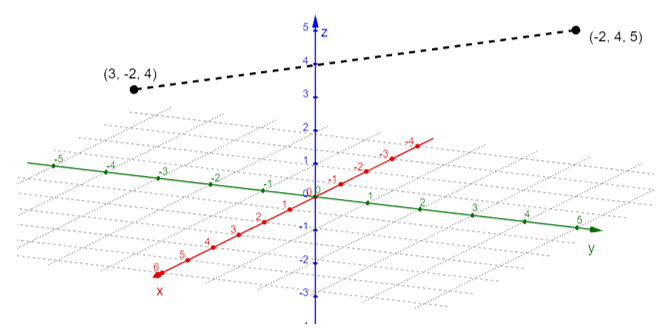
We can still measure the distance between the two points. The distance formula will be adjusted by accounting for the third axis. The process is similar to finding the distance between two vertices in a rectangular prism. Hence, we have the following distance formula for the three dimensions.
DISTANCE FORMULA FOR THE 3D COORDINATE SYSTEM Suppose that we have two points in space: $P(x_1, y_1, z_1)$ and $P_2(x_2, y_2, z_2)$. The distance between the two points can be calculated using the distance formula shown below: \begin{aligned}|P_1P_2| &= \sqrt{(x_2 – x_1)^2 + (y_2 – y_1)^2 + (z_2 – z_1)^2 }\end{aligned} |
Let’s try to apply this formula to calculate the distance between the two points: $P = (3, -2, 4)$ and $Q = (-2, 4, 5)$.
\begin{aligned}|PQ| &= \sqrt{(3 – -2)^2 + (-2 – 4)^2 + (4 – 5)^2}\\&= \sqrt{25 +36 +1}\\&= \sqrt{62}\end{aligned}
This means that the distance between the two points is equal to $\sqrt{62}$ units.
We can graph a surface in the three-dimensional coordinate system as well. The most basic surface that we need to graph is the plane represented by the following equations: $x= k$, $y = k$, or $z = k$.
Graphing $\boldsymbol{x = k}$ | Graphing $\boldsymbol{y = k}$ | Graphing $\boldsymbol{z = k}$ |
· The equation represents all points in $\mathbb{R}^3$ with an $x$-coordinate of $k$. · Construct a vertical plane that is parallel to the $yz$ plane and $k$ units along the $x$-axis. | · The equation represents all points in $\mathbb{R}^3$ with a $y$-coordinate of $k$. · Construct a vertical plane that is parallel to the $xz$ plane and $k$ units along the $y$-axis. | · The equation represents all points in $\mathbb{R}^3$ with a $z$-coordinate of $k$. · Construct a horizontal plane that is parallel to the $xy$ plane and $k$ units above the $z$-axis. |
This means that we graph the plane, $z = 4$, in the three-dimensional coordinate system.
- The equation, $z =4$, represents all coordinates in $\mathbb{R}^3$.
- Construct a horizontal plane that is parallel to the $xy$-plane.
- Make sure that the horizontal plane is found $4$ units above the origin and along the $z$-axis.
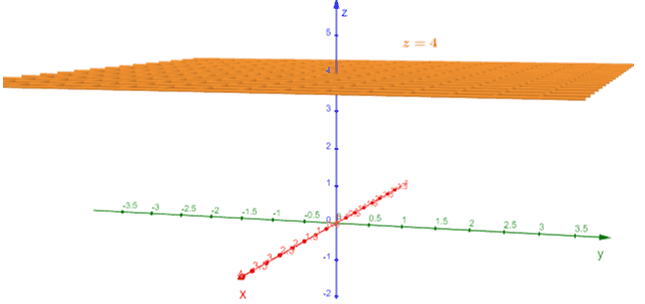
This shows the graph of $z = 4$ as a plane in a three-dimensional coordinate system. This plane is parallel to the $xy$-plane and is $4$ units above the $z$-axis. We’ve covered all the fundamental concepts we need to familiarize ourselves with a 3D coordinate system.
Master this topic even more by working on some sample problems we’ve prepared for you!
Example 1
Imagine that you begin from the origin and move $3$ units along the positive $x$-axis. You then move $3$ units to the positive direction and $6$ units upward. What are the coordinates that represent your current position?
Solution
We can trace the movement by using a three-dimensional coordinate system. Move $3$ units along the $x$-axis then move $3$ units and parallel to the $y$-axis. Move $6$ units upwards afterward to find the final position.
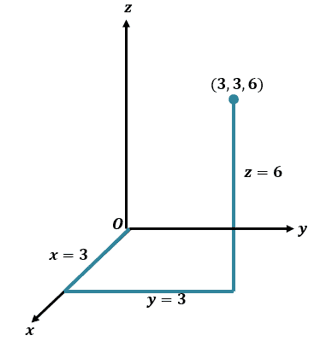
When you take a look at the final position, we have a point with a coordinate of $(3, 3, 6)$.
Example 2
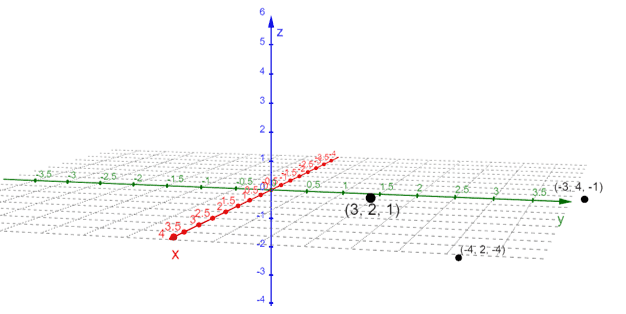
Sketch the following points on one space or three-dimensional coordinate system:
- $A = (3, 2, 1)$
- $B = (-3, 4, -1)$
- $C = (-4, 2, -4)$
Solution
The process of plotting a point on a 3D space is similar to finding one. Let’s break down the steps of graphing each coordinate first:
- For $A$, move $3$ units along the positive $x$-axis then move $2$ units and $1$ unit parallel to the $y$ and $z$ axes.
- The second point, $B$, has a negative $x$-coordinate, so starting from the origin, move $-3$ units along the negative $x$-axis. Move $4$ units in a positive direction then $1$ unit downward.
- Lastly, for $C$, start from the origin then move $-4$ units in the $x$-axis. Move $2$ units in the positive direction and parallel to the $y$-axis then move $4$ units downward.
Use one 3D coordinate system to plot all three points and you can continue using a rectangular box as a guide when plotting each point.
Example 3
Sketch the equation $y = 4$ in $\mathbb{R}^3$ and on the 3D coordinate system.
Solution
The equation $y = 4$ represents all the points that have a $y$-coordinate of $4$. The surface representing this equation is a plane that is parallel to the $xz$-plane and is located $4$ units along the positive $y$-axis.
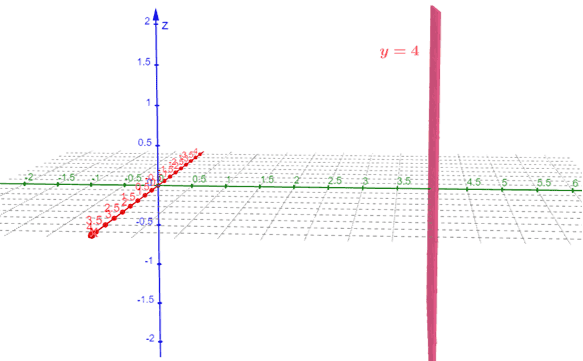
Here’s the graph of the plane representing $ y= 4$. This also confirms the fact that it is parallel to $xz$-plane and is located $4$ units from the origin and along the $y$-axis.
Example 4
What is the distance between the points $(-6, 5, 8)$ and $(-4, 10, -4)$ positioned on the same coordinate system?
Solution
We can use the distance formula, $|P_1P_2| = \sqrt{(x_2 – x_1)^2 + (y_2 – y_1)^2 + (z_2 – z_1)^2 }$, to calculate the distance between the two points.
\begin{aligned}P_1 = (-6, 5, 8)\\ P_2 &= (-4, 10, -4)\\\\ |P_1P_2| &= \sqrt{(-6 – -4)^2 + (5 – 10)^2 + (8 – -4)^2}\\&= \sqrt{173} \end{aligned}
This means that the distance between $(-6, 5, 8)$ and $(-4, 10, -4)$ is equal to $\sqrt{173}$ units.
Practice Questions
1. Imagine that you begin from the origin and move $6$ units along the negative $x$-axis. You then move $4$ units to the positive direction and $8$ units downward. What are the coordinates that represent your current position?
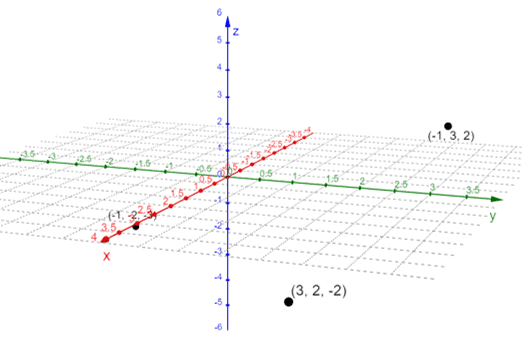
2. Sketch the following points on one space or three-dimensional coordinate system:
• $A = (-1, 3, 2)$
• $B = (-1, -2, -3)$
• $C = (3, 2, -2)
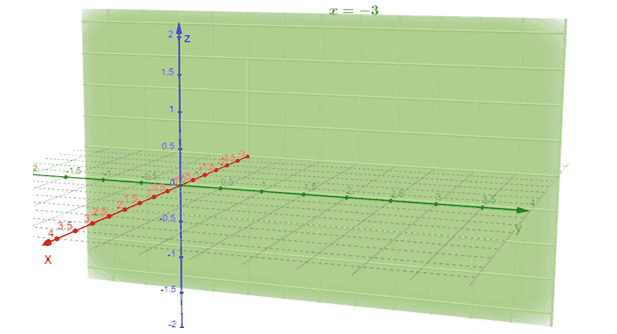
3. Graph the equation $x = -3$ in $\mathbb{R}^3$ and on the 3D coordinate system.
4. What is the distance between the points $(-12, 12, 13)$ and $(-5, -8, 12)$ positioned on the same coordinate system?
Answer Key
1. $(-6, 4, -8)$
2.
3.
4. $15\sqrt{2}$ units
3D images/mathematical drawings are created with GeoGebra.