Arithmetic Mean – Explanation and Examples
The arithmetic mean of a set of data is the sum of the values divided by the number of values.
The arithmetic mean is also called the mean or the average. This is different from the geometric mean, which is the square root of the product of the values.
Arithmetic means play an important role in probability, statistics, and all sciences. This is because it is one way of interpreting a data set.
This section covers:
- What is Arithmetic Mean?
- How to Calculate Arithmetic Mean
- Arithmetic Mean Formula
- Arithmetic Mean Definition
What is Arithmetic Mean?
The arithmetic mean is a measure of centrality in a data set. That is, it is one way to calculate the center center of the data set.
Specifically, the arithmetic mean is equal to the sum of all the values in the data set divided by the number of values. It is also called the average or the mean. Note, however, that sometimes when people ask for an average, they are usually asking for any measure of center, not specifically the mean.
This mean value differs from other measures of center, also called central statistics or measures of central tendency, such as the median and mode.
Recall that the median is the value in the middle of a data set and the mode is the most commonly occurring value. Medians work well for data sets with outliers and modes work well for qualitative data. Means, on the other hand, work well for quantitative data without outliers.
Arithmetic Mean vs. Other Means
The arithmetic mean is the sum of the terms in a data set divided by the number of terms, but there are two other Pythagorean means.
These are the geometric mean, which is the nth root of the product of a set of $n$ terms, and the harmonic mean, which is the reciprocal of the mean of the arithmetic mean.
Arithmetic Mean for Multivariate Data
If a data set includes multivariate quantitative data, it is possible to find the arithmetic mean of each of the variables. Recall that multivariate quantitative data includes more than one numerical value per data point.
For example, a set of multivariate data for a fleet of cars might include the model year, odometer reading, current value, and gas mileage. When analyzing this set of data, the car fleet owner will take the arithmetic mean of each of those four values separately.
Arithmetic mean, however, is does not work as well when finding the center for qualitative data.
How to Calculate Arithmetic Mean
To calculate the arithmetic mean, first add up all of the values in a set of data. Then, find the number of values in the data set. Finally, divide the sum by the total number of values.
This number is called the arithmetic mean, the mean, or the average.
Arithmetic Mean Formula
The arithmetic mean formula for a set of data $n_1, … , n_k$ is:
$\frac{n_1+…+n_k}{k}$.
Another way of writing this is:
$\frac{1}{k} \sum_{i=1}^k n_k$
or:
$\frac{\sum_{i=1}^k n_k}{n}$.
Arithmetic Mean Definition
The arithmetic mean of a set of data is a measure of central tendency equal to the sum of the terms in the data set divided by the total number of terms. When used in statistics, the symbol $\mu$ commonly represents it.
In multivariate data sets, calculate the arithmetic mean separately for each variable.
Common Examples
This section goes over common examples of problems involving arithmetic means and their step-by-step examples.
Example 1
Find the arithmetic mean for the following data set.
$1, 3, 3, 2, 4, 6, 8, 1, 4$.
Solution
Recall that the arithmetic mean is the sum of all the terms in a data set divided by the number of terms in a data set.
In this case, first find the sum of all the terms. This is equal to:
$1 + 3 + 3 + 2 + 4 +6 +8 + 5 = 32$.
Next, find the total number of terms in the data set. In this case, there are 8.
Finally, divide the sum by the number of terms. Here, this is:
$ \frac{32}{8} = 4$.
Example 2
Consider the following data with three values per point.
$(1, 20, 5), (1, 40, 3), (2, 30, 3), (1, 30, 5), (2, 20, 4)$.
What is the average of each of the three variables?
Solution
In this case, it is required to find the arithmetic mean three times over. For the $x$ values, this is:
$\frac{1 + 1 + 2 + 1 + 2}{5}$
because there are five terms in the data set. This value simplifies to:
$\frac{7}{5} = 1.4$
Next, find the average of the $y$ values. This is:
$\frac{20 + 40 + 30 + 30 + 20}{5} = \frac{140}{5} = 28$.
Finally, find the average of the $z$ values. This is equal to:
$\frac{ 5 + 3 + 3 + 5 + 4}{5} = \frac{20}{5} = 4$
Therefore, the average for each of the terms is is $1.4$, $28$, and $4$.
Example 3
A runner records her times for a one mile run on $6$ occasions. On her first run, she ran $6:59$. It took her $7:12$ and $6:40$ for her next two runs. Next, she ran $7:14$ and $6:42$. Then, she ran $6$ minutes, $38$ seconds on her final run.
Find the arithmetic mean for the times and interpret it in context.
Solution
In this case, the arithmetic mean is equal to the total of all the times divided by $6$ because there were $6$ recorded times.
To find the total, it is easier to convert the times to seconds. To do this, multiply the number of minutes by $60$ and then add the number of seconds. This makes the times:
- $6 \times 60 = 360 + 59 = 419$ seconds.
- $7 \times 60 = 420 + 12 = 432$ seconds.
- $6 \times 60 = 360 + 40= 400$ seconds.
- $7 \times 60 = 420 + 14 = 434$ seconds.
- $6 \times 60 = 360 + 42 = 402$ seconds.
- $6 \times 60 = 360 +38 = 398$ seconds.
Next add up the total number of seconds. This is equal to:
$419 + 432 + 400 + 434 + 402 + 398 = 2485$.
Now, divide $2485$ by $6$ to get $414 \frac{1}{6}$.
Next, convert this time to minutes and seconds by dividing by $60$. The remainder is the number of seconds.
$\frac{414 \frac{1}{6}}{60} = 6$ with a remainder of $54 \frac{1}{6}$.
This means that the average time is just over $6$ minutes and $54$ seconds.
What does this arithmetic mean mean in context? It means that the runner can say her average mile time is about $6$ minutes $54$ seconds. It also means that if she goes on a one mile run, she can expect it to take about $6$ minutes $54$ seconds.
Example 4
Jaxson does push ups every day and records how many he does. These are his results for two weeks.
(50, 60, 50, 40, 40, 60, 90, 20, 30, 40, 500, 30, 40, 50).
Find the mean of the data set. Why is this value not a good measure of center in this case? On the other hand, what is a better measure of center?
Solution
To find the average, first add up the total number of push ups that Jaxson did during the two week period.
This is equal to:
$20+30(2)+40(4)+50(3)+60(2)+90+500 = 1000$.
Next, divide this number, $1000$ by $14$, the number of days Jaxson recorded his push up count.
$\frac{1000}{14} = \frac{500}{7}$.
This is approximately equal to $71$.
Thus, the average number of pushups Jaxson did was just over $71$. There were only two days, however, when he did more than $60$ push ups. This means that the average is probably not a good measure of center for this set of data.
Why is the mean so different? This is because there is a large outlier, $500$, in this data set. This will skew the data and have a large effect on the mean. Perhaps this because Jaxson was in a competition or something that day and did more push ups that usual. Because of this value, the mean is not a good reflection of the average number of push ups he does.
Alternatively, a better measure of center when there is an outlier is the median. In this case, the median numbers are $40$ and $50$, so the median is the average of the two, $45$.
Example 5
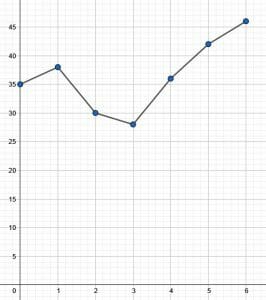
The line graph shows the high temperature every day over the course of one week. Based on the graph, what was the average high temperature for that week?
Solution
Although the graph technically shows multivariate data, the $x$-axis is just the number of days since the beginning of the week. Therefore, finding the average of this would not give much information.
Instead, it is required to find the average high temperature. To do this, first find the high temperature on each day using the graph.
The temperatures are $(35, 38, 30, 28, 36, 42, 46)$.
Next, add up all of the high temperatures:
$35+38+30+28+36+42+46 = 260$.
Next, divide this number by $7$ because there were $7$ days.
$\frac{260}{7}$ or about $37.1$ degrees.
Therefore, the mean or average high temperature for that week was about $37.1$ degrees.
Example 6
Renee plays a board game at a tournament. Her scores for nine of the ten games she played were $85, 90, 85, 105, 100, 110, 100, 100,$ and $105$. Her average score for the ten games she played at the tournament was $98$. What was the score for her tenth game?
Solution
Rather than finding the mean, in this example, it is required to use the mean to find a missing number.
This requires thinking about how the mean is calculated. Recall that the average or mean is equal to the total of all the terms divided by the number of terms.
In this case, call the unknown value $x$. Then the mean is equal to:
$\frac{85(2)+90+100(3)+105(2)+110+x}{10} = 98$.
Now, it is possible to solve for $x$.
First, multiply both sides by ten and simplify the sum on the left to get:
$880+x=980$.
Then, subtract $880$, the sum of the known terms, from both sides to get:
$x=100$.
Therefore, the missing score was $100$.
Practice Problems
- Is it possible for a data set to have a median, mode, and mean that are all the same? How? Can you think of an example?
- Prove that adding a term to the set equal to the mean of the set does not change the mean.
- Find the mean of the data set: $(9, 1, 18, 2, 33, 36, 24, 3, 2)$. Is the mean likely to be a good measure of center in this data set? Why or why not?
- Find the mean of each of the variables in this data set: $((14, 29, 110), (14, 33, 150), (15, 29, 140), (13, 32, 140), (14, 31, 110))$.
- Joey gets $8$ hours of sleep on average during a particular week. He slept for $7$ hours on Monday and Tuesday night. Then he slept $8$ hours Wednesday night and $9$ hours Thursday and Friday. He slept for $6$ hours on Saturday night. How many hours of sleep did he get on Sunday night?
Answer Key
- This is possible in many cases. A simple example is a data set where every value is the same, such as $5, 5, 5, 5, 5$.
- Let $m$ be the mean of a data set $(n_1, … , n_k)$. In this case, $m = \frac{n_1 + … + n_k}{k}$.
Let $m’$ be the new mean after the new value equal to $m$ is added in. That is, the new data set is ${n_1, … , n_k, m}$. It is required to prove that $m’ = m$.
Here, $m’ = \frac{n_1 + … + n_k + m}{k+1} = \frac{n_1 + … + n_k}{k+1} + \frac{m}{k+1}$.
Now, multiply both sides by $\frac{k+1}{k} to get: $\frac{mk+m}{k} = \frac{n_1 + … + n_k}{k} + \frac{m}{k}$.
This simplifies to: $m+\frac{m}{k}=m+\frac{m}{k}$. Clearly these two sides are equal. Therefore, $m=m’$. - $\frac{128}{9}$, which is about $14.2$. This is a good measure of center since there are no major upper or lower outliers.
- The means are $14$, $30.8$ and $130$.
- Joey got $10$ hours of sleep.
All mathematical illustrations/objects created with Geogeba.