JUMP TO TOPIC
Invnorm Calculator + Online Solver With Free Steps
The online Invnorm Calculator is a calculator that helps you find the inverse normal distribution probability of normal distribution.
The Invnorm Calculator is a powerful tool for data analysts and mathematicians to analyze the provided data better.

What Is an Invnorm Calculator?
An Invnorm Calculator is an online calculator that can calculate the inverse normal distribution of a given normal distribution.
The Invnorm Calculator requires three inputs, the z-score probability, the mean value, and the standard deviation of a normal distribution probability curve.
After plugging in the respective values in the Invnorm Calculator, the Calculator finds the inverse normal distribution values and plots a graph to represent the data in a separate window.
How To Use an Invnorm Calculator?
To use the Invnorm Calculator, you have to enter the normal distribution inputs into the Calculator and click the “Submit” button to get the result.
The step-by-step instructions on how to use the Invnorm Calculator are given below:
Step 1
First, we add the corresponding z-score probability value into the Invnorm Calculator. The probability value must be between 0 – 1.
Step 2
After adding the z-score probability, you input the mean value of the normal distribution into your Invnorm Calculator.
Step 3
Once you plug in the mean value, you plug in the standard deviation value of your normal distribution into the Invnorm Calculator.
Step 4
Finally, click the “Submit” button on the Invnorm Calculator after entering all your input values. The Invnorm Calculator will display the inverse normal distribution values and plot a graph in a new window.
How Does an Invnorm Calculator Work?
The Invnorm Calculator works by taking the normal distribution as an input, which is represented as $ f(X)= \frac{1}{\sigma \sqrt{2\pi }}\displaystyle e^{-\frac{1}{2}(\frac{X-\mu}{\sigma})^{2}} $, and finding the inverse of this normal distribution. The Z and P are defined in a z-table. The Invnorm Calculator uses this table to find the inverse normal distribution and plots a graph.
What Is Probability?
Probability is the ratio of favorable events to all possible outcomes of an event. The symbol x can represent the number of positive results for an experiment with n outcomes. The probability of an event can be calculated using the following formula:
\[ Probability(E)= \frac{x}{n} \]
As an example, if we flip a coin, the probability of it landing on heads or tails is both $ \frac{1}{2}$. This shows a 50% chance that the coin will land on heads or tails.
What Is a Z-score Probability?
A z-score is also known as a standard score and indicates how far a data point is from the mean. Technically speaking, it’s a measurement of how many standard deviations a raw score is from or above the population mean.
The normal distribution curve can be used to plot a z-score. The range of Z-scores ranges from -3 standard deviations (which would be on the far left of the normal distribution curve) to +3 standard deviations (which would fall to the far right of the normal distribution curve). The mean $ \mu $ and population standard deviation $\sigma$ must be known to use a z-score.
Z-scores allow results to be contrasted with those of a “normal” population. There are thousands of conceivable outcomes and unit combinations for test or survey findings, and those outcomes can appear meaningless.
However, a z-score can help you compare a value with the average value from a large set of numbers.
The formula for calculating a z-score is shown below:
\[ z_{i} = \frac{x_{i}-\overline{x}}{s} \]
What Is Mean Value?
A mean value, or average, is a single number that captures the median or typical value of all the data in a dataset. It is another name for the arithmetic average, one of many measurements of central tendency.
The formula to calculate the mean is given below:
\[ \mu = \frac{x_{1} + x_{2} + x_{3}\cdots + x_{n}}{n} \]
The place where most values in distribution should fall is indicated by the mean, ideally. It is referred to as a distribution center by statisticians. It can be compared to the data’s propensity to group around a median value.
The data center is not always identified by the mean, though. Extreme values and distorted data both affect it negatively. This issue arises because outliers significantly affect the mean. An extended tail is pulled out from the center by extreme values. The average gets drawn farther from the center as the distribution grows increasingly skewed.
The mean in these situations may not be close to the most typical values, which makes it potentially deceptive. So, when you have a symmetric distribution, it is preferable to measure the central tendency using the average.
Standard Deviation
The standard deviation measures how widely apart the data points are from the mean. It describes how values are distributed throughout the data sample and measures how widely apart data points are from the mean.
A low standard deviation indicates that the values are often within a few standard deviations of the mean. In contrast, a significant standard deviation indicates that the values are much outside of the mean.
The square root of the variance is used to calculate the standard deviation of a sample, statistical population, random variable, data collection, or probability distribution.
The formula of standard deviation is shown below:
\[ \sigma = \sqrt{\frac{\sum_{i=1}^{n}(x_{i}-\overline{x})^{2}}{n-1}} \]
What Is Normal Distribution?
Normal distribution is a type of probability distribution that is symmetric to the mean and demonstrates that data closer to the mean are more likely to occur than data farther from the mean. Normal distribution is also referred to as Gaussian distribution. A bell-shaped curve represents the normal distribution on the graph.
The mean and standard deviation are two values on which the spread of the normal distribution depends. A graph with a slight standard deviation will be steep, whereas one with a significant standard deviation will be flat.
The formula that is used to calculate Normal Distribution is shown below:
\[ f(X)= \frac{1}{\sigma \sqrt{2\pi }}\displaystyle e^{-\frac{1}{2}(\frac{X-\mu}{\sigma})^{2}} \]
Solved Examples
The Invnorm Calculator can help you calculate the inverse normal distribution probability instantly.
Here are some examples solved using an Invnorm Calculator.
Example 1
A high school student is provided with the following values:
Probability = 0.4
$\mu$ = 0
$\sigma$ = 1
Using these values, calculate the inverse normal distribution probability.
Solution
We can easily calculate the inverse normal distribution probability using our Invnorm Calculator. First, we input our z-score probability value, 0.4, into its respective box. We then enter the mean value $\mu$, 0. Finally, we plug in our standard deviation $\sigma$ value, 1.
After entering all the inputs in our Invnorm Calculator, we click the “Submit” button. The Calculator opens a new window and displays the results. The Calculator also plots a graph of the inverse normal distribution.
The results from the Invnorm Calculator are shown below:
Input Interpretation:
Probabilities for normal the normal distribution:
Probability = 0.4
$\mu$ = 0
$\sigma$ = 1
x-values:
Left tail = P(z < -0.253) = 0.4
Right tail = P(z > 0.253) = 0.4
Left tail = P(| z | > 0.842) = 0.4
Confidence Level = P(| z | < 0.524) = 0.4
Plot:
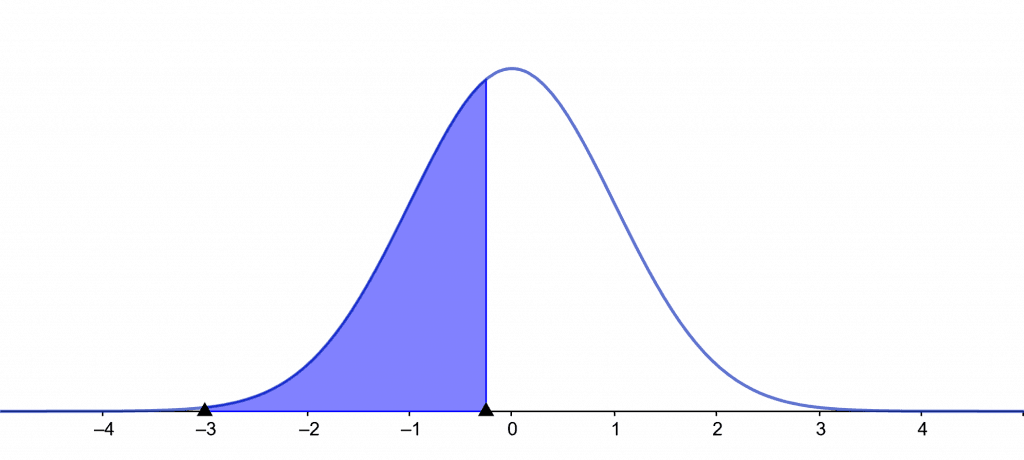
Figure 1
Example 2
A mathematician needs to find out the inverse normal distribution probability of the following normal distribution values:
Probability = 0.7
$\mu$ = 0
$\sigma$ = 1
Using the Invnorm Calculator, find the inverse normal distribution probability.
Solution
The Invnorm Calculator can instantly calculate the inverse normal distribution probability of the given values. First, we plug in our z-score probability value, 0.7. After inputting the probability, we move on and input the mean $\mu$ value, 0, into the Calculator. We enter the last input, the standard deviation $\sigma$, 1.
Finally, after plugging in the inputs in our Invnorm Calculator, we click the “Submit” button. The Calculator quickly displays the inverse normal distribution probability and a plotted graph in a new window.
The results from the Invnorm Calculator are shown below:
Input Interpretation:
Probabilities for normal the normal distribution:
Probability = 0.7
$\mu$ = 0
$\sigma$ = 1
x-values:
Left tail = P(z < 0.524) = 0.7
Right tail = P(z > -0.524) = 0.7
Two tail = P( | z | > 0.385) = 0.7
Confidence Level = P( | z | < 1.036) = 0.7
Plot:
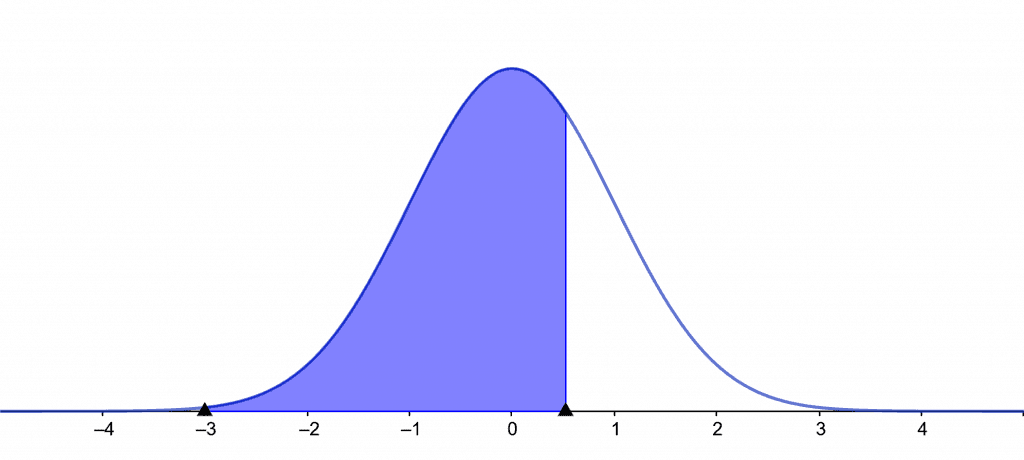
Figure 2
Example 3
Consider the following values:
Probability = 0.25
$\mu$ = 0
$\sigma$ = 1
Use the values above to calculate the inverse normal distribution.
Solution
The Invnorm Calculator can be used to find the inverse normal distribution. First, we enter all the inputs into our Invnorm Calculator. After entering the inputs, we click the “Submit” button. The Calculator quickly computes the inverse normal distribution and plots a graph in a new window.
Below are the results from the Invnorm Calculator:
Input interpretation:
Probabilities for normal the normal distribution:
Probability = 0.25
$\mu$ = 0
$\sigma$ = 1
x-values:
Left tail = P(z < -0.675) = 0.25
Right tail = P(z > 0.675) = 0.25
Two tail = P( | z | > 1.15) = 0.25
Confidence Level = P( | z | < 0.319) = 0.25
Plot:
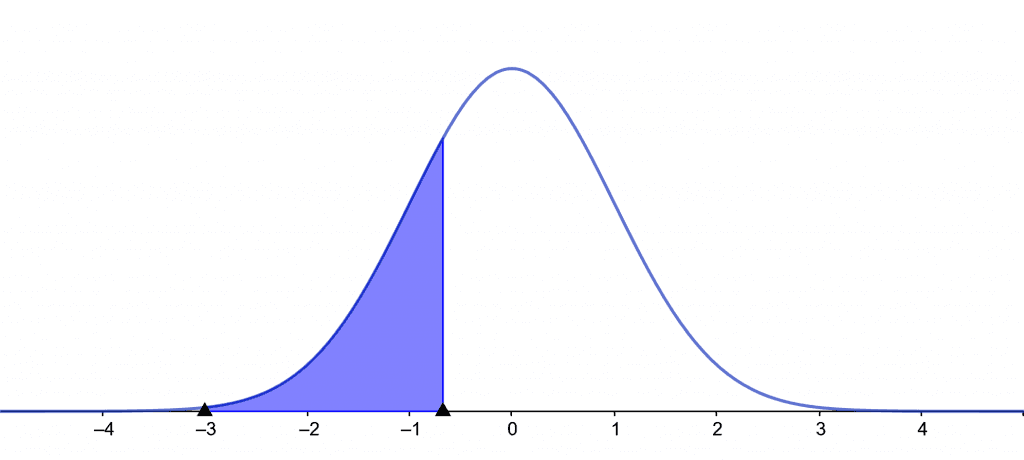
Figure 3
All images/graphs are made using GeoGebra.