JUMP TO TOPIC
Velocity Time Graph Maker Calculator + Online Solver With Free Steps
The Velocity Time Graph Maker Calculator plots the velocity-time graph using the first equation of motion. Motion is defined as the change in the position of an object concerning time. The factors such as velocity and acceleration determine the motion of an object.
Velocity defines the direction in which the object is moving. It is the time rate of change in distance. It represents the object’s speed and direction and is a vector quantity. Acceleration is the rate of change in the velocity of an object. It is a vector quantity whose direction is the direction of the net force acting on the object.
The calculator takes these parameters of the first equation of motion as input and outputs the resulting velocity time graph. The first equation of motion is as follows:
v = u + at
Where u is the initial velocity, a is the acceleration, v is the final velocity, and t is the time taken. The equation of motion takes the body to be moving in a straight line.
The velocities are measured in meters per second, the acceleration in meters per second square, and time in seconds.

What Is a Velocity Time Graph Maker Calculator?
The Velocity Time Graph Maker Calculator is an online tool used to graph an object’s velocity time relationship by entering the initial velocity, acceleration, and elapsed time in the first equation of motion.
The initial velocity u is the velocity with which the object starts moving. The object moves with uniform acceleration a, and after some time t, the velocity of the object changes to v. The object is moving in a straight line.
The slope of the line in the velocity-time graph gives the object’s acceleration. The area under the line in the v-t graph tells how much distance the object has covered.
How To Use the Velocity Time Graph Maker Calculator
The user can use the Velocity Time Graph Maker Calculator by following the steps given below.
Step 1
The user must first enter the acceleration in the calculator’s input window. It should be entered in the block labeled; “Acceleration (m/s/s).”
The acceleration should be in the units of meters per second squared.
For the default example, the uniform acceleration of the object is taken as 4 m/s.s.
Step 2
The user must now enter the object’s initial velocity in the calculator’s input window. It should be entered in the block titled; “Initial Velocity (m/s).”
It should be in units of meters per second.
The initial velocity u is taken as 5 m/s in the default example.
Step 3
The user must now enter the time taken by the object to change its velocity. It should be entered in the block labeled; “time (t).”
The time taken should be in seconds by SI units.
For the default example, the time entered is 10 sec.
Step 4
The user must now press the “Plot” button for the calculator to process the input values and plot the resulting velocity-time graph.
Output
The calculator shows the output in the four windows given below.
Input Interpretation
The calculator interprets the input data and shows the parameters of the first equation of motion by placing them in the equation.
For the default example, the calculator shows the equation of motion as follows:
v=4t+5 where t=0 to 10 sec
Geometric Figure
The calculator also predicts the geometric figure of the resulting equation of motion. It also shows the option of “Properties,” which tells about the properties of the geometric figure.
The equation formed for the default example is the equation of a line; hence the calculator displays “line.”
Plot
The calculator shows the velocity-time plot in this window. In the graph, the time is the independent quantity; hence is on the x-axis, and the velocity is taken on the y-axis.
The slope of the line gives the acceleration of the moving object.
Arc Length of Curve
The calculator also provides the arc length of the curve. It also provides all the mathematical steps for the arc length of the curve calculation by clicking on “Need a step-by-step solution to this problem?”.
The arc length for the default example is 41.231.
Solved Examples
The following examples are solved through the Velocity Time Graph Maker Calculator.
Example 1
A body starts moving with an initial velocity of 6 m/s. After 7 seconds, the velocity of the moving body changes. It is now traveling with a uniform acceleration of 15 m/s.s.
Plot the velocity time graph for this case and find the curve’s arc length.
Solution
The user must first enter the parameters for the equation of motion v=u +at as follows:
Acceleration (a) = 15 m/s$^2$
Initial Velocity (u) = 6 m/s
Time (t) = 7 sec
After entering the input data, the user must now press “Plot. The calculator shows the equation of motion as follows:
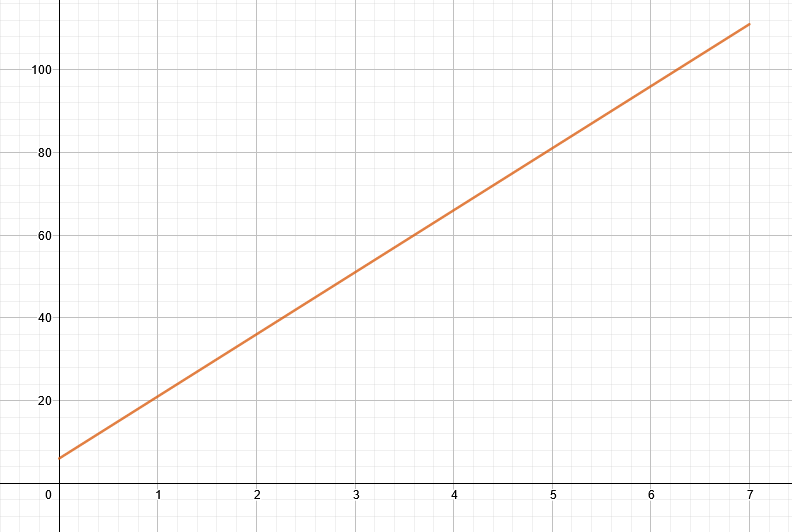
v = 15t + 6 where t = 0 to 7 sec
The geometric figure formed is a “line.” Figure 1 shows the velocity-time graph for this example.

Figure 1
The arc length of the curve is calculated as 105.23.
Example 2
A body accelerates at 20 m/s.s with an initial velocity of 9 m/s in 13 seconds.
Plot the velocity-time graph using the equation v=u +at. Also, calculate the arc length of the curve.
Solution
The values for acceleration, initial velocity, and time should be entered in the calculator’s input window as follows:
Acceleration = 20 m/s.s
Initial Velocity = 9 m/s
Time = 13 sec
After pressing “Plot,” the calculator shows the equation of motion in the Input Interpretation window as follows:
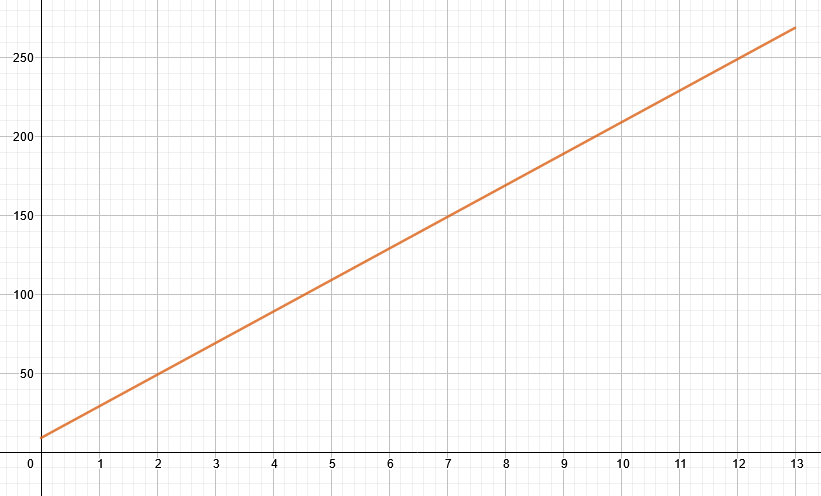
v = 20t + 9 where t = 0 to 13 sec
The calculator shows the geometric figure to be a “line” for the equation. The velocity-time graph of the particular equation is shown in figure 2.

Figure 2
The arc length of the curve is 260.32.
All the images are created using GeoGebra.
