JUMP TO TOPIC
Venn Diagram Calculator + Online Solver With Free Steps
A Venn Diagram Calculator is used to show a representation of the logical expression in terms of Venn Diagrams. This calculator can be used for any logical expression and therefore can come in very handy.
Venn Diagrams provide a good understanding of the correlation between sets and their intertwined nature. Thus, this calculator provides a lot of insight into the problem you are dealing with.

What Is a Venn Diagram Calculator?
A Venn Diagram Calculator is an online calculator which is available to be used in your browser to solve logical operations to acquire their Venn Diagrams.
Venn Diagrams are used to represent set relationships and they provide a graphical view of the logic acting in the system.
It is very simple to use the tool, you can enter your desired problem in it, and it can deliver the corresponding solution.
How To Use a Venn Diagram Calculator?
You can use a Venn Diagram Calculator by inputting the logic function directly for which Venn Diagram is required.
You must follow the provided steps accordingly. We start by having a problem with set logic to solve using this calculator. Now, we have the following steps to follow.
Step 1
We start by setting up any logic that we have into Union, Intersection, AND, and so on. This is necessary as the calculator needs a syntax to operate on.
Step 2
Now, after the whole logic is set up, you enter that into the input box provided.
Step 3
Then, you move forward by pressing the button labeled Submit. This will provide you with the solution to your input problem.
Step 4
Finally, this result is opened in an interactable window. And if you want to solve more problems of similar nature, you can use this window to carry on doing that.
How Does a Venn Diagram Calculator Work?
A Venn Diagram Calculator works by taking the number sets provided in the problem and drawing a Venn Diagram for the set logic.
The calculator first identifies the variables in the problem. These are expressed as A, B, C, and so on, so once these are identified, it can move forward and create an expression for them.
This expression then becomes of the form (a AND b) OR (NOT(c)) = (a $\land$ b) $\lor$ c’. Once this Logical Expression is acquired, the calculator generates one circle for each set and places the behavior of the set accordingly, where the Truth Table would be as follows:
\[\begin{array}{C|C|C|C} a & b & c & (a \land b) \lor (c’) \\ T & T & T & T \\ T & T & F & T \\ T & F & T & F \\ T & F & F & T \\ F & T & T & F \\ F & T & F & T \\ F & F & T & F \\ F & F & F & T \\ \end{array}\]
History of Venn Diagrams
Venn Diagrams first came to light back in the 1880s and their underlying concepts were researched and refined by the 19th-century mathematician John Venn.
But their origin goes way beyond the time of Venn, as he didn’t name them Venn Diagrams but instead called them Eulerian Circles. This was because they were very much like the Euler Diagrams proposed by 18th-century mathematician Leonhard Euler.
The basis of Venn Diagrams was thus founded on the diagrammatical solution to logical problems. Visually expressing the proposition and reasoning was the main intention behind them.
Solved Examples
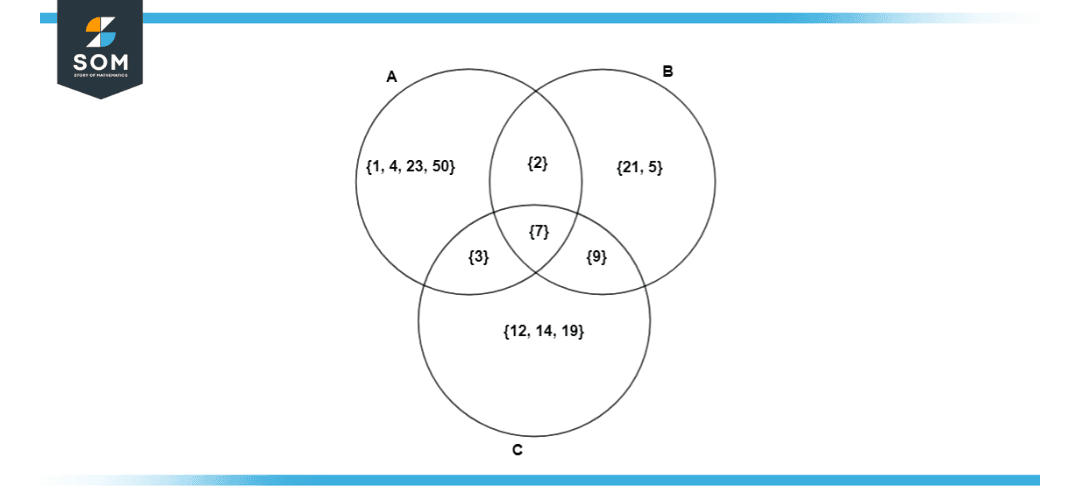
Example 1
Consider the given problem (a AND b AND c)’ and solve for its Venn Diagram.
Solution
We get the truth table results as follows, after solving for the Boolean logic of this example:
\[\begin{array}{C|C|C|C} a & b & c & (a \land b \land c)’ \\ T & T & T & F \\ T & T & F & T \\ T & F & T & T \\ T & F & F & T \\ F & T & T & T \\ F & T & F & T \\ F & F & T & T \\ F & F & F & T \\ \end{array}\]
Now, using sets instead of binary inputs, we can get the Venn Diagram as shown in figure 1:
All Mathematical Drawings are created using GeoGebra.