JUMP TO TOPIC
Measures of Central Tendency – Explanation and Examples
Measures of central tendency, especially the mean, median, and mode, are ways to describe the center of a set of data.
The different measures work better in different types of data sets, but the most complete picture includes all three.
Measures of central tendency are important for probability, statistics, and all areas of science and research.
Before moving forward with this section, make sure to review arithmetic mean.
This section covers:
- What are the Measures of Central Tendency?
- Arithmetic and Geometric Means
- Median
- Mode
- Measures of Central Tendency Definition
What are the Measures of Central Tendency?
Measures of central tendency are ways to describe what a typical data point is in a set of data.
The most common measures of central tendency are mean, median, and mode. There are a few other measures of central tendency such as the harmonic mean (the reciprocal of the arithmetic mean of the reciprocal of the data points) and the midrange (the average of the highest and lowest values) that are used less frequently.
Note that the measure of central tendency is only one value among many summary statistics (descriptive numbers) for a set of data. Data sets can have the same mean, for example, but be very different.
It is also important to note that measures of central tendency have the most meaning when dealing with quantitative data or qualitative data that has been coded quantitatively.
Arithmetic and Geometric Means
The mean of a data set is the average.
Typically, when people think of the average, they mean the sum of all the terms in the data set divided by the number of terms. This value is the arithmetic mean.
Another type of mean is the geometric mean. This is equal to the nth root of the product of all the terms in a data set. Arithmetically, this is:
$\sqrt[k]{\displaystyle \prod_{i=1}^{k} n_i}$
for a data set $n_1, …, n_k$.
To understand the geometric root consider the case of a set of two data consisting of only two points, $a$ and $b$. Now, imagine a rectangle where one side is length $a$ and the other is length $b$. Finally, imagine a square that has the same area as this rectangle. The geometric mean is the side length of such a square.
This same concept holds true for higher dimensions, though it is difficult to visualize beyond the third dimension.
Median
The median is the middle point in a set of data found by ordering the data from least to greatest and finding the middle term.
If there is an odd number of terms, this is easy to do. There will be a number exactly in the middle.
If, however, there are an even number of terms, then there will be two middle numbers. The median of such a data set will be the arithmetic average of these two numbers. That is, the median is the sum of the two numbers divided by two.
The median is different from the midrange, which is the average of the highest and lowest values. Consider, for example a data set with the points $(1, 5, 101)$. The median of this data set is $5$ since it is the middle term. The midrange, however, is $\frac{101-1}{2} = 50$.
While the arithmetic mean can be easily affected by outliers, the median is unaffected by upper or lower outliers in a data set.
Mode
The mode is the term that appears most frequently in a set of data. It is the only measure of central tendency that is applied easily to uncoded qualitative data.
Often, especially in politics, a candidate will be said to have a “plurality” of votes. This means that the candidate got the most votes. That is, if the data set is the votes, the mode is the candidate who got the plurality.
Note that there can be more than one mode in a set of data if multiple terms are tied for appearing the most times.
Measures of Central Tendency Definition
Measures of central tendency are summary statistics that describe what a typical data point in a data set looks like. The most common measures of central tendency are mean, median, and mode.
Measures of central tendency give a fuller picture f a data set when they are combined with other summary statistics such as variability.
Common Examples
This section covers common examples of problems involving measures of central tendency and their step-by-step solutions.
Example 1
The median of a data set is $5$ and the mean is $200$. What does this tell you about the data set?
Solution
In this case, the median and the mean are quite different. It could be that the data just deals with a really wide range of values. More likely, however, the mean has been skewed by an upper outlier. That is, an atypically large number has affected the mean more than the median.
This means that the data is likely skewed strongly to the right and that the median is a better indicator of central tendency than the mean.
Example 2
A random sample of customers at a car insurance company answer a question about the color of their car. The results were:
Red, red, green, blue, blue, blue, yellow, blue, red, white, white, black, black, gray, red, blue, gray.
What is the color of a typical customer’s car?
Solution
Since this is qualitative data, the mode is the measure of central tendency that makes the most sense.
For this data set, there is 1 yellow car, one green car, two white cars, two black cars, two gray cars, four red cars, and five blue cars. The mode is therefore blue cars, so it makes sense to say the typical customer has a blue car.
There might also be a way to find a “median” or a “mean” for this data set by putting the colors in order based on where they fall in the visible light spectrum and assigning them a number accordingly. Such codes already exist, for example, in computer color codes. This might be confusing for cars, however, because there are multiple shades of blue (aqua to navy).
Example 3
Find the mean, median, and mode for the following data set:
$(1, 1, 4, 3, 4, 6, 2, 3, 1, 1, 2, 2, 1, 3, 5, 7)$.
Solution
Before finding any of these values, it helps to count the number of terms in the data set and put them in order from least to greatest. In this case, there are $16$ data points. In order, they are:
$(1, 1, 1, 1, 1, 2, 2, 2, 3, 3, 3, 4, 4, 5, 6, 7)$.
The easiest measure of central tendency to find is the mode, since it is just the number that appears the most often. In this case, the number $1$ appears $5$ times which is more than any other number.
Next, find the median. Since there are an even number of terms, there are two middle values, $2$ and $3$. The average of these two numbers is $2.5$, which is therefore the median. It’s okay that this number doesn’t appear in the data set. It doesn’t have to, just as the mean doesn’t have to.
Finally, find the mean by first adding together all of the values.
$1(5)+2(3)+3(3)+4(2)+5+6+7=46$.
Now, divide this number by the number of terms, $16$. This is $\frac{46}{16}=\frac{23}{8}$. As a decimal, this number is $2.875$.
Note that the mean and median are both higher than the mode but not too different from each other.
Example 4
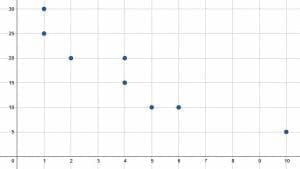
Find the mean, median, and mode for both the $x$ and $y$ values.
Solution
The first step is to find the $x$ and $y$ values based on the graph. The eight points are located at $(1, 25), (1, 30), (2, 20), (4, 15), (4, 20), (5, 10), (6, 10),$ and $(10, 5)$. This means that the $x$ values are:
$(1, 1, 2, 4, 4, 5, 6, 10)$.
Similarly, the $y$ values are $(25, 30, 20, 15, 20, 10, 10, 5)$. It usually helps to order all values from least to greatest because then the median and mode are easier to see. The $y$ values from least to greatest then are:
$(5, 10, 10, 15, 20, 20, 25, 30)$.
Since the mode is the easiest, it helps to start there. For the $x$ values, both $1$ and $4$ appear twice. Both of these values then are the mode.
Likewise, for the $y$ values, both $10$ and $20$ appear twice. They are both therefore the mode.
Now find the median. Since there are $8$ terms, the median will be the average of the fourth and fifth terms of each set. Since, however, the fourth and fifth terms for the set of $x$ values are both $4$, no averaging is required. This is the median.
For the $y$ values, the median is $\frac{20+15}{2} = 17.5$
Now to find the average of each set, add up all of the terms and then divide by the total number of terms. For the $x$ values, this is:
$\frac{1(2)+2+4(2)+5+6+10}{8} = \frac{29}{8} = 3.625$.
For the $y$ values, this is:
$\frac{5+10(2)+15+20(2)+25+30}{8} = \frac{135}{8} = 16.875$.
Therefore, the modes are $1$ and $4$ and $10$ and $20$, the medians are $4$ and $17.5$, and the means are $3.625$ and $16.875$ for $x$ and $y$ respectively.
Example 5
An economist records the price of different loaves of bread at a store. He gets the following $20$ values:
$(1.25, 4.99, 5.79, 5.49, 4.99, 4.99, 3.50, 5.49, 5.99, 4.59, 2.99, 2.50, 1.25, 1.99, 2.50, 5.49, 1.25, 2.99, 5.49, 5.99)$.
Based on the results, what is the cost of a typical loaf of bread at this store? Assume all prices are in dollars.
Solution
There are different ways to establish a typical value, all of which are measures of central tendency. In this case, it makes sense find the most common three, mode, median, and mean, to get a good idea of a typical price for a loaf of bread at this store.
First, order the data from least to greatest. This is:
$(1.25, 1.25, 1.25, 1.99, 2.50, 2.50, 2.99, 2.99, 3.50, 4.59, 4.99, 4.99, 4.99, 5.49, 5.49, 5.49, 5.49, 5.59, 5.99, 5.99)$.
Based on this data, the mode is $5.49$ because this value appears $4$ times.
Next, find the median. Since there are $20$ values, the median is the average of the tenth and eleventh terms. These are $4.59$ and $4.99$. To make the numbers easier, find the difference between the terms, divide that number by two, and then add the resulting value to the tenth term. The difference is $0.40$, half of which is $0.20$. Therefore, average of the two is $4.59+0.20 = 4.79$.
Finally, to find the average, add up all of the terms and divide by $20$. It may help to use a calculator since there are so many terms, but it is not necessary.
$\frac{1.50(3)+1.99+2.50(2)+2.99(2)+3.50+4.59+4.99(3)+5.49(4)+5.59+5.99(2)}{20} = \frac{80.06}{20} = 4.003$.
Since the prices are in dollars, it makes sense to round to the nearest cent. Therefore, the mean is $4$ dollars even.
Thus, the mean, median, and mode are $4$, $4.79$, and $5.49$. It makes sense to say that a typical loaf of bread is more than $4$ dollars, but there are loaves that cost less.
Practice Problems
- A researcher asks families what type of milk they normally drink and records the responses: (whole, skim, skim, 1%, 2%, 2%, whole, 2%, 2%, skim, 2%, whole, 1%, 2%). What is a typical response to this survey?
- Find the mean, median, and mode of the following data set.
$(44, 45, 43, 40, 39, 39, 44, 45, 49, 55, 30, 47, 44)$. - What can be said of a data set where the mean, median, and mode are all the same?
- Carlos has a credit card that tells him his average purchase over a one week period is 15.00 dollars. He remembers the value four of the five purchases he made as 5.00, 7.50, 22.00, and 38.00. What is the value of the fifth purchase he made? How does the mean of these values compare to the median and what does that indicate?
- Create a data set with a mode of $1$, and median of $2$, and a mean of $0$.
Answer Key
- The mode is 2%. Since whole milk is 3.5% milkfat and skim is 0% milkfat, it would also be possible to find a mean and a median milkfat percentage as approximately $1.75%$ and 2% respectively.
- Mean is $43.38$, median is $44$, and mode is $44$.
- Such a data set would be highly symmetric about its central values. If there were major outliers, there would be an equal number of upper and lower outliers.
- The missing purchase value is $17.5$. The median is also $17.50$. This is not much higher than the mean, so the data just has a slight skew to the right.
- There are many examples. One is $(-17, 1, 1, 1, 2, 3, 3, 3, 3)$.
Images/mathematical drawings are created with GeoGebra.