JUMP TO TOPIC [show]
Relative Frequency – Definition and Examples
Relative frequency is the probability of an event happening.
Relative frequency is calculated as the number of times an event occurs divided by all possible outcomes. It can be based on observed results in a sample or theoretical outcomes.
Statistics and probability use relative frequency extensively. It is also vital in fields such as biology and engineering, which employ probability and statistics to learn about the world and test medical treatments and new technology.
Before moving forward with this topic, make sure to review statistical frequency and frequency tables.
This section covers:
- What is a Relative Frequency?
- How to Find a Relative Frequency
- Relative Frequency Definition
- Relative Frequency Example
What Is a Relative Frequency?
Relative frequency is the probability that an event occurs.
Recall that frequency is the absolute number of times that an event occurs in a sample. Frequency is also the theoretical number of ways an event can occur.
For example, suppose a sample found that, in a survey,
But is
Unfortunately, however, this frequency statistic doesn’t mean much if the population sampled isn’t known. This is why relative frequency is more helpful. It is the frequency relative to a given population.
How to Find a Relative Frequency
Finding the relative frequency is equal to the frequency of an event divided by the population. It thus requires first finding the frequency and the population.
The frequency and the population can be based on two different things. They could be based on either a sample or based on known possible outcomes.
For example, asking
Alternatively, the frequency can be based on theoretical outcomes. An example of this is Punnet squares in genetics.
This relative frequency is always expressed as a probability. Recall that a probability of
Relative Frequency Definition
Relative frequency is the probability of an event occurring based on all possible events.
Mathematically, the relative frequency is the number of favorable outcomes divided by all possible outcomes. It can be based on observed favorable and possible outcomes such as a survey. It can also be based on theoretical results, as in genetics.
Relative Frequency Example
Suppose Beau flips a coin. What is the relative frequency of him seeing heads?
There are two possible outcomes, and each is equally likely. Therefore, the number of favorable outcomes is
Alternatively, Beau could flip the coin
In this case, the observed relative frequency does not match the theoretical relative frequency. A larger sample would likely have an observed relative frequency closer to the theoretical one. This also illustrates why drawing conclusions from a sample works better with larger samples.
Examples
This section covers common examples of problems involving relative frequency and their step-by-step solutions.
Example 1
Consider the data set
Calculate the relative frequency of
Solution
It might be helpful first to order the data. That is
Now, how many outcomes match the first event,
Now, how many outcomes are greater than or equal to
Example 2
A person with blood type AB carries one allele for A and one allele for B. A person with blood type O has two O alleles. O is always recessive, so a person only has that blood type if both alleles are O. Otherwise, an AO person is type A, and a BO person is type B.
What is the probability of a child with parents who are AB and O having type AB blood? Type A? Type B? Type O?
Solution
The easiest way to do this problem is to first create a Punnet square with all possible outcomes.
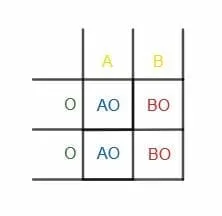
As shown in the square, there are four possible outcomes. The AB parent could give an A while the O parent gives the first O. Likewise, the AB parent could give an A while the O parent gives the second O.
Similarly, the AB parent could give a B while the O parent gives the first O or the second O.
The result is that in the first two scenarios, the offspring has blood type AO. In the second, the child has a BO blood type. These result in A and B blood, respectively.
Therefore, there are
There are no ways for the child to have O or AB blood. Therefore, the probability of each of those events is
This example illustrates an important point. The relative frequency of all events must add up to
Example 3
A group of students participates in sports. There are
Calculate the relative frequency of a student playing at least one sport and the relative frequency of a student playing both football and soccer.
Solution
It may initially seem like the best way to calculate the relative frequency of a student playing at least one sport is first to add together the number of students who play football and then the number of students who play soccer.
But, in this case, some students play both. They would be double-counted using this method!
The better method is to recall that the probability of all events is
Next, to find the number who play both football and soccer, find the difference between the total number of football players plus the total number of soccer players minus the number of students who play at least one sport.
The relative frequency of playing both sports then is
Example 4
A group of people is about whether they have a laptop, a tablet, or both. In the sample,
Ali says that the probability that a person had both a laptop and a tablet is
Solution
The numerator of Ali’s fraction is indeed the number of people who had both a laptop and a tablet. The denominator, however, is the number of people who had a laptop (whether they also had a tablet or not).
His calculation is the number of people with a laptop and tablet, given that the person had a laptop. This is not the same as the general probability that a person has both. This statistic is actually called the marginal frequency. It is the probability of an event given that another event occurs. It is the probability within a subset of an event.
The relative frequency should instead be
Thus, the actual relative frequency is
Example 5
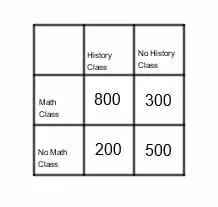
The table shows the number of first-year students at a local community college who are taking a math class, a history class, both, or neither. Use the table to calculate the relative frequency of a first-year student taking math.
Solution
The relative frequency of a first-year student taking math is equal to the number of first-year students taking math divided by the total number of first-year students.
Since each student who takes math either takes history or doesn’t, the total number of first-year students taking math is equal to
Likewise, each first-year student either takes math, history, both, or neither. Therefore, the total number of first-year students is equal to
Thus, the relative frequency of a first-year student taking math is
Practice Problems
- A bag contains
- A person pulls a ball out of a bag 10 times. She gets a green ball
- What is the theoretical probability of randomly rolling two dice and each displaying one?
- A game board spinner has eight colored slices on it. Each color has an equal amount of space. There are two red slices, two green, and four blue. What is the relative frequency of not spinning blue?
- What is the relative frequency of getting all heads when flipping three coins?
Answer Key
- There are