JUMP TO TOPIC
Cos Graph – Explanation and Examples
The cos, or cosine, graph has a wave shape with a y-intercept of $1$ and a midline of $y=0$.
This graph has the same shape and midline as the sine graph. In fact, it is the same as the graph of sine with a horizontal shift of $\frac{\pi}{2}$. Like the sine function, the cosine function’s graph has important applications in physical sciences, especially in the study of electromagnetic radiation.
Make sure to read up on the sine graph before moving forward with this article as the cos graph is very similar.
What Does a Cos Graph Look Like?
A cos graph looks like a sine graph, and it has a wave-like shape, an amplitude of $1$, and a midline of $y=0$. Like the sine graph, the cosine graph is periodic with a period length of $2\pi$.
The main difference between the cosine graph and the sine graph is the y-intercept. For the sine function, it is $0$. For the cosine function, however, it is $1$.
Since the graphs are otherwise the same, the cos graph is just a horizontal shift of the sine graph. Specifically, it represents a shift of $\frac{3\pi}{2}$ units left or $\frac{\pi}{2}$ units to the right.
How To Graph a Cos Function
Graph a cos function by first setting up the graph and then by plotting some points. To begin, it helps to remember what the cos graph is: a graphical representation of the cosine ratio. The angles are the inputs, and the ratio is the output.
Therefore, label the y-axis “Ratios” and the x-axis “Angles.” Typically, the angles are measured in radians. On the y-axis, the ratios are just numbers, so there are no units.
The y-intercept of the cos function is $1$, so the point $(0, 1)$ is on the graph.
Next, plot the points corresponding to the cosine ratio at the quadrantal angles. The cosine ratio at $\frac{\pi}{2}$ is $0$, at $\pi$ it is $-1$, and at $\frac{3\pi}{2}$ it is $0$.
Finally, connect these points with a smooth wave. This wave will also go through the points $(\frac{\pi}{6}, \frac{3\sqrt{2}}{2})$, $(\frac{\pi}{4}, \frac{\sqrt{2}}{2})$, and $(\frac{\pi}{3}, \frac{1}{2}$.
Then, since the function is even, reflect this wave over the y-axis. It will then repeat every $2\pi$ radians.
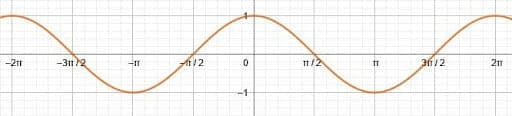
Cos Function Graph
The cosine function graph is a representation of the cosine function on the Cartesian plane.
The range of this ratio is $[-1, 1]$, but any angle measure is a valid input, so the domain is all real numbers.
This function is a wave with its midline at the x-axis. The deviation from the midline is $1$, which means its amplitude is $1$. Like the sine wave, its period is $2\pi$.
Certain transformations to the function can, however, change the amplitude and period. For a transformed cosine function of the form $acos(bx)$, the amplitude is the absolute value of $a$, and the period is $\frac{2\pi}{b}$.
Examples
This section goes over common examples of problems involving cos graphs and their step-by-step solutions.
Example 1
Find an equation for the sine graph using transformations of the function $y=cosx$.
Solution
Let the function $acos(bx+c)+d$ represent the cosine transformation that overlaps with the sine wave.
Since the amplitude of the two functions is the same, $a$ (or at least the absolute value of $a$) will be $1$. Since the two have the same period, $2\pi$, $b$ must also be $1$.
Similarly, since sine and cosine have the same midline, $d$ must be $0$.
But the $y$ intercept is different between the two. Therefore, there is a horizontal shift. Since the sine function’s y-intercept is $0$ and the cosine function’s is $1$, it is required to shift the cosine function until it has a value of $0$ and is increasing. This happens at $\frac{3\pi}{2}$ radians, so the whole graph must shift $\frac{3\pi}{2}$ units to the left.
Thus, the resulting function is $y=cos(x+\frac{3\pi}{2})$.
Example 2
Describe how the function $y=\frac{1}{2}cosx+1$ differs from the basic graph of cosine.
Solution
It helps to begin by analyzing the amplitude, period, and midline of the function.
Since the coefficient in front of the cosine function is $\frac{1}{2}$, the amplitude of the function is also $\frac{1}{2}$.
The midline is also different from the basic cosine function because there is a vertical shift of $1$ unit. Therefore, the midline is $y=1$.
Since the coefficient of $x$ is $1$ and there is no horizontal shift, there are no other changes to the graph.
Example 3
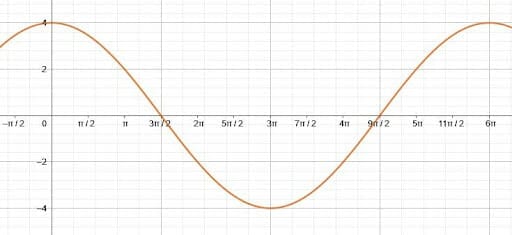
Graph the function $y=4cos(\frac{1}{3}x)$.
Solution
Again, begin by finding the midline, amplitude, and period of this function.
In this case, the amplitude is equal to the coefficient of cosine, $4$. The period is $\frac{2\pi}{\frac{1}{3}} = 6pi$. Since there is no vertical shift, the midline is still $y=0$.
Since the period is now $6\pi$, the new points along the $x$ axis coinciding with the quadrantal angles are $\frac{6\pi}{4} = \frac{3\pi}{2}$. That is, $\frac{3\pi}{2}$ has the same value as $4cos(\frac{\pi}{2})$, which is $0$, $3\pi$ has the same value as $4cos(\pi)$, which is $-4$, and $\frac{9\pi}{2}$ has the same value as $4cos(\frac{3\pi}{2})$, which is $0$.
Therefore, the function looks like this.
Example 4
Identify the graph of cosine shown.
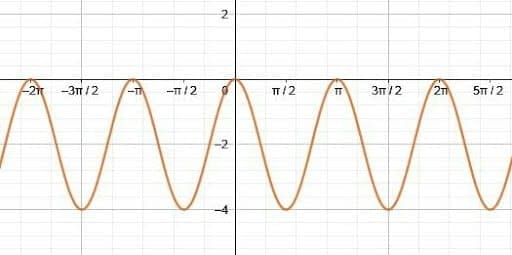
Solution
This cosine function will have the form $y=acos(bx+c)+d$.
The midline is $y=-2$, so there is a horizontal shift of $-2$. Therefore, $d=-2$.
Since the peaks are $2$ units above the midline, the amplitude is also $2$. This means $a$ is either $2$ or $-2$. Since, however, the y-intercept is above the midline, there is no reflection over the midline and $a=2$.
Finally, since the distance between two peaks is $\pi$ radians, the period is $\pi$. Solving the equation $\pi=\frac{2\pi}{b}$ for $b$ yields $b=2$.
There are no other changes from the basic cosine function, so the equation for the graph shown is $y=2cos(2x)-2$.
Example 5
Describe the function $-cos(-x)$.
Solution
Recall that cosine is an even function. This means that $cos(-x) = cosx$.
Therefore, the function $-cos(-x) = -cosx$.
The other negative sign will reflect the function over the $x$ axis, which is also the midline. Therefore, the y-intercept will be $-1$ instead of $1$. All of the x-intercepts will stay the same, but whether the function is increasing or decreasing at that point will change.
Practice Questions
Images/mathematical drawings are created using Geogebra.