JUMP TO TOPIC
Discrete Data – Explanation and Examples
Discrete data is data that only occurs at certain intervals.
Continuous data is the opposite of discrete data since it includes all possible numbers. While the interval for discrete data is often $1$, it can be any real number.
All areas of math and science include discrete data. It is important for young children just learning math and for doctoral candidates studying graph theory. In fact, there is an entire branch of mathematics called discrete data focuses on the study of non-continuous structures.
This section covers:
- What is Discrete Data?
- Discrete Data Definition
- Discrete Data Examples
What is Discrete Data?
Discrete data is data that only occurs in certain intervals. Essentially it is data that is not continuous.
Think of the integers. The set of integers are discrete because they do not include, for example, the numbers between $0$ and $1$ or between $1$ and $2$.
Sometimes data is discrete because the instruments used to measure it have limited accuracy. For example, a thermometer may only measure to the nearest one-tenth of a degree, so temperatures would only be recorded to the nearest tenth.
Other times, data is discrete because the variable itself is non-continuous. For example, American currency is measured in increments of $0.01$. It would not make sense to say that someone has $\frac{3}{8}$ of a cent or $\sqrt{2}$ cents.
Discrete Data Definition
Discrete data is data that only occurs at certain points on certain intervals. Specifically, discrete data is countable and non-continuous.
Note that, more often than not, discrete data is defined as non-continuous data.
Floor and Ceiling Functions
Floor and ceiling functions are non-continuous functions that take a set value for a range of numbers. Ceiling function round up while floor functions round down.
For example, consider a function that takes a student’s age and spits out the student’s grade. Suppose a state says, for example, that all students who turn $5$ between September 1 of the previous year and August 31 of this year can enter kindergarten this year. The age of the students is continuous because a student could, theoretically, be $5.6293$ years old at a given moment. However, the grade that a student is entering is discrete. This function would take all students who are from $5.0$ to $5.9999$ years old on August 31 and map them to $0$ (for grade 0, kindergarten).
In this case, then, a floor or ceiling function maps a continuous variable onto a discrete variable.
Discrete Data Examples
Suppose Amy goes to the store and buys boxes of cereal. How many boxes can she buy?
$1$ box is fine. $0$ boxes is fine. $5$ boxes or even $50$ boxes makes sense (although that’s a lot of cereal!).
It does not, however, make sense to say Amy bought $9 \frac{3}{4}$ boxes of cereal.
Why?
Cereal is sold by the box. Therefore, one cannot buy fractions or decimals of a box. And certainly no one buys an irrational number of boxes!
No. Amy can only buy a whole number of boxes. The number of boxes she buys is therefore discrete with intervals of $1$.
As mentioned before, although $1$ is a common interval for discrete data, it is not the only one.
Consider, for example, United States shoe sizes. Shoe sizes exist in increments of $\frac{1}{2}$. This is why it makes sense for someone to have a shoe size of $6 \frac{1}{2}$ but not a shoe size of $6 \frac{7}{8}$.
Certainly someone could have a foot that is larger than a $6 \frac{1}{2}$ and smaller than a $7$, but such a person would probably just have to go a size up.
Common Examples
This section goes over common examples of problems involving discrete data and their step-by-step solutions.
Example 1
A school is planning a field trip. They want to take students on buses that each carry $54$ people.
There are $625 people who plan to attend the field trip. How many buses should the school rent for the day?
Solution
At first, this seems like a straightforward division project. The number of buses is equal to the number of people divided by the number of people each bus can carry.
One must consider the answer in context though. Dividing $625$ by $54$ yields $11.5\bar{740}$. It doesn’t make sense for the school to rent out a repeating decimal of school buses!
Instead, the school has to look at renting a whole number of school buses. They can either rent $11$ school buses or $12$ school buses. If they rent $11$, there will be students who do not get on a bus. If they rent $12$, they will have some empty seats.
Most likely, the school would prefer the latter case and decide to round up to $12$ school buses.
Example 2
An electric company, a gas company, a water company, and an internet company all want to run lines to $5$ homes in a particular neighborhood.
Each utility wants to create a line that goes from its headquarters to each home. How many connections do they make?
Solution
This is actually a combinatorics problem
Combinatorics is the study of counting combinations and arrangements. It is an important branch of discrete mathematics.
This type of problem is a matching problem and involves creating connections between two or more different categories. In this case, the categories are homes and utilities.
To connect the $4$ utilities to the $5$ homes requires making a connection from each utility to each home.
In this case, each utility have $5$ connections, so there are $4 \times 4 = 20$ total connections.
A more interesting version of this problem involves being able to tell whether or not these connections will cross, but that is beyond the scope of this article.
Example 3
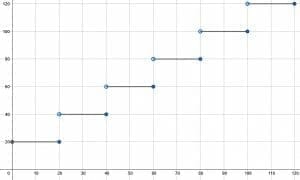
An ATM only dispenses $20$ dollar bills. If someone needs less than or equal to $20$ dollars, they will need to get one $20$ bill. If they need more than $20$ but less than or equal to $40$ dollars, they will need two twenty dollar bills, and so on.
Graph a function representing the amount of money someone needs to get from the ATM based on the amount of money they need to spend. That is, graph a function that takes every number and maps it to the next multiple of $20$ above that number.
Solution
This is a kind of ceiling function that uses twenties instead of ones.
Typically, a ceiling function takes all numbers greater than, say, $0$ and less than or equal to $1$ and maps them to $1$.
In this case, every number maps to the multiple of $20$ above it. This means that all the numbers greater than $0$ and less than or equal to $20$ map to $20$. Similarly, all numbers greater than $20$ and less than or equal to $40$ map to $40$ and so on.
Such a graph will be a series of horizontal lines $20$ units in length and at intervals of $20$. The left side of these bars will be an open dot and the right side will be a closed dot. This is because if someone needs more than $20$, even $20.01$ dollars, they need to get $40$ from the ATM because $20$ will be insufficient.
It’s also important to notice that, while money is technically discrete since it occurs in intervals of $0.01$, most graphs show it as continuous because intervals of $0.01$ are so tiny that such a graph ends up looking continuous.
The final graph looks like this:
Example 4
Is it possible for a measure of centrality for a discrete data set to fall between counted intervals? How should this be interpreted?
Solution
As discussed previously, there are many measures of centrality, but the most common ones are mean, median, and mode.
Mode cannot be a number outside possible values for the data set. This is because mode is the most commonly occurring value, which must be a value that is possible to achieve.
Mean, however, can be any rational number with a denominator equal to the number of terms in a data set. This means that it can be outside possible values.
For example, consider what happens when the average number of students is class is $21.\bar{7142857}$. That is, the mean number of students is a non-repeating decimal.
Likewise, what happens when the mean number of students is $21.5$?
In such cases, the mean and median are interpreted in context. Often, as in the number of students in a class example, the mean and median are stated as “more than $21$”.
Example 5
Categorize the following examples of data sets as discrete or continuous or neither.
A. A star-based rating system for restaurants.
B. A list of consumer’s favorite restaurants.
C. The mass of leftovers at a restaurant.
Solution
Option A is discrete, option C is continuous, and option B is neither. In particular, options B is qualitative data that is not easily coded as quantitative data.
How does one determine this? Basically, start by asking whether each thing is countable. Is the number of stars a restaurant has countable? Yes. It can either have one, two, three, four, or five stars. But is the mass of leftover food countable? No. It is possible to have 4.293 pounds of leftover food. And, when it comes to favorite restaurants, numbers are not even involved.
Practice Problems
- Classify the following as discrete, continuous, or neither:
A. The color of a blanket.
B. A blanket’s surface area.
C. The number of stitches in a blanket.
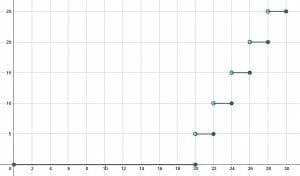
- An airline does not charge for luggage less than 20 pounds, but it charges five dollars for every two pounds over 20 pounds. Make a graph of the function representing the cost to bring different weights of luggage.
- Interpret the median of the following data set in context. The number of cars in different families is, according to a survey, is $(0, 0, 1, 1, 2, 2, 2, 4)$.
- A manager wants to do a training program where one senior member mentors two new trainees. If there are 2 senior members and 4 trainees, how many different ways are there to pair senior members with trainees?
- A pizza feeds $8$ people. There are $66$ people at a party. How many pizzas are needed to feed everyone?
Answer Key
- A is neither, B is continuous, C is discrete.

- The typical family has more than one car or at least one car.
- (Combinatorics question) 24 ways.
- 9 pizzas.
Images/mathematical drawings are created with GeoGebra.