JUMP TO TOPIC
Accuracy|Definition & Meaning
Definition
Accuracy is a term used to define how close different results or attempts are as close to the correct value. Let us take an example of a reading of the thickness of metal. The correct value is close to 1mm. but the physical measurements read either 1.3 mm, 1.2 mm, or 0.8 mm. Hence, this concludes that the tool is accurate to about 0.3 mm of the true value.
Furthermore, this means that if a measuring device gives a very different value from the actual value, it is inaccurate and faulty for usage. Furthermore, if a device gives measurement values closer to the actual value, it is considered to be accurate.
Accuracy and Precision
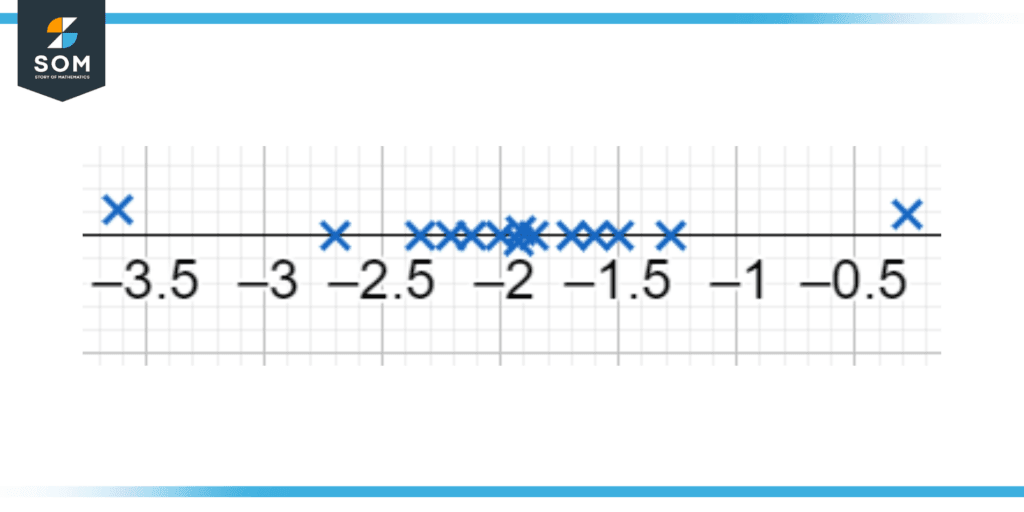
Usually, accuracy and precision go hand in hand. Where accuracy is the closeness of a measured value to a true value, precision means how close the measured values are to one another, irrespective of the actual value.

Figure 1: Accuracy and precision of a different set of points on a number line
There are certain cases where measured values are considered inaccurate but are precise. This means that the values are close to one another but are far away from the actual value. In another case, measured values are accurate but are not precise. This implies that the values are close to the actual value but are far away from each other.
Errors
Errors are the difference between a measured value from its true value. A high error value means that the measuring device is inaccurate and vice versa is also true. Furthermore, there are two types of errors that can hinder the accuracy of data calculated or measured. These two errors are:
- Systematic Error
- Random Error
The systematic error implies that there is a systematic defect in the device that causes the results to be inaccurate but are all precise. This means that there is a “bias” caused by the measuring device.
Random Errors imply the randomness in errors caused by the random effect of external natural factors, such as air or the way the measurement is taken causing the error to be random. Hence these errors are hard to remove and give an accurate result. They are usually not precise.
Significance of Accuracy
As stated above, accuracy is basically how close the value is to the correct value. Now, this accuracy can have multiple applications in innumerable fields of science and statistics.
Let us take an example of measuring a length of a bar. The correct length of a bar is stated to be 1.5 meters. After using a measuring tape to measure the length about 3 times, we get the following results: 1.6 m, 1.55 m, and 1.45 m. The values are fairly close to the actual value, hence they are considered somewhat accurate.
Furthermore, we can take multiple measurements to find an average value of these measurements, which will further give a more accurate result.
The range at which there is an error between the original and measured value is called the “tolerance value.” This is usually expressed as “x value $\pm$ ”tolerance value.” They are commonly used in defining a standard for measuring instruments and devices and express how accurate they are in measuring unknown values.
Accuracy in Other Applications
Moreover, accuracy also can be used in statistics and numerical analysis where several sample data are taken by different calculation methods and have a certain accuracy to their results. Errors in these calculations are usually caused by approximations taken in calculations.
When constructing a new measuring device or calculation method, we first take multiple samples of the measured value and then calculate its error and tolerance value from the actual reference value.
For example, let us say we are constructing an ammeter to measure current. From the multiple samples taken when measuring a value of 15 Amperes, we find that the ammeter had a maximum error of 0.5 Amperes. This means that the tolerance value of this ammeter is $\pm$0.5 amperes, or we can say it is accurate to 0.5 A.
Visual Representation Using a Dartboard
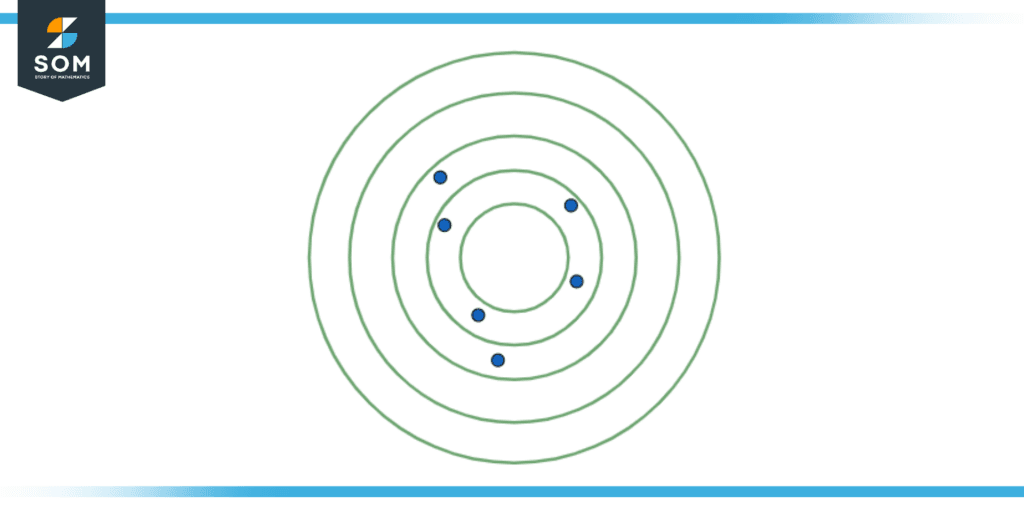
It is better understood when a visual aid is provided to explain accuracy and precision. The Figures below will give you a better insight into the fundamental meaning of the term accuracy and precision.

Figure 2: Low Accuracy and low precision of the dots on the target.
Here we consider a target with the center of the circles being the true value. Figure 1 shows that the attempts on hitting the target were far away and scattered amongst themselves. Hence, they are having a low accuracy and as they are far from each other, they have low precision.

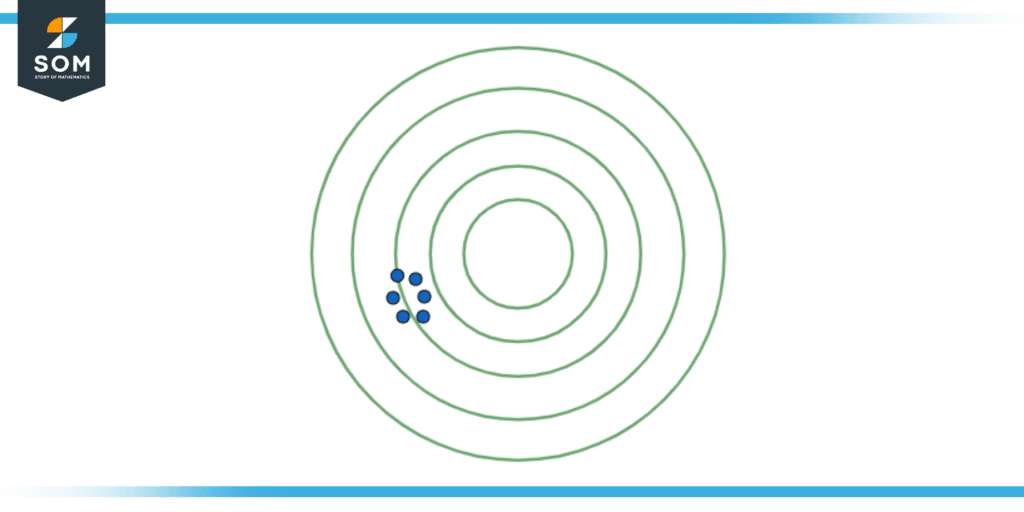
Figure 3: Low Accuracy but high precision of the dots on the target.
In our 2nd case, as shown in Figure 2, we can observe that the attempts are far away from the intended target (the center of the circle). Hence, the attempts are low in accuracy. However, these attempts are close to one another. Thus, we can conclude that the attempts are high in precision. This might imply that there is a systematic error or a bias in the attempts that can be fixed by removing the source of bias.

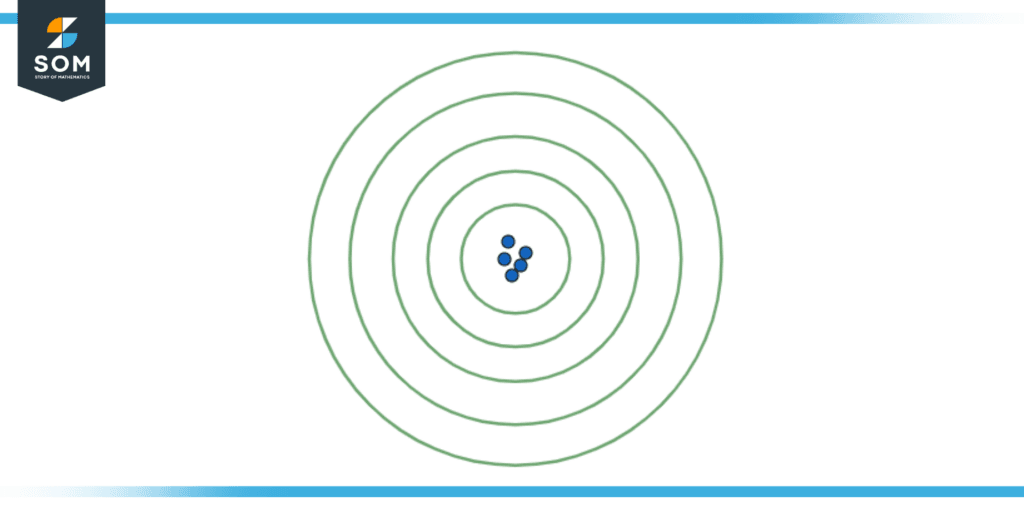
Figure 4: High Accuracy and High precision of the dots on the target.
In our 3rd case, as per Figure 3, we can see that the attempts are close to the intended target and they are also close to each other. Hence, we can conclude that the attempts are highly accurate and precise.
Finding the Accuracy of Given Data – An Example
Consider a set of values: 12, 15, 13, 14, 13, 15. The reference value that is true for this case is 13.5. Conclude whether this set of values is accurate or not. If they are accurate, find their tolerance value as well. Are they precise?
Solution
The set of values 12, 13, 14, 13, 15, and 15 are close to the true value of 13.5. Hence, they are accurate.
Their tolerance value is found by calculating the highest possible error. In our case, the farthest value in the set from the true value is 12 and 15. Subtracting them from the original value, we get 13.5 -12 = 1.5 or 15 – 13.5 = 1.5. Hence the resulting value can be written as 13.5 $\mathbf{\pm}$ 1.5.
The values are fairly close to each other, so they can be considered precise.
All mathematical drawings and images were created with GeoGebra.
